UNIVERSIDADE DE LISBOA
FACULDADE DE CIÊNCIAS
DEPARTAMENTO DE BIOLOGIA ANIMAL
Role of β-adrenergic signalling in ovarian cancer cells
biology
Cátia Marisa Soares Silva
Dissertação
Mestrado em Biologia Evolutiva e do Desenvolvimento
2014
I
UNIVERSIDADE DE LISBOA
FACULDADE DE CIÊNCIAS
DEPARTAMENTO DE BIOLOGIA ANIMAL
Role of β-adrenergic signalling in ovarian cancer cells
biology
Cátia Marisa Soares Silva
Dissertação orientada por Prof. Doutora Laura Ribeiro (CIM/FMUP)
Orientador interno: Prof. Doutora Gabriela Rodrigues (CBA/FCUL)
Mestrado em Biologia Evolutiva e do Desenvolvimento
2014
III
“Life is like riding a bicycle.
To keep your balance, you must keep moving.”
V
Agradecimentos
Em primeiro lugar gostaria de agradecer à Professora Doutora Laura Ribeiro pela possibilidade que me deu de trabalhar nesta área que me desperta grande interesse. Por me ter orientado, por todo o empenho, dedicação e entusiasmo.
Um agradecimento especial à Marisa Coelho com quem partilhei todos os momentos desta caminhada e a qual sempre esteve disponível quer no que diz respeito ao trabalho, quer ao nível pessoal. Pelos bons momentos que passámos, pelas gargalhadas, pelas brincadeiras, mas principalmente pelas discussões, a meu ver sempre construtivas, que tivemos nas longas horas de trabalho.
Ao Professor Doutor Marco Consentino do Departamento de Ciência Cirúrgica e Morfológica da Escola de Medicina da Universidade de Insúbria pela gentileza de nos ter cedido as células utilizadas no estudo.
Ao Departamento de Farmacologia da Faculdade de Medicina da Universidade do Porto, particularmente à Engª. Paula Serrão pela simpatia e disponibilidade.
Ao Departamento de Fisiologia e Cirurgia Cardiotoráxica, em especial à Dra. Maria José Mendes também pela disponibilidade e empenho prestados.
A todos os elementos do Departamento de Bioquímica da Faculdade de Medicina por me terem acolhido ao longo deste ano, em especial à Andreia Gomes pelos bons momentos e pela ajuda no tratamento estatístico dos resultados obtidos, ao Pedro, à Margarida e ao André pela amizade ao longo deste ano.
À Professora Doutora Gabriela Rodrigues pela orientação interna e pela preocupação que sempre demonstrou no decorrer do trabalho, para que tudo corresse pelo melhor. Um último agradecimento, mas muito especial, aos meus familiares por todo o apoio que sempre me prestaram em toda a minha vida, não sendo exceção este ano decorrido. À minha mãe, ao meu pai e ao Vasco, muito obrigada!
Por estarem sempre por perto e por me apoiarem em todas as situações, foram as pessoas responsáveis por me fazer encarar cada dia com um sorriso e com vontade de encarar as adversidades.
VII
Abstract
Human ovarian cancer is the seventh most common tumour in women worldwide and the leading cause of death from gynaecological cancers. Nowadays, there is strong evidence that stress affect cancer progression and patient survival. However, the underlying mechanisms of this association are poorly understood. The catecholamines (CA), adrenaline (AD) and noradrenaline (NA), are released in response to stress, exerting their effects through interaction with adrenergic receptors (AR) termed α and β. β-AR expression has been identified on several ovarian cancer cells. The activation of these receptors triggers several pathways that alter tumour microenvironment, being associated to carcinogenesis and tumour progression. β-blockers have a long history of use for treatment of arrhythmia, hypertension, anxiety, and heart failure treatment, among others. Epidemiological studies show that β-blockers are associated with a decrease of cancer mortality and studies about the efficiency of β-AR as a possible treatment for cancer are acquiring strength. The effects of several β-blockers with distinct intracellular target profiles in human ovarian cancer cells SKOV-3 biology were investigated. Cellular proliferation and migration ability after exposure to the agonists AD, NA and isoprenaline (ISO) and the antagonists propranolol, carvedilol, atenolol and ICI 118,551 per se, or combined with each other, was investigated. AD was able to significantly increase the proliferation of SKOV-3 cells, ISO induced a tendency to increase proliferation, whereas NA had no effect. Our results suggest that β-blockers reduce SKOV-3 cells proliferation, but, similarly to the tested agonists, have no effect on SKOV-3 migration. This study might contribute to elucidate which are the most effective β-blockers in reverting CA induced proliferative effects in ovarian cancer cells and, consequently, to be used as promising strategies in cancer treatment.
Keywords: Stress, catecholamines, adrenergic receptors, β-blockers, SKOV-3,
VIII
Resumo
O cancro do ovário é o sétimo cancro mais comum nas mulheres em todo o mundo e aquele que apresenta uma maior taxa de mortalidade de entre os cancros ginecológicos. A resposta ao stresse conduz à ativação de dois sistemas neurohumorais, o eixo hipotálamo-hipófise-suprarrenal e o sistema simpatoadrenomedular, que libertam cortisol e catecolaminas (CA), respetivamente, exercendo um papel crucial na função cardiovascular e no metabolismo energético. No entanto, esses sistemas, sob influência dos padrões de vida atual, por exemplo quando repetidamente ativados por longos períodos de tempo, podem deixar de ter uma ação adaptativa e conduzir a doença. De acordo com isto, fortes evidências sugerem que o stresse crónico está associado à progressão do cancro e também à taxa de sobrevivência. No entanto, os mecanismos envolvidos na ligação entre a exposição ao stresse e os efeitos na biologia tumoral são ainda mal conhecidos. As CA, adrenalina (AD) e noradrenalina (NA), como referido acima, são libertadas a partir do sistema simpatoadrenomedular em resposta ao stresse, exercendo os seus efeitos através da interação com recetores adrenérgicos do tipo α e β. Os recetores adrenérgicos, preferencialmente os do tipo β, estão expressos em várias células de cancro do ovário. A ativação destes recetores por sua vez promove a ativação de várias cascatas de sinalização que alteram o microambiente tumoral, estando associadas à progressão dos tumores e a eventos como a carcinogénese. Na verdade, vários estudos mostraram a relação entre os recetores adrenérgicos β e parâmetros de dinâmica celular como a angiogénese, a proliferação, a apoptose, a inflamação, a resposta imunitária, a migração, a invasão e a formação de metástases. Os bloqueadores β são usados clinicamente há décadas no tratamento de sintomas e patologias como arritmias, hipertensão, ansiedade, e insuficiência cardíaca, entre outros. Estudos epidemiológicos relativos a vários tipos de cancro têm mostrado que os bloqueadores β estão associados a uma diminuição da taxa de mortalidade. Como tal, esforços têm sido desenvolvidos no sentido de estudar a eficácia destes fármacos como adjuvantes no tratamento do cancro. Curiosamente, os estudos epidemiológicos também têm revelado que nem todos os bloqueadores β apresentam este benefício sobre a mortalidade e a agressividade dos tumores. Na nossa opinião isso pode dever-se aos diferentes perfis farmacológicos destes fármacos. Neste trabalho foram avaliados os
IX
efeitos de vários bloqueadores β, com diferentes perfis farmacológicos para alvos intracelulares, na biologia de células humanas de cancro do ovário denominadas SKOV-3. Para este propósito, avaliou-se o efeito dos agonistas AD, NA e isoprenalina (ISO; agonista adrenérgico sintético com elevada afinidade para os recetores β) e dos antagonistas, propranolol (PRO; não seletivo para os recetores adrenérgicos β ), carvedilol (CAR; não seletivo para os recetores adrenérgicos β e seletivo para os α1), atenolol (ATE; seletivo para os recetores adrenérgicos β1) e ICI 118,551 (ICI; seletivo para os recetores adrenérgicos β2), quando aplicados isoladamente e em combinação agonista/antagonista na proliferação e migração destas células. Numa primeira fase do trabalho, foram estabelecidas curvas de crescimento da cultura celular durante oito dias para caracterizar os parâmetros dinâmicos deste tipo de células. Posteriormente, foram realizadas várias experiências com o intuito de determinar os valores de EC50 e IC50, respetivamente para o efeito proliferativo e anti-proliferativo dos vários agonistas e antagonistas dos recetores adrenérgicos. De todos os agonistas em estudo, apenas a AD aumentou significativamente a proliferação das células SKOV-3, a ISO tendencialmente aumentou a proliferação destas células e a NA não teve qualquer efeito. No sentido de esclarecer quais os subtipos de recetores adrenérgicos que estariam envolvidos no aumento da proliferação induzida pelos agonistas, as células foram previamente tratadas com diferentes antagonistas, e depois igualmente expostas a estes fármacos em simultâneo com os agonistas. À exceção do CAR, todos os antagonistas foram capazes de reverter o efeito proliferativo da AD e da ISO. Apesar da NA não ter tido efeito por si só na proliferação das células SKOV-3, todos os antagonistas, quando aplicados em simultâneo com esta amina foram capazes de reduzir significativamente a proliferação destas células. Estes resultados estão de acordo com o facto de estes antagonistas terem já sido descritos como agonistas inversos, mostrando a complexidade dos seus efeitos na proliferação celular. Este é um dado importante a ter em conta no estudo dos efeitos dos bloqueadores β na proliferação celular e noutros parâmetros biológicos, uma vez que isto pode explicar a maior ou menor eficácia de alguns destes fármacos como adjuvantes no tratamento do cancro. Os nossos resultados sugerem que os bloqueadores β diminuem a proliferação das células SKOV-3, mas, tal como os agonistas testados, não têm qualquer efeito na migração. De facto, as experiências de avaliação da capacidade de migração celular realizadas 6, 24 e 30 horas
X
após os tratamentos com os vários fármacos em estudo (AD, NA, ISO, PRO, ATE, CAR e ICI) não mostraram qualquer efeito neste parâmetro. A concentração de CA é cerca de 10 vezes superior no ovário comparativamente à encontrada em circulação. Alguns autores sugerem que isto se deve a uma elevada inervação simpática dos tecidos ováricos, que concorre para uma elevada concentração de CA nestes tecidos, mas outros referem a possibilidade das células do ovários serem capazes de produzir CA. No sentido de esclarecer se as células SKOV-3 produzem estas aminas, realizou-se um estudo piloto de quantificação de CA por cromatografia líquida de alta pressão com deteção eletroquímica (HPLC-ED). Os resultados mostraram que estas células são capazes de produzir NA, mas não AD. A realização de mais experiências permitirá esclarecer estes resultados preliminares e desenhar novas metodologias para aprofundar o estudo da produção de CA endógenas por células de cancro do ovário, uma vez que novas e interessantes perspetivas se adivinham com estes achados. Em conjunto, os nossos resultados sugerem que a ativação adrenérgica desempenha um papel importante na proliferação das células do cancro do ovário, muito provavelmente através dos recetores adrenérgicos β (β1 e β2), dado que, salvo uma exceção, os antagonistas utilizados reduziram a proliferação destas células, sendo o PRO (um bloqueador β não seletivo) o mais eficaz na reversão dos efeitos da AD. O CAR, o PRO e o ATE têm atualmente várias aplicações clinicas. A possibilidade de que estes e outros bloqueadores β possam ser utilizados com outros fins terapêuticos, que não os clássicos, torna-se muito atrativa para efeitos comerciais. No entanto, é necessário aprofundar o conhecimento relativamente às vias de sinalização adrenérgicas β envolvidas na proliferação de células do cancro do ovário, de forma a desenvolver novos bloqueadores β com maior seletividade para estas vias, ou aproveitar fármacos já comercializados que possam ser úteis para prevenir e/ou tratar este cancro. Novos estudos poderão assim passar por investigar as vias de sinalização implicadas nestes efeitos através da utilização de inibidores seletivos. Estudos como este podem assim contribuir para elucidar quais os bloqueadores β que de forma mais efetiva revertem os efeitos proliferativos induzidos pelas CA (libertadas excessivamente por exemplo em resposta ao stresse) em células de cancro do ovário, e que consequentemente poderão ser usados como estratégias promissoras no tratamento deste tipo de cancro. Presentemente, estão a decorrer três estudos clínicos que pretendem avaliar a
XI
segurança e a eficácia dos bloqueadores β no tratamento do cancro da mama, colorectal e do ovário que vêm assim corroborar a atualidade e o interesse do tema da nossa investigação.
Palavras-chave: Stresse, catecolaminas, recetores adrenérgicos, β-bloqueadores,
XIII
Abbreviations
AD - Adrenaline
ANS - Autonomic nervous system AR - Adrenergic receptor
ATE – Atenolol
BARK - β-adrenergic receptor kinase
B-RAF - B-Raf/mitogen-activated protein kinase BrdU - 5-bromo-2-deoxyuridine
CA - Catecholamines
cAMP - Cyclic adenosine monophosphate CAR - Carvedilol
CNS - Central Nervous System
CREB - cAMP response element-binding DAG - Diacylglycerol
DMSO - Dimethyl sulfoxide DOPA - Dihydroxyphenylalanine DβH - Dopamine-β-hydroxylase
EMT - Epithelial–mesenchymal transition
EPAC - Exchange protein activated by adenylyl cyclase FAK - Focal adhesion kinase
FBS - Fetal bovine serum
HPA - Hypothalamic-pituitary-adrenal axis ICI - ICI 118,551
IP3 - Inositol trisphosphate ISO - Isoprenaline
MAPK - Mitogen-activated protein kinase
MEK1/2 - MAP/extracellular signal-regulated kinase
MTT - 3-(4,5-di- methyl-thiazol-2-yl)-2,5-diphenyltetrazolium bromide NA - Noradrenaline
PBS - Phosphate buffer saline PI3K - Phosphatylinositol-3 kinase
XIV
PKA - Protein kinase A
PNMT - Phenylethanolamine-N-methyltransferase PRO - Propranolol
Ptdlns-4,5-P2 - Phosphatidilinositol 4,5 –bisphosphate
Rap1A - Ras-like guanine triphosphatase SAMS - Sympathetic adrenomedullary system SNS - Sympathetic nervous system
STAT-3 - Signal transducer and activator of transcripton-3 TH - Tyrosine hydroxylase
Tyr - L-Tyrosine
XV
Contents
Agradecimentos ... V Abstract ... VII Resumo ... VIII Abbreviations ... XIII 1. Introduction ... 1 1.1. Cancer ... 3 1.2. Ovarian Cancer ... 41.3. Stress and Allostatic Systems ... 5
1.4. Stress Response ... 6
Catecholamines synthesis ... 6
The sympatho-adrenomedullary system ... 7
1.5. Adrenergic receptors... 8
Adrenergic Drugs ... 8
α-AR Triggering Pathways ... 9
β-AR Triggering Pathways ... 10
1.6. Stress and cancer ... 12
1.7. β-blockers and cancer ... 13
2. Materials and Methods ... 15
2.1. Materials ... 17
2.2. Cell culture procedures ... 17
2.3. Treatments ... 18
2.4. Cell Growth Curves ... 19
2.4.1. Trypan blue exclusion assay ... 19
2.4.2. MTT assay ... 19
2.5. Determination of EC50 and IC50 values ... 20
2.6. Cell proliferation studies ... 20
2.6.1. Incorporation of 5' bromodeoxyuridine (BrdU) ... 20
2.6.2. MTT assay ... 21
2.7. Cell Migration studies ... 21
XVI
2.8. Determination of catecholamine content ... 22
2.8.1. High pressure liquid chromatography with electrochemical detection assay . 22 2.9. Statistical analysis ... 22
3. Results ... 25
3.1. SKOV-3 cells growth curves ... 27
3.2. Determination of EC50 and IC50 values ... 28
3.2.1. Determination of EC50 values for agonists ... 28
3.2.2. Determination of IC50 values for β-blockers ... 29
3.3. Effect of β-blockers on SKOV-3 cells proliferation... 30
3.3.1. Effect of agonists and antagonists per se on cell proliferation ... 30
3.3.2. β-blockers influence on adrenaline effect ... 31
3.3.3. β-blockers influence on noradrenaline effect ... 32
3.3.4. β-blockers influence on isoprenaline effect ... 33
3.1. Effect of chronic treatment (24 hours) with adrenergic agonists and β- blockers on SKOV-3 cells Migration ... 35
3.2. Determination of catecholamine content by high pressure liquid chromatography with electrochemical detection ... 38
4. Discussion ... 39
5. Final Considerations and Future work ... 47
1
3
1. Introduction
1.1. Cancer
Cancer development begins with the arising of abnormal cells that proliferate beyond their usual borders and can invade adjacent parts of the body and spread to other organs
on a multistep process denominated metastatic process 1.
On 2000, Hanahan & Weinberg defined the six hallmarks of cancer: self-sufficiency in growth signals, insensitivity to growth-inhibitory (antigrowth) signals, evasion from programmed cell death (cellular apoptosis), limitless replicative potential, sustained
angiogenesis, invasion and metastasis 1. Some years later, the same researchers
proposed two new emergent hallmarks: deregulation of cellular energetics and avoidance of immune destruction, and two enabling characteristics: genome instability
and mutation and tumour-promoting inflammation 2.
Many factors might contribute to the development of cancer. These factors include individual genetic factors and other internal or external agents, which can act simultaneously or sequentially on cancer promotion. About 30% of cancer deaths occur due to behavioural and dietary risk factors such as high body mass index, low fruit and vegetable intake, lack of physical activity, tobacco use and alcohol abuse. Among these risk factors, tobacco use is the most important, being responsible for 20% of global
cancer deaths and about 70% of global lung cancer deaths 3. Ageing is associated with
an inability for cellular repair, constituting an important factor for cancer development
4. Cancer figure among the leading causes of death worldwide, accounting for 8.2 million
deaths in 2012 3.
As a result of ageing and lifestyle adopted by modern societies an increase on cancer incidence within the next two decades from 14 million in 2012 to 22 million is expected 5.
4
1.2. Ovarian Cancer
Human ovarian cancer is the seventh most common tumour and the sixth cause of death for cancer in woman worldwide (Figure 1). It is also the major cause of death for
gynaecological cancers 5. This high mortality rate is essentially due to the fact that the
disease is usually diagnosed at late stages when tumours are already metastasized and because there is a lack of effective therapy for advanced disease. This has led to intense research efforts to identify effective screening strategies for ovarian cancer, but results
have been disappointing, particularly with regard to decreases in mortality rates 6.
Figure 1. Incidence and mortality among different cancers within the economically developed and
developing countries 5
Epidemiology of ovarian cancer includes modifiable and non-modifiable. The main
modifiable risk factors are those related to diet (e.g. high fat diet 7 and obesity 8) and
smoking 9. The main non-modifiable risk factors are age 4 and family history 10.
The advances in molecular genetics and the arising of Genome Wide Association Studies led to the identification of BRCA1 and BRCA2 gene mutations which predispose to the
hereditary breast/ovarian cancer syndrome 11. Mutations in mismatch repair genes
5
syndrome, are also associated with ovarian cancer occurrence 10. It is also known that
P53 gene mutation is tightly associated to ovarian cancer arousal 10. The incidence of
such genetic alterations on ovarian cancer patients makes the detection of this mutations very useful to identify risk groups.
1.3. Stress and Allostatic Systems
On 1930, Walter Cannon described for the first time the concepts of homeostasis (a complex dynamic equilibrium maintained by all living organisms) and that upon a threat the organism activates a “fight or flight” stress response firstly through the activation of the sympathetic nervous system (SNS). He also described that adrenal medulla and SNS operate as a unit and that adrenaline (AD) is not only the active mediator of the adrenal
medulla, but also a neurotransmitter in the SNS 12, 13.
The concept of stress was described for the first time by Hans Selye on 1976 as “…the nonspecific response of the body to any demand” who also described stressor as “… an
agent that produces stress any time” 14.
Allostasis, firstly described by Stearling and Eyer on 1988, refers to the process of
adaptation of the body upon the exposure to various stressors 15. Homeostasis is
constantly challenged by internal or external factors leading to the release of compounds such as hormones and growth factors that induce neuroendocrine and
behaviour responses 16.
Stress can be acute, when it occurs in a short period of time, or chronic, when it occurs
repeatedly and/or on a long period of time 17. During the stress response, there is an
increase on cerebral function, vigilance, heart frequency and attention. Additionally, stress-related alterations lead to increased oxygenation and nutrition of the brain, heart and skeletal muscles, crucial organs of the stress response and the ‘fight or flight’
reaction 18. The organism response to an acute stressor is vital for survival. If the stress
response is excessive or prolonged, turning chronic, alterations of physiological events may occur, being harmful for the organism, since vital functions are affected including
6
cardiovascular, immune, gastrointestinal and reproductive function, as well as energy
metabolism, restoration of homeostasis, circadian rhythms and blood pressure 16,17.
Recent studies have been focused on the idea that the chronic activation of biological systems by stress may highly affect cancer progression exerting effects that have impact
on a variety of important hallmarks of cancer and, thus, on patient survival19–21.
1.4. Stress Response
Stress response is associated to the activation of two main systems: the sympatho-adrenomedullary system (SAMS), comprising the sympathetic nervous system (SNS) and the adrenal medulla, and the hypothalamic pituitary adrenal axis (HPA). The main effector of HPA is cortisol, while SNS involves the release of the catecholamines (CA),
adrenaline (AD) and noradrenaline (NA) 22.
Catecholamines synthesis
CA are biogenic amines that have a catechol group with an amino group attached. The precursor of CA synthesis is L-Tyrosine (Tyr), which can be obtained from diet or by the
hydroxylation of phenylalanine in the liver 23,24.
Tyr present in adrenal chromaffin cells or neurons is converted to dihydroxyphenylalanine (DOPA) by tyrosine hydroxylase (TH), a soluble cytoplasmic enzyme, which catalyses the rate-limiting step of CA synthesis. Tetrahydrobiopterin is used by TH as cofactor and molecular oxygen to generate three sub-products: DOPA,
dihydrobiopterin and water 13.
DOPA is then converted into dopamine by a nonspecific enzyme, aromatic L-amino acid decarboxylase, also known as DOPA decarboxylase, which uses pyridoxal phosphate as cofactor. Subsequently, DA is taken up from the cytoplasm into storage vesicles and converted into NA by dopamine-β-hydroxylase. A percentage of this enzyme is released
7
NA is converted into AD by phenylethanolamine-N-methyltransferase (PNMT), a soluble cytoplasmic enzyme that uses S-adenosyl-methionine as cofactor. The main location of this enzyme is the adrenal medulla, but it is also present in sympathetic innervated
organs and some brain areas that are able to synthesize small amounts of AD 13,23,24.
Figure 2. Pathway for CA biosynthesis. In this pathway, TH catalyses the conversion of the amino acid
tyrosine to DOPA. Then, DOPA is converted by DOPA decarboxylase to dopamine. Next, dopamine is converted to NA in chromaffin granule, by DβH. Finally, in the cytoplasm, NA is converted by PNMT to AD. Adapted from Richard Kvetnansky et al, 2009 13. CA – catecholamine; TH - tyrosine hydroxylase; DOPA –
dihydroxyphenylalanine; NA – noradrenaline; DβH - dopamine-β- hydroxylase; PNMT – phenylethanolamine-N-methyltransferase; AD – adrenaline. Adapted from Richard Kvetnansky et al. 200913
The sympatho-adrenomedullary system
The SNS is organized as a central component, the pre-ganglionic neuron located in the spinal cord that communicates with the peripheral component, which is a
post-ganglionic neuron situated in the sympathetic ganglion, through chemical synapses 25.
At synapses within the sympathetic ganglia, pre-ganglionic sympathetic neurons release acetylcholine that binds and activates cholinergic receptors (nicotinic and muscarinic) on post-ganglionic neurons. In response to this stimulus, post-ganglionic neurons
release essentially noradrenaline (NA) but also adrenaline (AD) 25. Prolonged activation
8
bind to adrenergic receptors (AR) on peripheral tissues leading to several effects as pupil
dilation, increased sweating, increased heart rate and increased blood pressure 25.
1.5. Adrenergic receptors
CA act through interaction with two different classes of AR, termed α and β, activating a cascade of reactions that are responsible for all the physiological alterations previously
mentioned 13.
AR family has several members that correspond to nine different gene products, comprised by three types: Type α1 (subtype α1A, α1B, α1C), type α2 (subtype α2A, α2B,
α2C) and type β (subtype β1, β2, β3) 26, 27. Other two AR candidates were recently
described (α1L and β4), that may be conformational states of α1A and β1-AR,
respectively 26.
The AR are composed by seven transmembrane domains and mediate the functional effects of catecholamine by coupling to different signaling pathways modulated by G
proteins 27. G proteins include 3 types, the stimulatory G proteins of adenylyl cyclase
(Gs), inhibitory G proteins of adenylyl cyclase (Gi) and the protein coupling α-receptors
to phospholipase C (Gq) 26.
Adrenergic Drugs
In addition to CA, there are many compounds that interact with AR as agonists and also as antagonists, some of them selective to specific types of receptors, being thus used to
9
Table 1. AR types (α and β) and respective subtypes: α1 (α1A, α1B and α1C), α1 (α2A, α2B and α2C) and
β1, β2 and β3 and correspondent agonists, antagonists and respective pathways activated for the different receptors 28.
α-AR Triggering Pathways
As mentioned, α-AR have 2 subtypes of receptors (α1 and α2) which have different roles.
α1-AR are mainly associated with Gq proteins and their activation triggers both
phospholipase C and mitogen-activated kinases (MAPK) pathways. Phospholipase C
leads to the release of inositol 1,4,5-trisphosphate (IP3) and diacylglicerol (DAG) from
phosphatidilinositol 4,5-bisphosphate (Ptdlns-4,5-P2). IP3 and DAG act as second
messengers. IP3 stimulates the release of calcium from sequestered stores, which in turn
activate several kinases and DAG activates protein kinase C. The MAPK pathway is not yet clarified, but it seems to mediate the production of cell growth factors and citokines 29.
α2-AR are mostly coupled to Gi proteins, which inhibit adenylyl cyclase activity and
consequently decrease intracellular levels of cyclic adenosine monophosphate (cAMP). α2-AR are associated with platelet aggregation, contraction of vascular smooth muscle
Receptor Agonist Antagonist Effects
α1
Common to all Phenilepinephine,
Metthoxamine Prazosin, Carvedilol ↑IP3,DAG
α1A WB4101, prazozin
α1B CEC (irreversible)
α1C WB4101
α2
Common to all Clonidine, BHT920 Rauwolscine,
yohimbine ↑cAMP
α2A Oxymetazolin ↑K+ channels
α2B Prazosin ↓Ca2+
channels
α2C Prazosin ↓Ca2+
channels
β
Common to all Isoprenaline Propranolol, Carvedilol ↑cAMP
β1 Dobutamine Betaxolol, atenolol
β2 Procaterol, terbutaline Butoxamine, ICI 118,551
10
and inhibition of insulin release, and also NA and acetylcholine release when located
pre-synaptically 29.
β-AR Triggering Pathways
The activation of the three subtypes of β-AR is mediated by the stimulatory coupling
protein Gs. β-AR signaling has been found to regulate multiple cellular processes that
contribute to the initiation and progression of cancer. The activation of Gs leads to the
stimulation of adenylyl cyclase that converts ATP into cAMP. This activation modulates both PKA and exchange protein activated by adenylyl cyclase (EPAC) pathways, two major effector systems that are tightly related to inflammation, angiogenesis and tissue
invasion, creating optimal conditions for cancer development 30.
Once activated, PKA phosphorylate several target proteins (transcription factors of the CREB/ATF and GATA families and β-adrenergic receptor kinase (BARK)) with serine or threonine residues. BARK recruit β-arrestin that inhibits β-AR signaling and activates Src kinase, ensuing the activation of factors (STAT-3 and FAK) that modulate cell trafficking and motility via cytoskeletal dynamics and cellular resistance to apoptosis. Another important event is the activation of BAD (Bcl-2 family member) by PKA that can provide
chemoresistance to cancer cells 30.
Once phosphorylated, EPAC activates Ras-like guanine triphosphatase (Rap1A) which induces downstream effects on diverse cellular processes by AP-1 and Ets (via B-Raf/mitogen-activated protein kinase (B-RAF)), MAP/extracellular signal-regulated
kinase (MEK1/2) and ERK1/2) family transcription factors 30.
Overall, transcriptional responses induced by β-adrenergic signaling includes up-regulation of metastasis-associated genes implicated on inflammation, angiogenesis, tissue invasion, and epithelial–mesenchymal transition (EMT), and down-regulation of the expression of genes related to antitumour immune responses generating optimal
11
Figure 3. Main β-adrenergic signalling pathways related to cancer. The stress hormones, AD and NA, bind
to β-ARs, mediating the activation of adenylyl cyclase via G proteins and resulting on cAMP synthesis. cAMP effectors include the activation of both PKA and EPAC. PKA phosphorylates multiple target proteins, including transcription factors of the CREB/ATF and GATA families, as well as β-AR kinase (BARK). BARK recruitment of β-arrestin inhibits β-AR signalling and activates Src kinase, resulting in activation of transcription factors, such as STAT3. In the second via, the activation of EPAC leads to Rap1A-mediated activation of the B-Raf/mitogen-activated protein kinase signalling pathway and downstream effects on diverse cellular processes, including gene transcription mediated by AP-1 and Ets family transcription factors. The general pattern of transcriptional responses induced by β-adrenergic signalling include the up-regulation of expression of metastasis-associated genes involved in inflammation, angiogenesis, tissue invasion, and the down-regulation of expression of genes facilitating antitumour immune responses. Besides the direct effects on β-receptor-bearing tumour cells, β-adrenergic effects on stromal cells in the tumour microenvironment generally synergize with direct effects on tumour cells in promoting cancer survival, growth and metastatic dissemination. AD – adrenaline; NA – noradrenaline; AR – adrenergic receptor; cAMP - cyclic adenosine monophosphate; PKA - Protein kinase A; EPAC - exchange protein activated by adenylyl cyclase; CREB - cAMP response element-binding; STAT3 - Signal transducer and activator of transcripton-3. Adapted from Steven W. Cole and Anil K. Sood, 2011 30.
12
1.6. Stress and cancer
The association between stress and cancer has been described and well-studied over time. The first author purposing an association between stress and cancer was Galen, in 200 AD. Galen observed that women with a “melancholic” temperament were more
vulnerable to have cancer than woman with a more “sanguine” temperament 31.
In the last years many clinical an epidemiological studies where performed in order to
clarify this association. Despite some studies report no association 32, in most of the
cases evidences show that stress increases the incidence of cancer 20,33,34,35.
CA levels are substantially higher in the ovarian tissue than in circulating plasma and
play relevant functional roles in follicular development and steroid production 36. This
suggests that ovarian cancer cells are able to produce CA by themselves 37,38.
β-AR activation in a variety of cancer cell types is linked to different tumourigenic
processes already documented 39, such as angiogenesis 21, cell proliferation 40, apoptosis
13
Figure 4. Stress responses on tumour microenvironment. Stress response results in the activation of ANS
and the HPA causing the release of AD, NA and cortisol, respectively. These mediators are able to modify tumour microenvironment by enhancing cellular proliferation, migration, invasion and angiogenesis contributing to tumour progression. ANS - autonomic nervous system; HPA - hypothalamic-pituitary– adrenal axis; AD – adrenaline; NA – noradrenaline. Adapted from Lutgendorf et al, 2010 17.
1.7. β-blockers and cancer
Several β-blockers are characterized by their selectivity for the β-AR subtypes and
intrinsic sympathomimetic activity 39. Carvedilol (CAR), propranolol (PRO) and atenolol
(ATE), for instance, are β-blockers that have a long history of use for treatment of arrhythmia, hypertension, ischemic heart disease, anxiety, and heart failure treatment, among others. Recently, new therapeutic options for these drugs have been advanced 44.
14
Given the high expression of β-AR in tumour cells, and the tight relationship between stress response and cancer progression, reported in several studies, epidemiological studies have emerged to clarify the association between β-blockers administration and
oncological patients mortality 45,46. The majority of this studies showed that oncological
patients treated with β-blockers presented lower mortality rates comparing to their
counterparts without these drugs 45,46.
The first evidence that isoprenaline (ISO), a synthetic and nor-selective β-AR agonist, promotes a significant increase in the proliferation of lung adenocarcinoma cells arise in
1989 by Schuler and Cole work 47. It was also demonstrated that this effect was inhibited
by propranolol, a β-AR antagonist, commonly used in clinical setting 47. After this study,
other reports have shown that CA (AD, NA and the β-AR synthetic agonist ISO), through activation of AR trigger signaling pathways induce cell proliferation in different types of
cancer such as non-small cell lung carcinoma 48, prostate cancer 43, breast cancer 49 and
colon cancer40.
The main aim of this thesis was to investigate the role of β-ARs on human ovarian adenocarcinoma cell line SKOV-3 proliferation and migration ability. We have studied the effect of AR agonists and antagonists on SKOV-3 cells proliferation and migration ability per se and also the ability of the several AR antagonists to revert SKOV-3 cells proliferation induced by the AR agonists under study.
On the other hand, several reports have presented mixed results for the role of β-AR signalling in cell migration, with evidence that inhibition of this class of receptors either
15
17
2. Materials and Methods
2.1. Materials
Cell culture: DMEM-F12 medium cell culture (Gibco, Portugal); Fetal Bovine Serum (FBS)
(St. Louis, MO, USA); Penicillin, Streptomycin, (St. Louis, MO, USA); trypsin-EDTA (Sigma,
St. Louis, MO, USA).
Assays: Cell Proliferation ELISA BrdU kit (Roche Diagnostics, Portugal); MTT ((3-(4,
5-di-methyl-thiazol-2-yl)-2,5-diphenyl tetrazolium bromide) (Sigma, St. Louis, MO, USA).
Compounds: The adrenergic agonists: AD (Adrenaline - L-Adrenaline (+)-bitartrate salt),
NA (Noradrenaline - L-(−)-Noradrenaline (+)-bitartrate salt monohydrate) and ISO (Isoprenaline - (−)-Isoprenaline (+)-bitartrate salt) were purchased from Sigma (St. Louis, MO, USA). The β-blockers: PRO (Propranolol - DL-Propranolol hydrochloride), ICI (ICI 118,551 -
(±)-1-[2,3-(Dihydro-7-methyl-1H-inden-4-yl)oxy]-3-[(1-ethylethyl)amino]-2-butanol hydrochloride); ATE (Atenolol-(±)-4-[2-Hydroxy-3
[(1methylethyl)amino]propoxy]benzeneacetamide) were purchased from Sigma (St.
Louis, MO, USA) and CAR
(Carvedilol-1-(9H-Carbazol-4-yloxy)-3-((2-(2-methoxyphenoxy)ethyl)amino)-2-propanol) was purchased from Enzo Life Sciences, Inc., (Farmingdale, NY, USA).
Others: Ethanol and DMSO (Invitrogen Corporation, CA, USA.).
2.2. Cell culture procedures
The experimental cellular model used in this thesis, SKOV-3 human ovarian adenocarcinoma cell line, was kindly provided by Professor Marco Cosentino from the University of Insubria, Varese, Italy.
SKOV-3 cells were maintained in DMEM-F12 medium, supplement with 10% FBS, 100 U/mL penicillin and 100µg/mL streptomycin. Cells were maintained at 37ºC in a
18
humidified atmosphere of 5% CO2 and 95% air. Medium was changed each 2-3 days.
After 90% of confluence, corresponding to 3-4 days after seeding, cells were sub-cultured. The covering medium was removed and the monolayer of cells was washed once with 3mL PBS 10x. Next, cells were treated with 1mL of trypsin-EDTA (0.25% (w/v)) for approximately 2 minutes to provide cell detachment and provide subsequent
sub-culturing. Cells were cultured in plastic cell culture flasks (25cm2, TPP).
For experimental studies , SKOV-3 cells were seeded into 96-well plates (0.37 cm2, Ø 6.9 mm, TPP) for MTT and BrdU assays and into 24-well plastic cell culture clusters (2cm2 Ø 16mm; TPP) for the wound healing assay. All the experiments were performed 72 hours after initial seeding.
2.3. Treatments
In order to study the effects of the AR agonists AD, NA and ISO on SKOV-3 cells proliferation and migration, cells were incubated for 24 hours with these drugs at different concentrations (10 µM for migration and 1 µM for proliferation). For the
experiments with the β-blockers, cells were pre-treated with PRO at 10 µM (a
non-selective β-AR), CAR at 5 µM (a non-selective β and selective α1), ATE at 10 µM (a selective β1-AR) and ICI at 10 µM (a selective β2-AR) for 45 minutes prior to treatment with AD, NA or ISO for proliferation and for migration cells were treated with all the β-blockers at 10 µM.
The agonists under study (AD, ISO, NA) were solved in H2O, and the antagonists PRO and
ATE in ethanol (0.1% (v/v)) and CAR and ICI in DMSO (0.1% (v/v)). Each solvent was solved in culture FBS-medium free and positive control was FBS-medium.
The several β-blockers used in this work were selected by their prevalent use in clinical settings, and also for their different affinity for β-AR and ability to modulate specific signalling pathways.
19 2.4. Cell Growth Curves
2.4.1. Trypan blue exclusion assay
Cell viability was determined by Trypan Blue exclusion assay and subsequent experiments were performed only when viability was higher than 90%. In brief, cells were trypsinized and stained with 0.4% Trypan blue. Viable cells were counted with a hemocytometer.
For growth curves, SKOV-3 cells were plated in 96-well plate at 1.0x10⁴ cells/ml and
counted (two squares for each well) every day, during 8 days. The population doubling time (PDT) is the interval, calculated during the logarithmic phase of growth, in which cells double in number. This parameter was calculated by the following formula: DT = T ln2/ ln (Xe / Xs): T is the incubation time; Xb is the cell number at the beginning of the incubation time and Xe is the cell number at the end of the incubation time.
2.4.2. MTT assay
The MTT assay is based on mitochondrial dehydrogenase activity. Mitochondrial dehydrogenases of viable cells cleave the tetrazolium ring, yielding purple formazan crystals, which are insoluble in aqueous solutions. The amount of produced products is determined spectrophotometrically. Initially, SKOV-3 cells were seeded into 96-well
plates at a density of 1×10⁴ cells/well and incubated for 12 hours with DMEM-F12
supplemented with antibiotics 1% plus 10% FBS to allow cell attachment. From this moment, the MTT assay was performed each 24 hours until the growth curve plateau phase. Cells were exposed to MTT solution (5 mg/ml) for 3 hours and then lysed with 200 µl DMSO. Absorbance was measured at 550 and 650 nm. All samples were assayed in quadruplicated and in two independent experiments, and the mean value for each experiments was calculated. The results are given as absorbance.
20
2.5. Determination of EC50 and IC50 values
For determination of the half maximal inhibitory concentration (IC50), the concentration that reduces the effect under study by 50%, and the half maximal effective concentration (EC50) values, the concentration that gives half maximal response, cells
were seeded into 96-well plates at a density of 1×10⁴ cells/well for 72 hours, then
incubated for 12 hours with DMEM-F12 serum free (to synchronize the cell cycle) and then incubated for 24 hours with increasing concentrations of the various compounds (0.1, 1, 5, 10, 20, 50 and 100 µM). The assay was performed according to Juranic et al.,
2005 53. SKOV-3 cells were incubated with MTT solution (5 mg/ml) for 3 hours and then
lysed with 200 µM DMSO. Absorbance was measured at 550 and 650 nm. All samples were assayed in triplicated and at least in three independent experiments, and the mean value for each experiments was calculated. The results are given as mean (± SEM) and expressed as percentage of control.
2.6. Cell proliferation studies
For the treatment of cells with the various adrenergic ligands, 1x10⁴ cells per well were
seeded in 96-well plates and incubated for 72 hours. The medium was supplemented with 1% antibiotics plus 10% FBS. Then, cells were starved in serum-free medium for 12 hours to synchronize cell cycle. After these incubation periods, cells were next incubated with AD, NA or ISO at 1 µM for 24 hours to study the effect of these adrenergic agonists over cellular proliferation. To examine the effects of various β-blockers on proliferation, cells were pre-treated with or without the several adrenergic antagonists, PRO (10µM), CAR (5 µM), ATE (10 µM) and ICI (10 µM) for 45 minutes prior to and also simultaneously with the adrenergic agonists. After the several treatments, cellular proliferation was assessed both by bromodeoxyuridine (BrdU) incorporation and MTT assays.
2.6.1. Incorporation of 5' bromodeoxyuridine (BrdU)
The incorporation of 5’bromodeoxyuridine assay is a method based on the incorporation of BrdU, a thymidine analogue, instead of thymidine into DNA of
21
proliferating cells. After its incorporation into DNA, BrdU is detected by an immunoassay. Given several technical difficulties and to the lack of reproducibility of results with this method, the MTT assay was performed as an alternative method to BrdU.
2.6.2. MTT assay
The protocol used to evaluate the effect of the several drugs under study on cellular proliferation through a MTT assay was similar to what was described in section 2.4.2.
2.7. Cell Migration studies
2.7.1. Wound healing assay
In order to evaluate migration of SKOV-3 cells after exposure to several drugs, a wound healing assay was performed. Initially, cells were plated in 24-well plates and grown till confluence. A sterile tip was used to create a scratch in the cell layer. Wounded monolayers were washed twice with 500 μL of PBS (1x), to remove floating cells, and subsequently treated with the several compounds in serum-free medium. Cells were then treated with 10 μM of AD, NA, ISO, PRO, CAR, ATE and ICI and respective controls.
Images were taken at 0, 6, 24 and 30 hours after treatment to evaluate wound closure. Wound areas were calculated using Image J 1.47v software at different time points. The percentage of wound closure was calculated as the wound area at a given time compared to the initial wound surface.
All treatments were assayed in duplicated and in four independent experiments. Migration was expressed as the average ± SEM of the difference between the initial width of the wound (at time 0) and the width registered after 6, 24 and 30 h
22
2.8. Determination of catecholamine content
CA cellular content were determined by high pressure liquid chromatography with electrochemical detection (HPLC-ED) using the methodology described by
Soares-da-Silva et al 54.
2.8.1. High pressure liquid chromatography with electrochemical detection assay
The HPLC system consists in a pump (Gilson model 302; Gilson Medical Electronics, Villiers le Bel, France) connected to a manometer (Gilson model 802 C) and an ODS 5 μm steel column (Biophase; Bioanalytical Systems, West Lafayette, IN, USA), 25 cm long. The samples were injected by an automatic injector (Gilson model 321), connected to a Gilson diluter (model 401). The mobile phase consisted in a degassed solution of citric
acid (0.1 mM), 1-octanesulfonic acid sodium salt (OSA) (0.5 mM),
ethylenediaminetetraacetic acid (EDTA) (0.17 mM), dibutylamine (1mM), methanol (8% v/v) and was adjusted to pH 3.5 with perchloric acid, being pumped at a rate of 1 ml/min. The CA detection was performed electrochemically with a carbon electrode, an electrode Ag/AgCl and an amperometric detector (Gilson model 141). The detector cell was adjusted to 0.75 V. The originated current was monitored via software Gilson HPLC 172. The lower limits of CA detection varied from 350 to 1000 fmol.
2.9. Statistical analysis
Results are expressed as percentage of control and presented as mean ± SEM. Comparison between treatments was performed using SPSS Statistics software 21 version. For the calculation of EC50 and IC50 values, the parameters of the Hill equation were fitted to the experimental data by using a nonlinear regression analysis. The normality of data distribution and the homogeneity of variances were evaluated by Shapiro-Wilk’s and Levene’s tests, respectively. For proliferation studies one-way analysis of variance (ANOVA) and nonparametric Kruskal-Wallis test were performed
23
followed by Bonferroni’s test. Migration experiments were statistically assessed by factorial repeated measures ANOVA, followed by Bonferroni’s test. A right-tailed logarithmic transformation was performed, when data distribution was not normal. Statistical significance was accepted when p<0.05. All experiments performed in this
25
27
3. Results
The main aim of this study was to clarify the role of the stress hormones, AD and NA, (and of ISO, a synthetic adrenergic agonist) and β-blockers in ovarian cancer cells proliferation and migration by using a human ovarian adenocarcinoma cell line (SKOV-3). Thus, the involvement of β1 and β2-AR in ovarian cancer cells biology was investigated by using selective agonists and antagonists for these receptors.
3.1. SKOV-3 cells growth curves
In order to identify the adequate time point within the exponential growth phase of
SKOV-3 cells to be used in subsequent studies, cells were seeded at 1x10⁴cells/ml in a
96-well plate and their growth curves were determined by trypan blue (Figure 5.A) exclusion and MTT assays (Figure 5.B).
Both assays were performed each 24 hours as represented on figure 5, A and B. The population doubling time (PDT) was approximately 34 hours, and 72 hours of culture the
adequate time point within the exponential growth phase to use in the subsequent experiments.
Figure 5. Growth curves for human ovarian adenocarcinoma SKOV-3 cells. Cells were seeded on a 96-well
plate at 1.0x10⁴ cells/mL and maintained in DMEM-F12 medium supplemented with 10% of FBS and 1%
penicillin/streptomycin. Cell proliferation was assessed by MTT assay each 24 hours for 7 days (A) and by trypan blue exclusion assay (B) each 24 hours for 8 days. Population doubling time is 34 hours. Error bars represent mean of absorbance/cell concentration ± SEM.
G r o w t h p r o file fo r S K O V -3 c e lls 0 1 2 3 4 5 6 7 8 9 1 0 0 .0 0 .3 0 .6 0 .9 1 .2 1 .5 1 .8 D a y s in c u lt u r e A b s o rb a n c e (a t 5 5 0 n m -6 5 0 n m ) G r o w t h p r o file fo r S K O V -3 c e lls 0 1 2 3 4 5 6 7 8 9 1 0 0 1 .01 05 2 .01 05 3 .01 05 4 .01 05 5 .01 05 D a y s in c u lt u r e C o n c e n tr a ti o n (c e ll s / m l) A B
28
3.2. Determination of EC50 and IC50 values
3.2.1. Determination of EC50 values for agonists
In order to determine the EC50 values of AR agonists in this cellular model, SKOV-3 cells were treated in control conditions (without drugs) and with increasing concentrations (0.1, 1, 5, 10, 20, 50 and 100 μM) of AD (Figure 6.A), NA (Figure 6.B) and ISO (Figure 6.C) for 24 hours to determine the effects of these drugs on cellular growth. The above experiments generated concentration-response curves for all agonists. None of the agonists-induced increase of cell proliferation was dependent of concentration (Pearson coefficients 0.281, 0.294 and 0.304 for AD, NA and ISO, respectively). NA significantly increased proliferation at 0.1 to 20 μM. Higher concentrations of the drug (50 and 100 μM) had no effect on SKOV-3 cells proliferation. NA and ISO had a similar effect, increasing proliferation at 0.1 to 50 μM. At 100 μM NA and ISO had no effect on cell proliferation.
Figure 6. Effect of AD (A), NA (B) and ISO (C) on cell growth of SKOV-3 cells assessed by MTT assay after
24 hours of treatment. Results are expressed as mean ± SEM and normalized to 100% of control groups (without drugs). AD – adrenaline; NA – noradrenaline; ISO – isoprenaline.
0 0 .1 1 5 1 0 2 0 5 0 1 0 0 0 5 0 1 0 0 1 5 0 2 0 0 P ro li fe ra ti o n (% o f c o n tr o l) * * * * * C o n c e n t r a t io n (µ M ) A 0 0 .1 1 5 1 0 2 0 5 0 1 0 0 0 5 0 1 0 0 1 5 0 2 0 0 C o n c e n t r a t io n ( u M ) P ro li fe ra ti o n (% o f c o n tr o l) * * * * * * B 0 0 .1 1 5 1 0 2 0 5 0 1 0 0 0 5 0 1 0 0 1 5 0 2 0 0 C o n c e n t r a t io n ( u M ) P ro li fe ra ti o n (% o f c o n tr o l) * * * * * * C
29 3.2.2. Determination of IC50 values for β-blockers
In order to calculate the IC50 values for the effect of β-blockers on cellular proliferation, cells were treated under control conditions (without drugs) and with increasing concentrations of either PRO, CAR, ATE or ICI (0.1, 1, 5, 10, 20, 50 and 100 μM) for 24 hours. The concentration-response curves of SKOV-3 cells proliferation are shown in Figure 7 and IC50 values in Table 3. The concentration-response curves of cell proliferation are shown in Figure 7 and IC50 values in Table 3. The IC50 value for ATE was 10.15 μM, 16.88 μM for CAR and for ICI 118,551 the IC50 value was 13.10 μM. PRO
was proved to be the most potent β-blocker with an IC50 of 7.92μM.
Figure 7. Concentration-response curves for SKOV-3 cell proliferation. Cells were treated with increasing
concentrations (0, 0.1, 1, 5, 10, 20, 50 and 100 μM) of PRO (A), ATE (B), CAR (C) and ICI (D) for 24 hours and proliferation was assessed by MTT assay. Results are expressed as percentage of control and presented as mean ± SEM. *p<0.05 comparing to control. PRO – propranolol; ATE – atenolol; CAR - carvedilol; ICI - ICI 118,551
0 0 .1 1 5 1 0 2 0 5 0 1 0 0 0 5 0 1 0 0 1 5 0 * * C o n c e n tr a t io n (µ M ) P ro li fe ra ti o n (% o f c o n tr o l) * I C 5 0 = 7 . 9 2 µ M * A 0 0 .1 1 5 1 0 2 0 5 0 1 0 0 0 5 0 1 0 0 1 5 0 C o n c e n tr a t io n (µ M ) P ro li fe ra ti o n (% o f c o n tr o l) * * * I C 5 0 = 1 0 . 1 5 µ M B 0 0 .1 1 5 1 0 2 0 5 0 1 0 0 0 5 0 1 0 0 1 5 0 C o n c e n tr a t io n (µ M ) P ro li fe ra ti o n (% o f c o n tr o l) * * * * * * I C 5 0 = 1 6 . 8 8 µ M C 0 0 .1 1 5 1 0 2 0 5 0 1 0 0 0 5 0 1 0 0 1 5 0 C o n c e n tr a t io n (µ M ) P ro li fe ra ti o n (% o f c o n tr o l) * * * I C 5 0 = 1 3 . 1 0 µ M D
30
3.3. Effect of β-blockers on SKOV-3 cells proliferation
To clarify the role of β-AR upon SKOV-3 cell proliferation induced by AR activation, the agonists AD, NA and ISO at 1 μM were employed alone and simultaneously with PRO (10 μM), a non-selective β-AR antagonist, ATE (10 μM) to elucidate the role of β1-AR, CAR (5 μM), a potent non-selective β and selective α1-AR antagonist, or ICI (10 μM), a β2-AR selective antagonist. The effect of β-blockers per se was also evaluated. The concentrations used for β-blockers were selected based on the IC50 values, previously calculated.
3.3.1. Effect of agonists and antagonists per se on cell proliferation
The effects of agonists and antagonists per se on cell proliferation are represented on figure 8, A and B respectively. AD at 1 µM significantly increased cell proliferation to 131 ± 10 % (n=12, p=0.036) and ISO at 1 µM showed a tendency to increase cell proliferation to 144 ± 16 % (n=12, p=0.051), whereas NA had no effect. In respect to AR antagonists, only CAR at 5 μM was able to significantly decrease cell proliferation to 77 ± 6 % (n=12, p=0.013).
Table 2. IC50 values for β-blockers on SKOV-3 cells proliferation.
Cell type β-Blockers IC50 (µM) 95% n
SKOV-3
Atenolol 10.15 2.778-13.333 12
Propranolol 7.92 4.196-13.84 12
Carvedilol 16.88 4.391-39.14 9
ICI118,551 13.10 5.694-16.96 9
31 3.3.2. β-blockers influence on adrenaline effect
The role of β-AR in cell proliferation is supported by the next results. Figure 9 shows the effect of the four β-blockers under study on SKOV-3 cells proliferation induced by AD (1 μM). The increase of proliferation induced by AD was markedly reduced by PRO at 10 μM to 42 ± 5 % (n=12, p<0.001), to 63 ± 8 % (n=12, p=0.004) by ATE at 10 μM and to 63 ± 7 % (n=12, p=0.004) by ICI (10µM). CAR at 5 μM had no effect on cell proliferation (n=12, p=0.105).
Figure 8. Effect of agonists AD, NA and ISO at 1 µM (A) and antagonists PRO, ATE and ICI at 10 µM and CAR
at 5 µM (B) on SKOV-3 cells proliferation. Cells were treated with each drug for 24 hours and cell proliferation was measured by MTT assay, as described in the Materials and Methods section. Agonists control group was H2O (100 µM), PRO and ATE control group was ethanol (100 µM), CAR and ICI control
group was ethanol (100 µM). AD – adrenaline; NA – noradrenaline; ISO – isoprenaline; PRO – propranolol; ATE – atenolol; ICI – ICI118,551; CAR – carvedilol. Results are expressed as percentage of control and presented as mean ± SEM. *p<0.05 comparing to control group. #p=0.051
0 5 0 1 0 0 1 5 0 2 0 0 C e ll P ro li fe ra ti o n (% o f c o n tr o l) C o n t r o l A D N A IS O * # A 0 5 0 1 0 0 1 5 0 2 0 0 C e ll P ro li fe ra ti o n (% o f c o n tr o l) P R O A T E IC I C A R * B
32 0 5 0 1 0 0 1 5 0 C e ll P ro li fe ra ti o n (% o f c o n tr o l) C on t r ol ( A D) P RO + AD C AR + AD A TE + AD ICI + A D * * * * * * *
3.3.3. β-blockers influence on noradrenaline effect
The effect of the four β-blockers under study on SKOV-3 cells proliferation induced by NA (1 μM) is shown on figure 10. As it shows, cell proliferation increase induced by NA was markedly reduced by all the β-blockers under study. PRO at 10 μM was able to decrease cell proliferation induced by NA to 61 ± 7 % (n=12, p<0.001), CAR at 5 μM to 65 ± 6 % (n=12, p<0.001), ATE at 10 μM to 62 ± 6 % (n=12, p<0.001) and ICI at 10 µM to 39 ± 5 % (n=12, p<0.001).
Figure 9. Effect of PRO (10 μM), CAR (5 μM), ATE (10 μM) and ICI (10 μM) on AD (1 μM) induced SKOV-3
cell proliferation. Cells were pre-treated with the different β-blockers for 45 minutes before incubation simultaneously with AD for 24 hours. Cell proliferation was measured by MTT assay, as described in the Materials and Methods section. **p <0.01, significantly different from the AD-treated group *** p<0.001, significantly different from the AD treated group. AD – adrenaline; PRO – propranolol; ATE – atenolol; ICI – ICI 118,551; CAR – carvedilol. Results are expressed as percentage of control and presented as mean ± SEM.
33 0 5 0 1 0 0 1 5 0 C e ll P ro li fe ra ti o n (% o f th e C o n tr o l) C on t rol ( N A) P RO + NA C AR + NA A TE + NA ICI + N A * * * * * * * * * * * *
3.3.4. β-blockers influence on isoprenaline effect
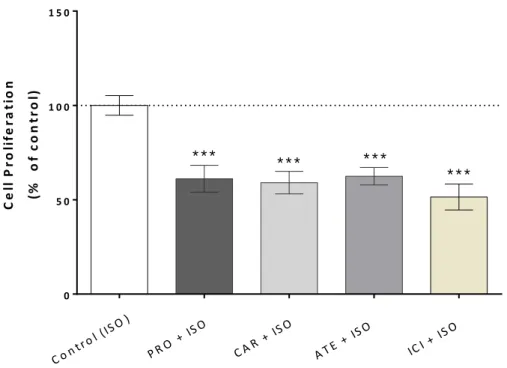
The effect of the β-blockers on SKOV-3 cells proliferation induced by ISO 1 μM can be seen on figure 11. Cell proliferation increase induced by ISO was highly reduced by all the β-blockers under study. PRO at 10 μM significantly decreased cell proliferation to 61 ± 7 % (n=12, p<0.001), CAR at 5 μM to 59 ± 6 % (n=12, p<0.001), ATE at 10 μM to 62 ± 5 % (n=12, p<0.001) and ICI (10µM) to 51 ± 7 % (n=12, p<0.001).
Figure 10. Effect of PRO (10 μM), CAR (5 μM), ATE (10 μM) and ICI (10 μM) on NA (1 μM) induced
SKOV-3 cell proliferation. Cells were pre-treated with the different β-blockers for 45 minutes before incubation simultaneously with NA for 24 hours. Cell proliferation was measured by MTT assay, as described in the Materials and Methods section. ***p <0.001, significantly different from the NA treated group. NA – noradrenaline; PRO – propranolol; ATE – atenolol; ICI – ICI118,551; CAR – carvedilol. Results are expressed as percentage of control and presented as mean ± SEM.
34 0 5 0 1 0 0 1 5 0 C e ll P ro li fe ra ti o n (% o f c o n tr o l) C on t r ol ( IS O) P RO + IS O C AR + IS O A TE + ISO ICI + ISO * * * * * * * * * * * *
In our study, with the exception of CAR, all the β-blockers tested were able to revert the proliferative effect of the adrenergic agonists under study. These results approve the hypothesis that the activation of both β1-AR and β2-AR have a crucial role on the activation of SKOV-3 cells proliferation pathways.
Figure 11. Effect of PRO (10 μM), CAR (5 μM), ATE (10 μM) and ICI (10 μM) on SKOV-3 cell proliferation
induced by ISO 1 μM. Cells were pre-treated with the different β-blockers for 45 minutes before incubation simultaneously with ISO for 24 hours. Cell proliferation was measured by MTT assay, as described in the Materials and Methods section. ***p <0.0001, significantly different from the ISO-treated group. ISO – isoprenaline; PRO – propranolol; ATE – atenolol; ICI – ICI 118,551; CAR – carvedilol. Results are expressed as percentage of control and presented as mean ± SEM.
35 3.1. Effect of chronic treatment (24 hours) with adrenergic agonists and β-
blockers on SKOV-3 cells Migration
To evaluate the impact of adrenergic agonists and β-blockers on SKOV-3 cells migration a wound healing assay was performed. On figures 12 and 13 are representative panels of each treatment for each different considered time point.
Figure 12. Migratory ability of SKOV-3 cells after exposure to adrenergic agonists, evaluated by a wound
healing assay. A scratch was made with a sterile tip in a confluent layer of cells. Then cells were treated with AD, NA and ISO at 10 µM and a control group. Wound closure was observed at 6, 24 and 30 hours after treatment (n=8).The yellow line corresponds to perimeter immediately after treatment. Scale bar corresponds to 400 µm. AD – adrenaline; NA – noradrenaline; ISO – isoprenaline.
Control H2O AD 10 µM NA 10 µM ISO 10 µM
36
6 Hours 24 Hours 30 Hours
Control DMSO CAR 10 µM ICI 10 µM Control Ethanol ATE 10 µM PRO 10 µM
Figure 13. Migratory ability of SKOV-3 cells after exposure to β-blockers, evaluated by a wound healing
assay. A scratch was made with a sterile tip in a confluent layer of cells. Then cells were treated with CAR, ICI, ATE and PRO at 10 µM and the respective control groups. Wound closure was observed after 6, 24 and 30 hours after treatment (n=6-8). The yellow line corresponds to perimeter immediately after treatment. Scale bar corresponds to 400 µm. CAR – carvedilol; ICI – ICI 118,551; ATE – atenolol; PRO - propranolol.
37
As we can observe in figure 14 none of the tested drugs had a significant effect upon SKOV-3 cell migration. On table 4 the wound closure (%) is represented at different time points (6, 24 and 30 hours) comparing to 0 hours after treatment.
Figure 14. Migratory ability of SKOV-3 cells, evaluated by a wound healing assay. A scratch was made
with a sterile tip in a confluent layer of cells and wound closure was observed after 6, 24 and 30 hours after treatment with agonists at 10 µM and respective control (A) ICI and CAR at 10 µM and respective control (B) and ATE and PRO at 10 µM and respective control group with (n=4-8).Results are expressed as percentage of control and presented as mean ± SEM. Differences were not statistically significant. AD – adrenaline; NA – noradrenaline; ISO – isoprenaline CAR – carvedilol; ICI – ICI 118,551; ATE – atenolol; PRO - propranolol. 6 2 4 3 0 0 1 0 2 0 3 0 4 0 5 0 T im e ( h o u r s ) W o u n d c lo u s u re ( % ) C o n t r o l A D N A IS O 6 2 4 3 0 0 1 0 2 0 3 0 4 0 5 0 T im e ( h o u r s ) W o u n d c lo u s u re ( % ) C o n t r o l C A R 5 IC I 1 0 6 2 4 3 0 0 1 0 2 0 3 0 4 0 5 0 T im e ( h o u r s ) W o u n d c lo u s u re ( % ) C o n t r o l P R O 1 0 A T E 1 0 A B C
38
3.2. Determination of catecholamine content by high pressure liquid chromatography with electrochemical detection
In order to study whether or not SKOV-3 cells are able to produce CA, a preliminary assay was made by high pressure liquid chromatography with electrochemical detection (HPLC-ED). After 4 days in culture, SKOV-3 cells were incubated overnight with percloric acid (0.2 M) and afterwards CA content was assessed by HPLC-ED. As we can see in Table 5, SKOV-3 are able to produce NA but not AD or DA. Results are expressed as peak height.
Cell type L-DOPA AD DA NA
SKOV-3 - - - 1308
(n=2)
39