Promoting the understanding of graph representations by grade 3
students
Isabel Velez1 and João Pedro da Ponte1, 1
Instituto de Educação da Universidade de Lisboa, Portugal; velez@campus.ul.pt
This paper aims to understand how two grade 3 teachers promote students’ learning of graph representations. The conceptual framework addresses representations and teachers’ actions as students work on a task involving graph comprehension. Data collection includes observation and video recording of two classes. The results show that to promote the understanding of the graph representation teachers supported students in reading the data and in reading between the data, mostly by questioning. Keywords: Teachers’ practices, Graph representations, Graph comprehension. INTRODUCTION
Representations are a key element on students’ learning. Several authors have been studying the role of representations in mathematics learning (Bruner, 1999; Thomas, Mulligan & Goldin, 2002). The NCTM (2000) indicates that representations help students to interpret, organize and understand the information given in a problem statement, to figure out how to reach the answer, and to monitor and evaluate their work. Therefore, it is important that teachers provide students with opportunities to learn and understand different types of representations (Bishop & Goffree, 1986). Research regarding interpreting and using graphs has been receiving more attention. According to Friel, Curcio and Bright (2001) graphs are “used for data analysis function as discovery tools at the early stages of data analysis when the student is expected to make sense of data” (p. 132). They also refer that this side of the use of graphs in the classroom is related to the school curriculum. In 2012 Portuguese teachers were starting to use a new school curriculum (Ministério da Educação, 2007), that emphasized for the first time, the importance of working statistics from the early ages. In this paper, we aim to understand how two grade 3 teachers promote students’ learning of graph representations.
REPRESENTATIONS AND TEACHERS’ PRACTICE
A representation is a mental or physical construct that describes aspects of the structure of a concept, and its interrelationships with other concepts (Tripathi, 2008). Bishop and Goffree (1986) say that, to foster students’ understanding of representations, the role of teachers is to facilitate “the interpretation of the many representations commonly used [and] encourage the connections to be exposed, so that pupils can share that knowledge” (pp. 335-336). Stylianou (2010) refers the importance of understanding more than one representation related to the same concept and states that teachers may select those which they regard as more appropriate to promote their students’ understanding. When students explain their
solutions this provides the teacher with the opportunity to understand students’ answers and to know how they interpret a representation. As students work or present their representations, teachers may ask them to explain such representations, thus supporting the establishment of connections between representations and making conversions and treatments (Duval, 2006).
Statistical graphs are an important kind of representation. Goldin (2000) says that graphs may promote new learning, providing students opportunities to build their own knowledge and to participate in discussions. According to Friel, Curcio and Bright (2001) although all graphs have a similar framework, each type of graph has its own specifications and its own language. When a student reads a graph he or she must be able to describe, organize, represent, analyse, and interpret data, and relate it to its context. They state that “graph instruction within a context of data analysis may promote a high level of graph comprehension that includes flexible, fluid and generalizable understand of graphs and their use” (p. 133). The authors also refer that students’ difficulties in reading and understanding graphs are associated (i) to establishing connections between data, (ii) to the graph with known situations, and (iii) to the task, students, and class characteristics. To map students’ understanding of graph representation, Curcio (1987) proposed a framework with three levels of graph comprehension: (i) reading the data, responding to simple questions that just require direct readings; (ii) reading between the data, finding relationships in the data and making simple inferences; and (iii) reading beyond the data, answering questions based on extensions, inferences or predictions based on the interpretation of the data. Friel, Curcio and Bright (2001) suggest that, when students work on a task, teachers may question them, in order to promote the different levels of graph comprehension. Teachers’ practices strongly influence students’ learning, and in particular the way they use mathematical representations in the classroom (Stylianou, 2010). Saxe (1999) states that practices may be regarded as recurrent and socially organized everyday life activities. An important aspect of teachers’ practice is how they use tasks in the classroom (Ponte & Chapman, 2006). Often this is done through three moments: introduction of the task (which can be made by teacher or by actively involving the students), students’ work (individually or in small groups) and whole class discussion and systematization of representations results (Ponte, 2005).
Regarding whole class discussions, Ponte, Mata-Pereira and Quaresma (2013), identify four types of teachers’ actions (inviting, challenging, supporting or guiding and informing or suggesting). They give special attention to challenging actions by which teachers support students in discovering new information. Based on this perspective, we analyse the students’ work on a task and we connect their activity and teachers’ actions, focusing on how teachers promote the understanding of representations (Table 1).
Students’ activity may involve designing a representation, using and transforming a representation or reflecting about used representations. Teachers’ actions are closely
related to students’ activity. To support the students’ in designing a representation teachers may (i) promote the students’ free choice about an adequate representation, (ii) give students some hints about a representation, or (iii) give a suggestion or example that students should use. To promote the use/transformation of a given representation, the teacher may (i) challenge students using open questions to promote students’ thinking about transforming their representations, (ii) ask students to explain their solutions in a structured way, or (iii) suggest students an alternative to their representations. In the reflection phase teachers can guide or challenge students to (i) establish connections between the used representations or others that could be used as well and (ii) do conversions and treatments of representations. The difference between guiding and challenging depends on the questions that teachers make (in a more open or structured way). Teachers can also involve students into (i) evaluating the work that has been done and (ii) systematizing information.
Students’ activity
regarding representations Teachers’ actions
Designing/Choosing
Promoting free choice Hinting through questioning
Providing explicit suggestions or examples
Using/Transforming
Challenge students through open questioning Asking to explain in a structured way
Suggesting alternatives
Reflecting Guiding or challenging to establish further connections Guiding or challenging to find conversions or treatments
Promoting the evaluation of the work done Promoting systematizations
Table 1: Teachers’ actions regarding students’ representations. RESEARCH METHODOLOGY
This study is part of a qualitative research on the practices of a working group of four primary school teachers that in 2013 were in a school cluster in the surroundings of Lisbon, all teaching grade 3. The teachers of this working group were striving to promote problem solving with graph representations in their classes. The participants in this paper are two of those teachers, Rui and Catarina. We choose them because in their classes we observed episodes illustrative of a wide variety of interesting situations. Both teachers had less than 5 years of experience and already knew the students in their classes from the previous school year.
Data was gathered by video recording during class observations (whole class moments and individual teacher-student interactions). The first author collected the data and was a non-participant observer in the classes. Data was analysed trough
content analysis regarding the different moments of classroom work on a task (Ponte, 2005), teachers’ actions concerning the understanding of representations (Table 1), and the different levels of students’ graph comprehension (Curcio, 1987). After transcribing all the audio and video data, we analysed teachers’ and students’ interactions and coded their actions with the categories of Table 1 and the levels of Curcio (1987). In this paper, we analyse the work carried out on a task on two different classes. The task was planned by the teachers’ working group. At the beginning of the research, the teachers identified some topics that they wanted to teach (from January to June of 2013) and the first author suggested them some tasks. As the students had done some previous work with pictograms and graphs, the teachers chose a task involving a bar graph striving to address students’ needs and difficulties in reading the data and reading between the data.
RESULTS
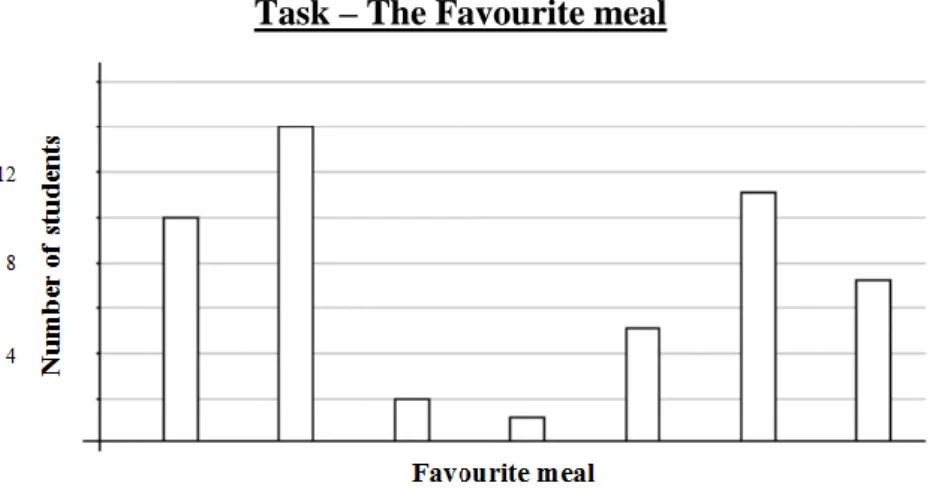
The task “The favourite meal” included a bar graph and a set of seven statements. Two questions (with sub questions) were made regarding the information provided in the graph and in the statements.
Task – The Favourite meal
The schools’ principal wants to know which students’ favourite meal is. He received a report that included a graph and several conclusions:
a) The hamburger and fries were the most voted meal;
b) The number of students who chose the hamburger and fries were the double of those who chose roasted chicken; c) The fish and chips had less 4 votes than hamburger and fries;
d) The spaghetti Bolognese was the second most voted meal; e) The creamy codfish had 4 more votes than the baked fish; f) 5 students voted on creamy codfish;
g) Some students voted in peas with eggs.
1) The principal received this little report with the graph but he was not pleased with it. He found the conclusions very confusing. After all, how many students voted? And how many voted for each meal?
2) Examine the graph that was done. What could be improved? What is well done?
Figure 1: Task presented to students (based in Martins & Ponte, 2010).
Interpreting statements a), d), f) and g) involve reading the data and interpreting statements b), c), e) involve reading between the data. As the information is already represented in a graph, the students do not have to design or choose representations –
they are called upon to use, transform and reflect on given representations and on their own work.
Catarina’s class
In the presentation of the task, Catarina begins by addressing the graph conventions (title, categories, vertical axis, horizontal axis) with her students, questioning them and providing some hints (“Why are graphs necessary?... What is the meaning of the numbers in the graph?...”). By doing this, she helps students in reading the data. During the students’ autonomous work, depending on their difficulties, Catarina walks around the room and asks students to explain their answers through open questioning or in a more structured way, seeking to understand their work. For example, regarding statement a), through open questioning, she challenges Jorge, a student who apparently does not have difficulty in solving the task, about his answer (he answers that the hamburger and fries matches to the second column). However, she is not sure how he read the data and continues questioning him about how many students chose this meal:
Jorge: Well… If this is twelve [points to the number twelve on the vertical axis], this should be thirteen…! Right?
That way Catarina could notice that although Jorge’s written answer is correct, and his initial explanation seemed right, he does not have a proper understanding of the graph, assuming that the scale was of one element. The teacher continues to question him in a more structured way (“Let’s look closer to the number of students…”, “Where is the number zero?”, “Let’s complete the scale [in the vertical axis]”…). In this way, she leads the student to recall the graph conventions, focusing him in how to read the data, and guiding him to take a closer look at the graph scale on the vertical axis. Finally, Jorge discovers for himself his mistake.
In the whole class discussion, Catarina asks the students to present their solutions. She calls upon students according to their difficulties in reading the data and in reading between the data, especially reading the vertical axis scale and comparing graph bars that she had noticed in students’ work. For example, Catarina had realized that António justified his answer to statement e) using just part of the information provided (if one column is greater than another one and if codfish has more votes than baked fish, codfish will be one column and baked fish another one). This prompts her ask him to present his solution to the class:
António [as he points to the fifth column]: [This is] the codfish… Catarina: Why?
António: Because it has more than this one [he points to the third column]. Catarina: Hum… How many [votes]?
Catarina: But the codfish has plus four votes than the baked fish . . . How many votes does this has? [she points to the column chosen by the student]
António: Two…
Catarina: You have two votes...? So two plus four ... How much is it? Antonio: Six...
Catarina: Do you have any [column] with six? . . . António: No... Just five...!!
With this sequence of structured questions Catarina leads the student to read between the data, and António realizes that his answer was wrong. Afterwards, she continues to question him, focusing in how to read the data, and reviewing some elements of the graph representation that are necessary to solve the task, such as analysing the value of the remaining columns (reading the data) and comparing the with the scale of the graph.
In the discussion of the second question of the task, Catarina focuses in how to read the data, guiding students in reviewing the conventions of graphs. She uses open questioning, challenging students to find what they could improve (“What’s missing?”). Some students say that “the graph is incomplete” and identify the two missing elements. Vanessa points to the missing categories on the horizontal axis (“It does not say the name of each meal (…) Here!”) and another student refers to the missing title of the graph. At this point Catarina decides to challenge students, testing them about the size of the columns with a “bad example”. On the black board, she erases some of the original columns and enlarges their width. As the students respond negatively to what she did, the teacher asks them: “Why are you reacting like that?! Why can’t I do it like this?” The students’ answers (“Because it would seem like a super meal”, “It is occupying too much space!”, “They must have the same width!”) show that they know that all columns must have the same width. In the end the whole class discussion, Catarina systematizes with the students the information discussed and writes it on the board.
Rui’s class
During the presentation of the task Rui provides some examples of how to read the data and questions students in a structured way. The teacher talks with them about graph conventions (role of horizontal and vertical axis) and states that it is important to understand what the axes represent (“This graph has . . . It has two axes... This axis here [points to the vertical axis] is the number of students that voted, right? And that [points to the horizontal axis], indicates the favourite meal”).
During the students’ autonomous work, most of them show great difficulty in understanding the graph representation and in reading the data. They have trouble in identifying the scale on the vertical axis and in relating the data on the graph to the sentences. As Rui realizes those difficulties, he decides to solve the task in a whole
class discussion, asking students to explain their answers in a structured way. This decision motivates the class, prompting the students to reflect on the task and to participate in the discussion. Some of them start to read between the data. For example, on statement a), Bernardo justifies his answer saying that if the hamburger and fries is the most voted meal, then the corresponding bar would be the higher one (“The first [statement] indicates that the most voted meal was the hamburger and fries... So [the bar] that is the uppermost is this [meal]).
At this point, Rui invites all students to participate in the discussion and to present their solutions, and he challenges them through open questioning. For example, in statement b) he inquires a group of students that are talking about their solution:
Rui: Double of roasted chicken… What does it means? Explain me that!
Ulysses: The number of students who chose hamburger and fries was twice... Of those who chose roasted chicken... . . .
Rui: . . . So what can I take from this? . . . How am I going to do that? Carolina: We have to go to the other [column of hamburger and fries]... André: We have to see the numbers in this table [graph]!
Rui: We have to see the number in the graph, how?
André: Well... We have to see what number is [in each column]... We have to [compare columns and] see if [which] is twice of the roasted chicken . . .
Carlos: It’s [the column] standing next to the hamburger with fries! Rui: Come here to explain me how do you see that...
Carlos [as he goes to the black board]: I am telling you that... This [the second column] is the hamburger with fries and [the roasted chicken] is this [the first] one... Because…This [the first column] is eight and eight is the half of the double [the column that values fourteen]...
Rui begins by challenging students to read between the data and interpret the statement, namely the meaning of “double”. Through open questioning (“Explain me that!”, “How?”, “What does it mean?...”) he realizes that there were two strategies for dealing with statement b): comparing column size, such as Carolina suggests, or comparing column values, as André indicates. Prompted by Rui, André explains his answer.
Almost at the same time, Carlos insists that the first column is the right answer and Rui decides to question him in a structured way. For Carlos it is clear that he has to find the column which value is half of the hamburger and fries column (“half of the double”) and he knows that half of fourteen is seven. However, as he could not find the column that corresponds to seven meals (because the number seven it is not identified on the vertical axis), he tries to compare column sizes and chooses the one that he thinks it is closer to seven. That way, he chooses the first column that he
thinks it worth eight meals. Rui notices that Carlos is having difficulties in reading the data, and he promotes a comparison between the two strategies trying to make everyone understand why only one of them is reliable. Using Carlos as a representative of the users of the first strategy, Rui challenges him to explain how he can be sure that the value of the column that he chose is half of the column corresponding to the hamburger and fries. The student tries to read between the data, not acknowledging that he is not able to read the data. As the vertical axis does not have all the numbers identified, Carlos tries to compare the size of the columns, measuring them with his hands. Rui continues to challenge him through open questioning and asks Carlos and his classmates (“Do you think that column [first column] is half of the one of hamburger and fries?”). With this question, all the students begin talking at the same time, trying to pick the right column.
As Catarina did, Rui also realizes that the class is struggling to read the data (namely the vertical axis scale). He decides to explore the graph with his students making questions in a structured way. He points to the intersection between the two axes (“Which number is this one?”) and that guides students to look at the scale of the vertical axis and to read the data. Leonardo, says “Oh! It’s two by two!” and Miguel completes the answer of his colleague saying “It is two, four, six, eight, ten and twelve!” which makes the whole class understand the scale and therefore the graph representation. As a consequence, Rui decides that students can return to work autonomously. As the work goes on, the teacher analyses students’ solutions and questions some of them through open questioning and structured questioning. Afterwards, during the whole class discussion of results, the students have no difficulties in explaining their answers.
In the second part of the task, Rui challenges the students through open questioning and they easily indicate what could be improved in the graph. For example, Bernardo states that the given scale (that he considers incomplete) made the graph very difficult to read (“Because it had not all the numbers!”) and André indicates that the graph should have a title (“The title!! It is missing the graph title!”).
After the whole class discussion, Rui systematizes with the students the relevant information related with reading the data and reading between the data (title, scale, y-axis and x-axis, categories, size of columns) and he promotes the evaluation of the work done as well as what students have learned.
CONCLUSION
Teachers’ actions as the students seek to use and transform the information provided on the graph and the statements mainly involved open questioning and questioning in a structured way to lead students to explain their answers. They also questioned students in a structured way to discuss the graph conventions and rules in order to lead them to understand the main characteristics of that representation.
As the students identified the relevant graph conventions they could read the data. This also allowed them to read between the data (Curcio, 1987). When the students were having trouble in reading between the data, the teachers decreased their questioning level in terms of graph comprehension (Friel, Curcio & Bright, 2001), and sought to make sure that students could read the data by questioning them in a structured way about the graph conventions. When the students were able to read the data, the teachers increased the questioning level and challenged them through open questions. Rui and Catarina had to decide how and when to intervene, and how and when to increase or decrease their questioning level, helping students to understand the graph representation without jeopardizing the activity on the task, making it too easy or too hard.
During the discussion phase the teachers tended to guide and challenge students. Both of them systematized the most important information at the end of the discussion. As Bishop and Goffree (1986) suggest, the teachers chose students with right and wrong answers depending on what they wanted to explore. For example, Rui picked a situation when a student had a different solution from everyone else. In conclusion, to help students to read the data teachers tended to question in a structured way and to help students to read between the data teachers tended to use open questioning. Both teachers used the whole group discussion in which students presented their solutions as an important learning moment in which they challenged and guided the students to explain their solutions, so that all of them could understand their colleagues’ solutions. As the teachers recognized the students’ answers, it was easier to help them to identify and correct their mistakes. The teachers used mostly open questioning and questioning in a structured way during the introduction, the students’ autonomous work and whole class discussion, with very little resource to suggesting alternatives. The results that we present in this paper supports idea that the teachers’ choice of tasks and handling classroom communication are crucial aspects of their practice (Ponte & Chapman, 2006), providing the required opportunities to develop students’ mathematical learning. ACKNOWLEDGEMENT
This study is supported by FCT – Fundação para a Ciência e Tecnologia through the Project Developing Statistical Literacy (PTDC/CPECED/117933/2010) and also a grant to Isabel Velez (SFRH/BD/97033/2013).
REFERENCES
Bishop, A., & Goffree, F. (1986). Classroom organization and dynamics. In B. Christiansen, A. G. Howson & M. Otte (Eds.). Perspectives on mathematics
education (pp. 309-365). Dordrecht: D. Reidel.
Bruner, J. (1999). Para uma teoria da educação. Lisboa: Relógio d’Água.
Curcio, F. R. (1987). Comprehension of mathematical relationships expressed in graphs. Journal for Research in Mathematics Education, 18, 382–393.
Duval, R. (2006). A cognitive analysis of problems of comprehension in the learning of mathematics. Educational Studies in Mathematics, 61, 103–131.
Friel, S. N., Curcio, F.R. & Bright, G.W. (2001). Making sense of graphs: critical factors influencing comprehension and instructional implications. Journal for
Research in Mathematics Education, 32(2),124–158.
Goldin, G. A. (2000). Representational systems, learning, and problem solving in mathematics. Journal of Mathematical Behavior, 17(2), 137–165.
Ministério da Educação (2007). Programa de Matemática do ensino básico. Lisboa: DGIDC.
National Council of Teachers of Mathematics (2000). Principles and standards for
school mathematics. Reston, VA: Author.
Ponte, J. P. (2005). Gestão curricular em Matemática. In GTI (Ed.). O professor e o
desenvolvimento curricular (pp. 11-34). Lisboa: APM.
Ponte, J. P., & Chapman, O. (2006). Mathematics teachers' knowledge and practices. In A. Gutierrez & P. Boero (Eds.). Handbook of research on the psychology of
mathematics education: Past, present and future (pp. 461–494). Roterdham:
Sense.
Ponte, J. P., Mata-Pereira, J., & Henriques, A. (2012). O raciocínio matemático nos alunos do ensino básico e do ensino superior. Praxis Educativa, 7(2), 355-377. Ponte; J. P., Mata-Pereira, J., & Quaresma, M. (2013). Ações do professor na
condução de discussões matemáticas. Quadrante, 22(2), 55-82.
Saxe, G. B. (1999). Professional development, classroom practices, and students' mathematics learning: A cultural perspective. In Proceedings of 23rd International Conference for the Psychology of Mathematics Education, 3, 121-128, Haifa, Israel.
Stylianou, D. A. (2010). Teachers’ conceptions of representation in middle school mathematics. Journal of Mathematics Teacher Education, 13, 325-343.
Thomas, N. D., Mulligan, J. T., & Goldin, G. A. (2002). Children’s representation and structural development of the counting sequence 1–100. Journal of
Mathematical Behavior, 21(1), 117-133.
Tripathi, P. N. (2008). Developing mathematical understanding through multiple representations. Mathematics Teaching in the Middle School, 13(8), 438-445.