Life (Dis)satisfaction and the Decision to Migrate:
Evidence from Central and Eastern Europe
Vladimir Otrachshenko
yOlga Popova
zAbstract
This paper provides empirical evidence of the impact of life satisfaction on the in-dividual intention to migrate. The impacts of inin-dividual characteristics and of country macroeconomic variables on the intention to migrate are analyzed jointly. Di¤erently from other studies, we allow for life satisfaction to serve as a mediator between macro-economic variables and the intention to migrate. Using the Eurobarometer Survey for 27 Central Eastern European (CEE) and Western European (non-CEE) countries, we …nd that people have a higher intention to migrate when dissatis…ed with life. The socio-economic variables and macroeconomic conditions have an e¤ect on the intention to migrate indirectly through life satisfaction. The impact of life satisfaction on the intention to migrate for middle-aged individuals with past experience of migration, low level of education, and with a low or average income from urban areas is higher in CEE countries than in non-CEE countries.
Keywords: life satisfaction, migration, decision making JEL Classi…cation: I31, J61
This research was supported by the ERSTE Foundation Generations in Dialogue Fellowship for Social Researchers. We thank Alena Biµcáková, David Blanch‡ower, Andrew Clark, Maria A. Cunha e Sá, Ira Gang, Jan Kmenta, Rainer Münz, Luis Catela Nunes, Andreas Ortmann, Andrew Oswald, Alexandre Sidorenko (in alphabetic order), ERSTE Foundation Fellows, and participants at 8th De-mographic and Ageing Forum (St. Gallen), IV Joint IOS/APB Summer Academy on Central and Eastern Europe: Recent Challenges in Migration Research, Economic and Broader Development Is-sues (Tutzing), IZA Workshop on Sources of Welfare and Well-Being (Bonn), VII Summer School on International Migration: Challenges and Opportunities for the EU and Its Neighborhood (Florence), International Conference Market and Happiness: Do Economic Interactions Crowd Out Civic Virtues and Human Capabilities? (Milan), Synergizing Political Economy Research in Central and Eastern Europe Workshop (Budapest), Quantitative Economics Doctorate Jamboree (Lisbon) for valuable comments and helpful suggestions. All expressed opinions and remaining errors are those of the authors.
yNova School of Business and Economics, Lisbon, Portugal. E-mail: [email protected]. Address:
Nova School of Business and Economics, Nova University of Lisbon, Campus de Campolide, 1099-032 Lisbon, Portugal.
zInstitute for East and Southeast European Studies (IOS), Regensburg, Germany, and Center
for Economic Research and Graduate Education, Charles University, and the Economics Institute of the Academy of Sciences of the Czech Republic (CERGE-EI), Prague, Czech Republic. E-mail: [email protected]. Address: IOS Regensburg, Landshuter Str. 4, 93047 Regensburg, Ger-many.
1
Introduction
The factors driving the individual decision to migrate such as job and educational op-portunities, expected income, relative deprivation, a better provision of social bene…ts and public goods, etc., have been widely explored in the literature.1 However, non-pecuniary aspects also play a role in migration decisions (see Stark [54]). For instance, during con‡ict periods such as wars, terrorist attacks, and other regional instabilities, higher migration ‡ows are observed regardless of any pecuniary aspects.2 Also, the quality of institutions such as civil liberties, political rights, protection of property rights, corruption, and the level of institutionalized democracies (e.g., dictatorship) cause migration ‡ows even when monetary bene…ts are su¢ ciently high in the country of origin.3 As a result, these non-pecuniary aspects as well as tastes and culture, hidden reasons and motives such as a feeling of deserving a better life, and a feeling of fairness, a¤ect the decision to migrate but may not be observed by a researcher. In this case a life satisfaction measure may be used as a proxy for both pecuniary and non-pecuniary aspects.4 In fact, many surveys include questions regarding life satisfaction, where in-dividuals evaluate the overall quality of their own life, providing the information that can be used for those purposes.
In the literature, only a few studies have investigated the relationship between life satisfaction and individual decisions and activities. Examples of such studies are An-tecol & Cobb-Clark [4], Clark [17], Freeman [30], among others, who use job satisfaction as a predictor of future job quits. Lyubomirsky et al. [45] suggest that satis…ed with life people are likely to be more successful and socially active, while Frey & Stutzer [32] argue that people who are satis…ed with life are more likely to decide to get married. Guven et al. [37] examine the e¤ect of the gap in happiness between spouses on the probability to divorce. Besides the potential bene…t of using the life satisfaction
mea-1See Berger & Blomquist [5], Borjas[15], De Jong et al. [19], Dustmann [26], Gibson & McKenzie
[33], Greenwood [35], Kennan & Walker [41], Stark [55], Stark & Bloom [56], Stark & Taylor [57], Stark & Wang [58], Tiebout [60], among others.
2See Bohra-Mishra & Massey [13], Dreher et al. [25], Morrison [47], Sirkeci [52], among others.
3See Bertocchi & Strozzi [6] and [7], among others.
sure in the analysis, the major cost is potential endogeneity. For instance, in a recent paper, Guven [36], using the instrumental variable approach to overcome endogeneity, claims that people who are satis…ed with life spend less and save more.
Our paper contributes to the existing literature on migration and life satisfaction, and opens the discussion about the ability of using subjective indicators to capture di¤erent factors a¤ecting the migration decision. Using the Eurobarometer survey for 27 Central Eastern (CEE) and Western European (non-CEE) countries in the period of 2008, we examine the impact of life satisfaction on the individual intention to migrate (hereafter, migration decision).5
In our analysis, we distinguish three types of leaves: internal, temporary inter-national, and permanent international leaves (hereafter, permanent and temporary migrations). Of particular interest is the impact of life satisfaction on individual per-manent and temporary migration decisions. In order to explain the perper-manent and temporary migrations, we combine individual and country level variables that may a¤ect the migration decision. Individual variables are represented by socio-economic characteristics such as age, income, education, and past experience of migration, while country level variables are unemployment, GDP per capita, inequality, and the quality of governance. Country level variables and socio-economic characteristics are allowed to a¤ect the individual migration decision not only directly but also through life sat-isfaction. That is, di¤erently from other studies, in this paper, life satisfaction plays the role of a mediator between country-wide economic and political conditions and the individual intention to migrate. The impacts of individual characteristics and of country macroeconomic variables on the decision to migrate are analyzed jointly.
The empirical …ndings indicate that people have a higher intention to migrate when dissatis…ed with life. The results hold for all types of leaves: internal, temporary in-ternational, and permanent international. The socio-economic variables and
macro-5Central and Eastern European countries in our sample are Bulgaria, the Czech Republic, Estonia,
Hungary, Latvia, Lithuania, Poland, Romania, Slovakia and Slovenia. Western European countries are Austria, Belgium, Cyprus (Republic), Denmark, Finland, France, Germany, Greece, Ireland, Italy, Luxembourg, Malta, Netherlands, Portugal, Spain, Sweden, and the United Kingdom.
economic conditions have an e¤ect on the intention to migrate indirectly through life satisfaction. We also …nd di¤erences in migration decisions between the CEE and Western Europe. The impact of life satisfaction on the intention to migrate for middle-aged individuals with past experience of migration, low level of education, and with a low or average income from urban areas is higher in CEE countries than in non-CEE countries. The empirical …ndings of this paper shed some light on how migration ‡ows vary for di¤erent groups of individuals in those regions.
The rest of the paper is organized as follows. The next section brie‡y reviews the relevant literature. Then we present the empirical framework and robustness check, describe data, and discuss estimation results. The …nal section concludes.
2
Literature Review
The relationship between migration and life satisfaction has not yet been thoroughly examined in the economic literature. Existing studies at the individual level focus mostly on the life satisfaction of actual migrants and of their next generations. For instance, De Jong, Chamratrithirong, & Tran [20] study the life satisfaction of mi-grants in Thailand and argue that life satisfaction typically decreases after moving to a di¤erent place, while Easterlin & Zimmerman [29] argue that migrants from Eastern to Western Germany are relatively less satis…ed than the locals living in the Western part. Sa… [50] also suggests that immigrants in Europe and their generations are less satis…ed than the natives.
At the country level, Blanch‡ower, Saleheen, & Shadforth [9] and Blanch‡ower & Shadforth [10] analyze the migration ‡ows from Central and Eastern Europe. The authors …nd that the higher number of immigrants in the UK is from those CEE countries that have a lower GDP per capita and a lower average life satisfaction. Such pattern invites us to attempt to disentangle the e¤ects of country level variables and life satisfaction on the migration decision in CEE and non-CEE countries.
re-ceived substantial attention. Most studies in this stream of literature argue that job dissatisfaction is a strong predictor of job quit intentions as well as actual quits (see Antecol & Cobb-Clark [4], Bockerman & Ilmakunnas [11], Clark [17], Freeman [30], Shields & Ward [51], Stevens [59], among others).
In a seminal study, Freeman [30] argues that the importance of satisfaction data for studying labor mobility is underestimated in the economic literature. The author suggests using individual satisfaction to evaluate the indirect e¤ects of observed vari-ables as well as a proxy for unobserved objective factors. For instance, job satisfaction may serve as an indicator of workplace quality. In line with this suggestion, Clark [17] points out that di¤erent job satisfaction domains, for instance, satisfaction with career opportunities, relations with supervisors, use of initiative, re‡ect unobservable job quality characteristics that can be used to measure the probability of job quits. Using data from BHPS, the author …nds that dissatisfaction with payment, working hours, the type of work, job security, and the use of initiative are signi…cant predictors of future actual job quits. Bockerman & Ilmakunnas [11] analyze Finnish data and argue that job dissatisfaction as a proxy for adverse working conditions induces quit intentions and actual job quits. The topic of job satisfaction and quits in di¤erent con-texts is further explored by Antecol & Cobb-Clark [4] for military personnel, by Shields & Ward [51] for nurses, and by Stevens [59] for academics. All these studies underline the role of dissatisfaction in labor mobility and provide a rationale for studying the implications of dissatisfaction and migration intention.
In our paper, we examine the individual intention to migrate, not the actual mi-gration decision. The psychological theories of reasoned action and planned behavior suggest that the individual intention predicts the actual decision and behavior.6 As the predictions of these theories suggest, the better incorporation of individual (e.g., information, abilities, and emotions) and external (e.g., opportunity costs and external barriers for performing a behavior) factors into the model of hypothetical decisions
re-6See Ajzen & Fishbein [3] for an extensive review of the psychological literature on intentions and
actual behavior; see Rabinovich & Webley [48] for the psychological factors a¤ecting the realization of intentions into actual behavior.
duces the gap between intended and actual behaviors (see Ajzen & Fishbein [2], Ajzen [1], and Hale & Householder [38]). Recently, in the context of a Prisoner’s Dilemma game, Vlaev [61] argues that real and hypothetical decisions are di¤erent. However, a common critique to such …ndings is that they cannot be generalized to the whole population due to the use of students in the experiments. Also, the actual data may be too costly or rarely available to the researcher.
Data on individual intentions rather than actual labor mobility are also used in some economic studies (see Antecol & Cobb-Clark [4], Kristensen & Westergerd-Nielsen [42], Shields & Ward [51], among others). In the context of migration, empirical evidence in favor of a strong link between the intended and actual decision is provided by Gordon & Molho [34] and Boheim & Taylor [12]. Gordon & Molho [34] conclude that in the UK, a high share of people who intend to migrate actually moves within …ve years. Furthermore, Boheim & Taylor [12] argue that the actual probability to move for potential migrants is three times higher than for those who do not intend to move. Therefore, the analysis of the individual intention to migrate is important for understanding the actual migration decision-making process.
3
Methodology
3.1
The Model
In this section we present the theoretical framework of the individual intention to migrate. An individual i is faced with a choice between the following alternatives: stay in the home country (1), move to another country permanently (2), move to another country temporarily (3), and move within home country (4). Following Dolan & Kahneman [24], we consider life satisfaction as a proxy to experienced utility. Using the additive random utility model for multiple alternatives as described by Cameron & Trivedi [16], the individual utility associated with the kthalternative can be represented
as follows:
Uik = Vik(xi; c) + "ik; k = 1; :::; 4 (1a)
Vik(xi; c) = x0i k+ c0 k; (1b)
where Uik represents the experienced utility of an individual i in a destination k. k represents four alternatives to migrate. Vik(xi; c) represents the deterministic compo-nent of utility. In this study Vik(xi; c) is measured by the life satisfaction score. "ik is the random component of utility that stands for individual unobserved characteristics. xi are individual i characteristics such as income, level of education, employment and marital statuses, past experience of migration, age, and gender. c represents country characteristics, which may include the level of GDP, unemployment, income inequality.
k and k are the parameters of the model.
The individual decision to migrate is based on choosing the alternative with the highest utility. Even though there may be mental and material costs of the intention to migrate, without loss of generality, these costs are assumed to be zero.7
An individual i decides to migrate from the home country to the destination k if the utility after moving to the destination is higher than the one from staying in the home country and from all other destinations, Uik > Uih;all k 6= h: The alternative h of staying in the home country is used as the reference alternative. Thus, the probability to migrate to the destination k is expressed as follows:
Pr[M igrDecisioni = k] = Pr[Uik > Uih; all k 6= h] = (2) = Pr[Vik(xi; c) + "ik > Vih(xi; c) + "ih; all k 6= h] =
= Pr["ih "ik 6 Vik(xi; c) Vih(xi; c); all k 6= h]
The errors "ik are assumed to be i.i.d. type 1 extreme value, with density function f ("ik) = e "ikexp( e "ik); k = 1; ::; 4: (3)
7In a seminal study Sjaastad [53] distinguishes between monetary and non-monetary costs of
mi-gration. However, we do not have this information in our data.
Given equations (2) and (3), we result in a multinomial logit model Pr[M igrDecisioni = k] =
eVik
eVi1 + eVi2 + eVi3 + eVi4: (4) Given equation (1b), the probability of the decision to migrate from the home country to the destination k depends negatively on the utility of living in the home country.8 Since life satisfaction in the destination is not available, Vik(xi; c), without loss of generality, we assume that it is constant for each destination.9 This assumption can be relaxed in future research.
In our empirical speci…cation, we follow a two-level regression analysis. This type of analysis allows us to relate and structure the characteristics of individuals and countries in one framework.10 As can be observed from Figure 1 in the appendix, there are two levels, namely, between (country) and within (individual) levels. At the between level in the rectangle, country political and economic variables such as GDP per capita, unemployment, inequality and others are included. At the within level, individual variables appear in the rectangles such as individual socio-economic characteristics and the variable that represents the individual intention to migrate. The dashed-dotted arrow from life satisfaction to the intention to migrate hypothesizes the causal e¤ect. Even though the variable of interest is the intention to migrate, not the actual decision, there may be the potential endogeneity issue related to simultaneity. This issue is discussed in the next section.
The econometric model can be expressed as follows: equations (5a) and (5b1-5b3) are attributed to the within level, while equations (6a1-6a2) and (6b1-6b3) represent the between level.
8Alternatively, the di¤erence V
ik(xi; c) Vih(xi; c) has to a¤ect the individual decision to migrate
positively.
9One way to relax this assumption is to use the average life satisfaction in the country of destination.
However, the individuals in our sample point out several destinations.
10Alternatively, a two-level hierarchical model with random intercepts can be estimated as described
by Raudenbush & Bryk [49]. However, due to the identi…cation issue of the model, we estimate it sequentially. The results of both approaches are similar with only a di¤erence in the e¢ ciency of estimators.
Pr(M igrDecisioni = k) = F ( 0k+ 1kLif eSat2i+ 2kLif eSat3i+ (5a) + 3kLif eSat4i+ 4kEcondi+ kxi+ k; s+ "ik)
Lif eSatJi = 0j + jxi+ j; s+ ij; j = 2; 3; 4 (5b1-5b3) k; s= 0k+ 1kPolitics+ 2kEconomics+ 3kCEE + uk (6a1-6a2)
j; s= 0j + 1jPolitics+ 2jEconomics+ 3jCEE + j; (6b1-6b3)
where the subscript i stands for individual. The variable M igrDecisioni represents an individual decision to participate in the kth alternative to leave, k = 2; 3; 4; that is permanent international (k=2), temporary international (k=3), and internal leaves (k=4). The intention to stay in the home country (k=1) is used as the reference alternative. Lif eSat is an individual’s self-reported satisfaction with life in the home country; Econdi is a dummy variable, which is equal to one if the decision to migrate is driven by economic factors such as higher expected income, better working and housing conditions and zero if the factors are non-economic, for instance, moving closer to family or friends, or expecting a better local environment, among others. Even though some individuals answered that they do not have the intention to migrate, they also provided the possible reason.11 xi includes individual socio-economic characteristics, namely, age, gender, marital status, children, income, level of education, employment status, living in an urban area, and past migration experience. k; s and j; s are country …xed e¤ects that account for the average country-speci…c life satisfaction and the propensity to migrate. Politics and Economics are the sets of country-level political and economic variables such as GDP per capita, the unemployment rate, and the Gini coe¢ cient. Also, we introduce a dummy variable, CEE, that is equal to one if home country is in Central and Eastern Europe and zero otherwise. These variables correspond to c in the theoretical model. k and j are mean country-speci…c intercepts, while "ik; ik; uk and j are stochastic disturbances.
11The exact question is "Regardless of whether you might move to another country or not, which
of the following might encourage you to move to another country?"
The responses to life satisfaction questions are categorically ordered and take values from one to four in a Likert scale. To evaluate the e¤ects of each level of life satis-faction on individual migration decision separately, we separate Lif eSati into four dummy variables and use the lowest level of life satisfaction as a base category in our estimations.
Lif eSatJi = 1; if Lif eSati = j and 0 otherwise, j = 1; :::; 4
The reliability of subjective data is of potential concern. However, as summarized by Frey & Stutzer [31] from the economic, sociological, and psychological literature, life satisfaction data are valid, consistent and reliable measures of individual well-being. That is, people are able to evaluate own quality of life without systematic errors. Moreover, life satisfaction is relatively stable over time.12
To analyze the determinants of the individual migration decision, the within level equations (5a) and (5b1-5b3) are estimated by using the maximum likelihood estima-tion (MLE). By estimating equaestima-tion (5a) using a multinomial logit model, we examine the direct impact of life satisfaction and individual socio-economic characteristics on the probability to migrate abroad permanently, temporarily, or within a country against the reference category of no leave. To analyze the determinants of life satisfaction at each level, the equations (5b1-5b3) are estimated by logit.
The estimates of country dummy variables from equation (5a) are taken as depen-dent variables for equations (6a1-6a2). These estimates represent the country …xed e¤ects. We assume that country level political and economic variables a¤ect the deci-sion to migrate abroad permanently and temporarily and have no e¤ect on the decideci-sion to migrate internally. The decision to migrate internally is likely to be a¤ected by re-gional level political and economic variables that are di¢ cult to incorporate. Therefore, the mean country-speci…c intercept of the permanent migration decision and the tem-porary migration decision are included into the between level, while the intercept of
12See psychological and economic studies on the set point theory of life satisfasction (Clark et al.
internal migration is not.
The values for the dependent variables of equations (6b1-6b3) are the estimates of country dummies from equations (5b1-5b3). The dependent variables of these equations represent the average value of being satis…ed in a particular country at the satisfaction levels 2, 3, and 4, respectively. The equations (6a1-6a2) and (6b1-6b3) are estimated by ordinary least squares and allow us to analyze the e¤ects of country level political and economic variables directly on the permanent migration decision and on life satisfaction. Since equations (5a), (5b1-5b3) at within (the individual level) and (6a1-6a2), (6b1-6b3) at between (the macro level) levels are estimated sequentially, we bootstrap the standard errors and cluster them at the country level.
3.2
Robustness Check
The econometric model presented above may be subject to several potential caveats. First, even though the use of data on the individuals who intend to migrate instead of those who actually migrate helps to circumvent a positive selection bias, the simultane-ity bias in the estimates of the e¤ect of life satisfaction on the decision to migrate is still a potential concern. Some unobserved individual characteristics such as restlessness, perfectionism, or ambition, may make people both dissatis…ed with life and be prone to migration. However, these concerns of a potential simultaneity bias are common for all cross-sectional studies on satisfaction and quitting behavior, for instance, Antecol & Cobb-Clark [4] and Bockerman & Ilmakunnas [11], among others.
Second, the small number of individuals for each type of migration in our sample may produce non-robust estimation results, both at individual and country levels. Finally, there may be the cross-country di¤erences in the life satisfaction measure.
In order to respond to these potential concerns, we rede…ne the intention to mi-grate into a binary variable, which is equal to one if an individual intends to mimi-grate permanently, temporarily, or internally, and zero otherwise. Thus, those who intend to migrate are treated in the estimation together regardless of the type of potential
tion. To address the simultaneity issue, equations related to the intention to migrate and to four levels of life satisfaction are estimated simultaneously by using a multivari-ate probit.In addition, we estimmultivari-ate a SUR model with the intention to migrmultivari-ate and life satisfaction equations, where life satisfaction is treated as a continuous variable. In both models, the correlation of residuals between any level of life satisfaction and the intention to migrate is not statistically signi…cant.13 These results suggest that there is no endogeneity problem.
Since the life satisfaction variable is categorically ordered and measured in a Likert scale, this variable can be represented as follows:
Lif eSati = 8 > > > > > > > < > > > > > > > : 4 if 3 < Lif eSati 3 if 2 < Lif eSati < 3 2 if 1 < Lif eSati < 2 1 if Lif eSati < 1 (7)
where j represents the threshold of switching from category j 1 to category j, for j = 1; 4, and Lif eSati represents the corresponding unobserved life satisfaction.
In order to obtain the unobserved life satisfaction of individuals, we follow the latent variable approach described by Bollen [14]. The latent variable, Lif eSat ; is not observed but is inferred from the responses to the question regarding life satisfaction, according to the following measurement equation:
Lif eSati = xi+ s+ i (8)
where Lif eSati is a continuous latent life satisfaction variable, xi are observed indi-vidual socio-economic characteristics, s are country …xed e¤ects, and is a factor loading. i is a measurement error that follows a logistic distribution.
The continuous representation of life satisfaction allows us to take into account the cross-country di¤erences in life satisfaction. Also, it helps to avoid the equi-distance problem. That is, the di¤erence between 1 and 2 in a Likert scale in life satisfaction may
not have the same impact on the intention to migrate as the di¤erence between 3 and 4. Then, we introduce the unobserved continuous life satisfaction into the migration equation as follows:
P r(M igrDecisioni = 1) = F ( 0+ 1Lif eSati + 2Econdi+ xi+ CD + "i) (9)
where "i is the stochastic disturbance and follows a logistic distribution. The other coe¢ cients and explanatory variables are interpreted in the same manner as in the previous section. Then, equations from (7) to (9) are estimated simultaneously using the robust maximum likelihood. After estimating the individual level, we proceed to the country level estimation. This estimation is similar to the one described in previous section.
4
Data
The primary data source for examining the model described above is the Eurobarom-eter survey in 2008. This is a cross-sectional survey based on nationally representative samples that include randomly selected respondents from 27 European countries, out of which 10 are Central and Eastern European countries.14 There are about 1000 respon-dents per country. The survey contains questions on individual values and attitudes towards life, previous migration experience, the intentions to migrate in the future, and individual socio-economic characteristics. Since the survey has no questions on respondent’s income, we use a proxy for income, namely, the judgement regarding the …nancial situation of the respondent’s household. The question that we use is "How would you judge the …nancial situation of your household? Very good (4), rather good (3), rather bad (2), very bad (1)."
The question on life satisfaction that we use is "On the whole, are you very satis…ed (4), fairly satis…ed (3), not very satis…ed (2) or not at all satis…ed (1) with the life you
14The list of countries in our sample is Austria, Belgium, Bulgaria, Cyprus (Republic), the Czech
Republic, Denmark, Estonia, Finland, France, Germany, Greece, Hungary, Ireland, Italy, Latvia, Lithuania, Luxembourg, Malta, the Netherlands, Poland, Portugal, Romania, Slovakia, Slovenia, Spain, Sweden, and the United Kingdom.
lead? ". The mean life satisfaction scores for two waves of the Eurobarometer survey are presented in Table 1 in the appendix. As observed, there are two columns that correspond to waves of April-May 2008 and October-November 2008. In our study, we use only the wave of October-November 2008, since this is the only wave that contains information on both life satisfaction and migration. The highest mean life satisfaction in our sample is in Denmark, while the lowest is in Bulgaria. People from Central and Eastern Europe report lower levels of life satisfaction than people from Western European countries. This ranking is consistent with the similar ones from other databases, e.g. World Values Survey. One may be concerned that the period used for the analysis coincides with the economic crisis. However, as observed from Table 1, there are no major changes in the average life satisfaction before and during the crisis. Moreover, small changes in the average life satisfaction observed in some countries can be attributed to psychological aspects of individuals such as the fear of losing a job.
Survey questions about intended migration used in this research are presented in Figure 2 in the appendix. The following three questions are used to construct the variable of interest M igrDecisioni, namely "Do you intend to move in the next …ve years? "; "Do you intend to move within country or to another country? "; and "How long do you expect to stay abroad? " As mentioned above, we distinguish three types of leaves: permanent international, temporary international, and internal. If an individual responds that he/she intends to move in the next …ve years within country, we consider such a response as the intention to migrate internally. If an individual responds that he/she intends to move in the next …ve years to another country for a few weeks, few months, few years, or for more than a few years but not inde…nitely, we consider such a response as the intention to migrate abroad temporarily. Finally, if an individual responds that he/she intends to move in the next …ve years to another country for the rest of his/her life, we consider such a response as the intention to migrate abroad permanently.
presented in Table 2 in the appendix. The number of intended migrants for all types of leaves is about 10 percent of our sample. Thus, for some countries, we may have only a few intended migrants. However, this should not change the main conclusions of our paper.
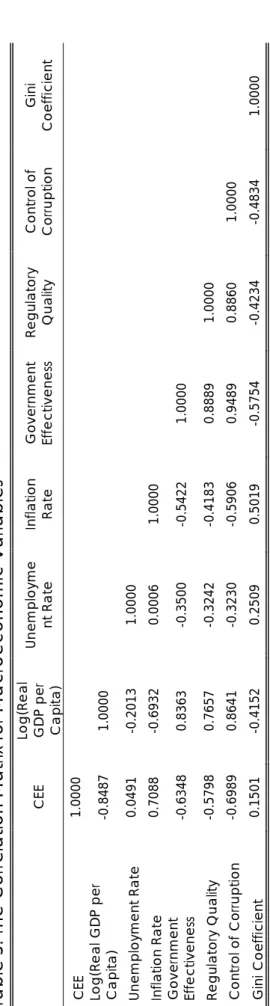
The country level data, namely, the real GDP per capita, unemployment rates, and Gini coe¢ cients are obtained from the Eurostat database. We also use the Worldwide Governance Indicators (see Kaufmann, Kraay, & Mastruzzi [40]). The correlation matrix for the macroeconomic variables is presented in Table 3.
5
Results and Discussion
5.1
Individual Level E¤ects
In this section we present and discuss the results for the decisions to migrate perma-nently, temporarily, and internally. To understand the migration decision at each level of life satisfaction, life satisfaction in our estimation is represented by three dummy variables, where the default group corresponds to individuals that indicate the lowest level of life satisfaction.
Individual level estimation results for the decision to migrate and life satisfaction are obtained by estimating equations (5a) and (5b1-5b3) and presented in Tables 4 and 5 in the appendix, respectively. In Table 4, the columns correspond to the partic-ular intention to migrate, namely permanent, temporary, and internal. As observed, di¤erent levels of life satisfaction have strong negative impact on each type of the in-tention to migrate. This means that individuals with higher levels of life satisfaction have a lower intention to migrate. We also …nd that di¤erent levels of life satisfaction are jointly statistically signi…cant for all types of migration intentions (for instance, in the equation for the intention to migrate permanently, the Lagrange multiplier test (LM)=41.11***).15 Also, the impact of being at satisfaction level 2, "not very satis-…ed", is di¤erent from the impacts of satisfaction levels 3, "fairly satissatis-…ed", and 4, "very
15***, **, * stand for 1, 5, and 10 percent signi…cance levels, respectively.
satis…ed" (in the equation for the intention to migrate permanently, LM=32.48*** and LM=12.58***, respectively). These results suggest that it is important to consider life satisfaction at di¤erent levels.
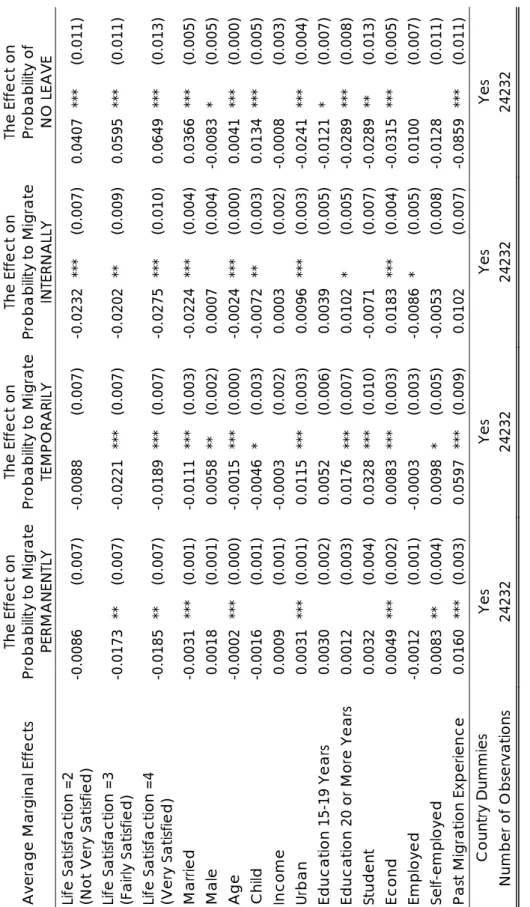
In Table 4, we also observe that older, married, with a child, without past experience of migration, and employed individuals have a lower intention to migrate, while the self-employed, from an urban area, and those for whom the decision to migrate is driven by economic factors have a higher intention to migrate.
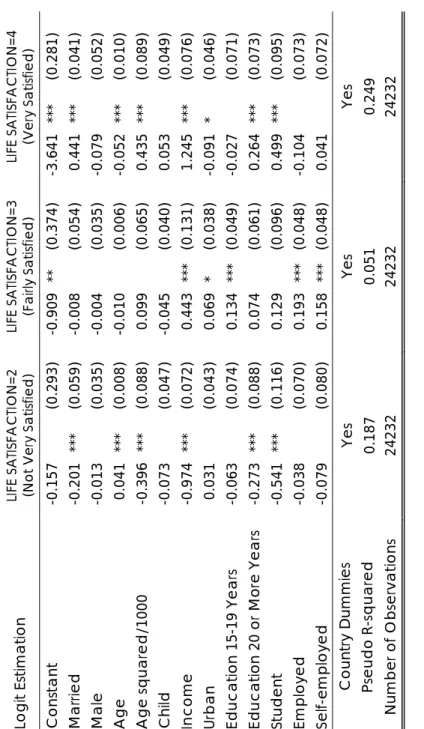
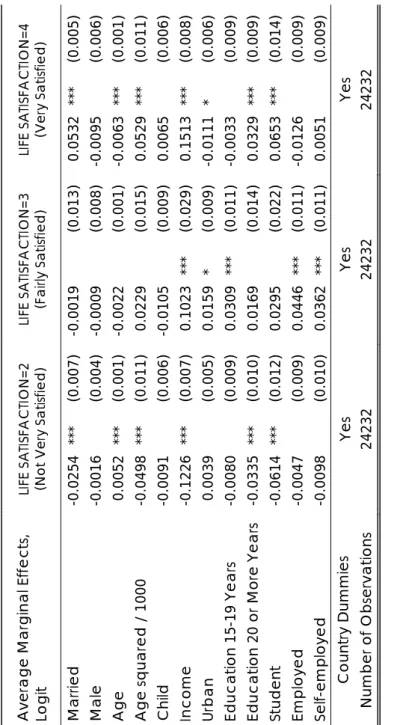
In Table 5, the results for the within level (individual) for each level of life satis-faction are presented. Life satissatis-faction is higher for married, with higher income and education, and employed or self-employed individuals and is U-shaped in age (see col-umn "very satis…ed"). These results support the …ndings from the existing happiness literature. The e¤ects of all variables in Table 5 represent mediating relationships with the intentions to migrate. Interestingly enough, even though in our sample we do not …nd the e¤ect of income on migration intentions (see Table 4), this e¤ect is mediated by life satisfaction (see Table 5).16 Thus, empirical …ndings suggest that even though the direct e¤ect may not be observed, the relationship may be established through life satisfaction.
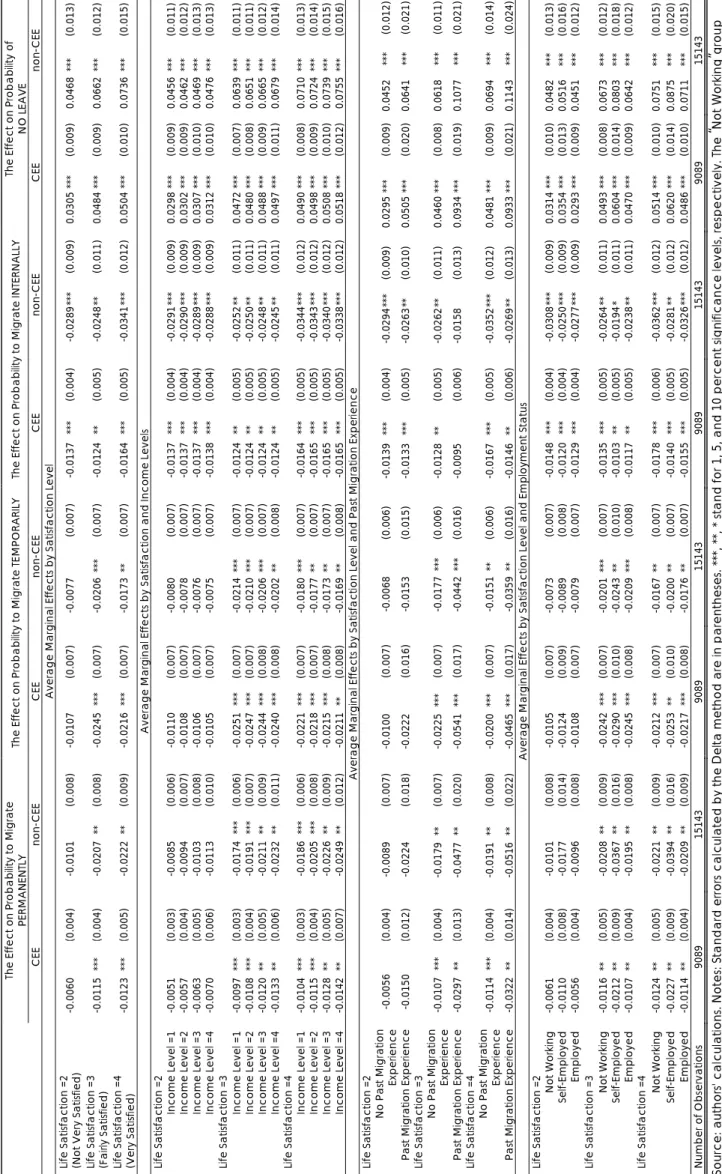
Since our dependent variable, the intention to migrate, is nominal, we have com-puted the average marginal e¤ects for the explanatory variables from equation (5a).17 These e¤ects are presented in Table 6A. As observed from this table, an increase in life satisfaction may lead to the increase in the probability to stay in the country of residence. In particular, as compared to individuals with satisfaction level 1, "not at all satis…ed", individuals with satisfaction level 3, "fairly satis…ed", and 4, "very satis-…ed", are more likely to stay by 5.95% and 6.49%, respectively. The average marginal e¤ects of life satisfaction on the intention to migrate for di¤erent groups of individuals are discussed in details in Section 5.3. However, since the countries in our sample have di¤erent levels of economic development, there may be important cross-country factors
16We also estimated equation (5a) without the life satisfaction variable, but we do not …nd evidence
that income a¤ects the intention to migrate either.
that may a¤ect the individual decision to migrate. This issue is explored in the next section.
5.2
Country Level E¤ects
The migration literature has emphasized the in‡uence of economic and political con-ditions on the individual migration decision.18 In this paper, we also examine the relationship between the intention to migrate permanently and temporarily and vari-ous country characteristics. Di¤erently from other studies, we use life satisfaction as a mediator between the macroeconomic variables and the intention to migrate. Due to high correlations between macroeconomic variables, we select only the logarithm of real GDP per capita, the unemployment rate, and the Gini coe¢ cient as explanatory variables for equations (6a1-6a2) and (6b1-6b3) (see Table 3).
We are also interested in analyzing the country level di¤erences in migration in-tentions between CEE and non-CEE countries. However, as can be observed from Table 3, there is a strong negative correlation between the logarithm of real GDP per capita and a dummy for CEE countries. Thus, we use these variables in di¤erent model speci…cations.
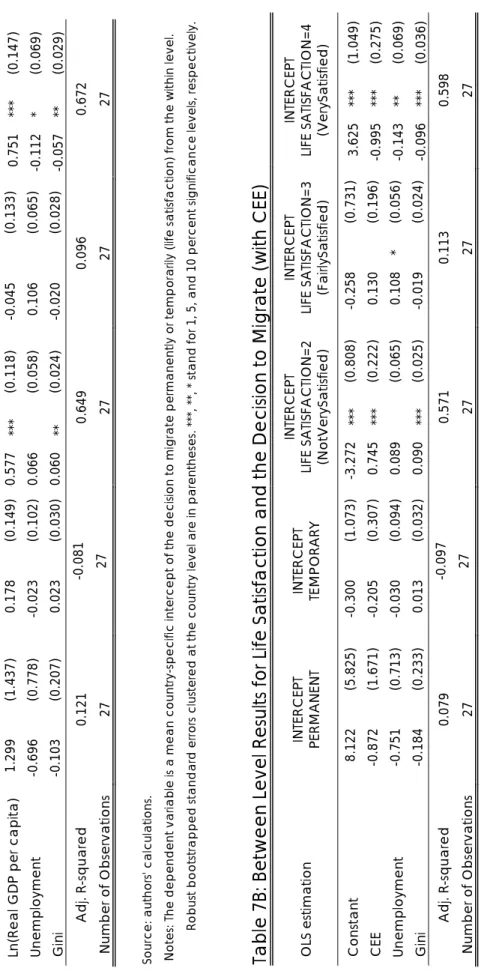
The results for the model with the logarithm of real GDP per capita and for the model with CEE are presented in Tables 7A and 7B, respectively. We have also esti-mated equations (6a1-6a2) with government e¤ectiveness and other economic variables from Table 3. The results are robust to the choice of explanatory variables.19
In Tables 7A and 7B, the columns labeled as "INTERCEPT PERMANENT" and "INTERCEPT TEMPORARY" correspond to equations (6a1-6a2) for the intentions to migrate permanently and temporarily at the country level.20 As observed from these columns, none of the macroeconomic variables are statistically signi…cant.21 Thus, we
18See Bertocchi & Strozzi [6] and [7], Borjas [15], Dustmann, Fabbri, & Preston [27], Dustmann,
Hatton, & Preston [28], Greenwood [35], Stark [55], Tiebout [60], among others.
19The results are available upon request.
20We assume that country level political and economic variables have no e¤ect on the decisions to
migrate internally.
21We also estimated equation (5a) without the life satisfaction variable, but we do not …nd evidence
that macroeconomic variables a¤ect the intention to migrate either.
do not have evidence that the logarithm of real GDP per capita, the unemployment rate, the Gini coe¢ cient, and CEE variable a¤ect the intention migrate permanently or temporarily directly. However, we …nd that these macroeconomic variables a¤ect life satisfaction (see the columns "INTERCEPT LIFE SATISFACTION=2, 3, and 4"). In particular, the fraction of individuals "not very satis…ed" (satisfaction level 2) decreases if GDP per capita increases (or a country belongs to the non-CEE region) and increases if the inequality among individuals rises, while the fraction of "very satis…ed" individuals (satisfaction level 4) increases with higher GDP per capita (or the non-CEE region), lower unemployment, and lower inequality among individuals. As a result, we may conclude that the intention to migrate is a¤ected by these macroeconomic variables through life satisfaction.
As mentioned above, some macroeconomic variables are highly correlated. In our case, government e¤ectiveness, control of corruption and GDP per capita have a similar e¤ect on life satisfaction and can be used indi¤erently. This is especially relevant for explaining the di¤erences in migration intentions between CEE and non-CEE coun-tries since governance conditions in these two regions are substantially di¤erent. For instance, according to the Worldwide Governance Indicators (see Kaufmann et al.[40]), the gap between government e¤ectiveness and the control of corruption in these two regions is large (0.68 vs. 1.40 for government e¤ectiveness and 0.37 vs. 1.51 for the con-trol of corruption). According to Kaufmann et al. [40], the government e¤ectiveness indicator measures the perceptions over the quality of public services provision and policy implementation, while the control of corruption measures the perceptions over the use of public power for private interests and the extent of state capture. All the relationships between country level life satisfaction, macroeconomic and governance variables have an expected sign and underline the importance of the improvement of economic and political conditions for individual satisfaction with life. As a result of improvements in economic development and control of corruption and governance, individuals intend to migrate less.
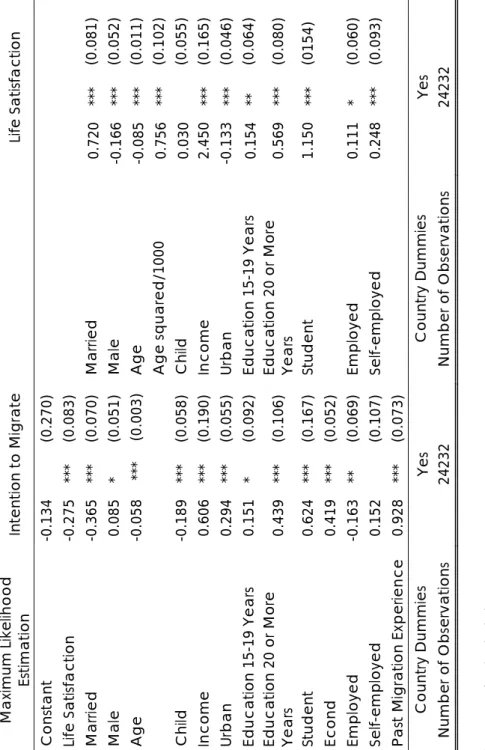
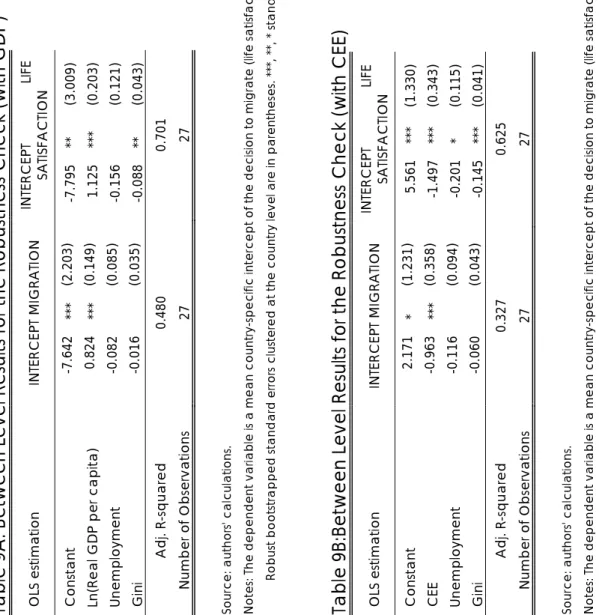
into a binary variable and treat life satisfaction as a continuous latent variable. The individual level results are presented in Table 8. As observed from this table, the results from the modi…ed equations support our previous …ndings. Also, …ndings are similar at the country level for unemployment and the Gini coe¢ cients (see Tables 9A and 9B). However, we …nd that the logarithm of real GDP per capita a¤ects both the intention to migrate and life satisfaction positively, while a CEE dummy a¤ects them negatively. This …nding can be explained by di¤erences in institutional quality between CEE and non-CEE countries. For a given income at the individual level, people from CEE and non-CEE still have di¤erent opportunities to migrate. For instance, in 2008, nationals from CEE countries were still required to have a work permit to have a job in non-CEE and US labor markets. Overall, our …ndings highlight the importance of life satisfaction not only as a predictor of intentions to migrate, but also as a mediator between economic and political conditions and tho se intentions.
5.3
Migration Decisions in CEE and Non-CEE Countries
In this section we discuss the individual level di¤erences in intentions to migrate perma-nently and temporarily from CEE and non-CEE countries.22 We examine the impact of life satisfaction on the individual intention to migrate for di¤erent groups of indi-viduals.
To highlight that life satisfaction and expected income have separate e¤ects on the individual migration decision, we consider those individuals who had the experience of a long-term migration in the past but still intend to migrate, hereafter movers.23 The average life satisfaction of these individuals in CEE countries is 2.39, while in non-CEE countries is 2.88. Individuals who did not migrate in the past and do not intend to migrate in the future, hereafter stayers, are used as a reference category. The average life satisfaction of stayers in CEE and non-CEE countries is 2.63 and 3.04, respectively.
22Since we study the impact of cross-country di¤erences on the individual migration decision, we
do not discuss the di¤erences in decisions to migrate internally between individuals from CEE and non-CEE countries.
23We are grateful to David Blanch‡ower for this point.
Comparing the average life satisfaction scores for movers and stayers, we …nd that movers have lower life satisfaction scores than stayers in the same region. Considering the responses of these individuals regarding the judgement of their households’current …nancial situation, we …nd that the average score for the …nancial situation for movers and stayers in CEE countries is very similar (2.42 vs 2.45). Therefore, we may conclude that movers in CEE countries met their income expectations by migrating, but they are still not satis…ed with the quality of their own lives and, as a result, life dissatisfaction may drive them to migrate again. However, this e¤ect is ambiguous in non-CEE countries. Even though the life satisfaction of movers from non-CEE is lower than the life satisfaction of stayers in this region (2.88 vs. 3.04), their judgement of their own …nancial situation is slightly di¤erent (2.68 for movers and 2.75 for stayers). Therefore, it might be the case that movers in non-CEE countries did not meet their income expectations and were not satis…ed with the quality of their own lives. As a result, it is less clear whether the income or the life satisfaction e¤ect dominates in the intention to migrate for individuals from the non-CEE region.
It should be noted that the results presented in this section are always in comparison with the reference group that represents "not at all satis…ed" individuals. Comparing the average marginal e¤ects for CEE and non-CEE countries in Table 6B, we observe that with an increase in life satisfaction the probability to migrate permanently and temporarily decreases more for individuals from non-CEE than from CEE. For instance, the probability of the intention to migrate permanently of "very satis…ed" individuals is lower in comparison with that of "not at all satis…ed" by 2.22% and 1.23% (by 1.73% and 2.16% in the case of temporary migration) in non-CEE and CEE countries, respectively. In other words, if the life satisfaction of individuals increases by the same amount in both regions, the individuals from CEE intend to migrate more. This result is in line with the widely documented di¤erences in social and economic conditions in East European compared to Western countries. Thus, policies regulating migration ‡ows from CEE countries should not be taken independently from improvements to well-being in the region.
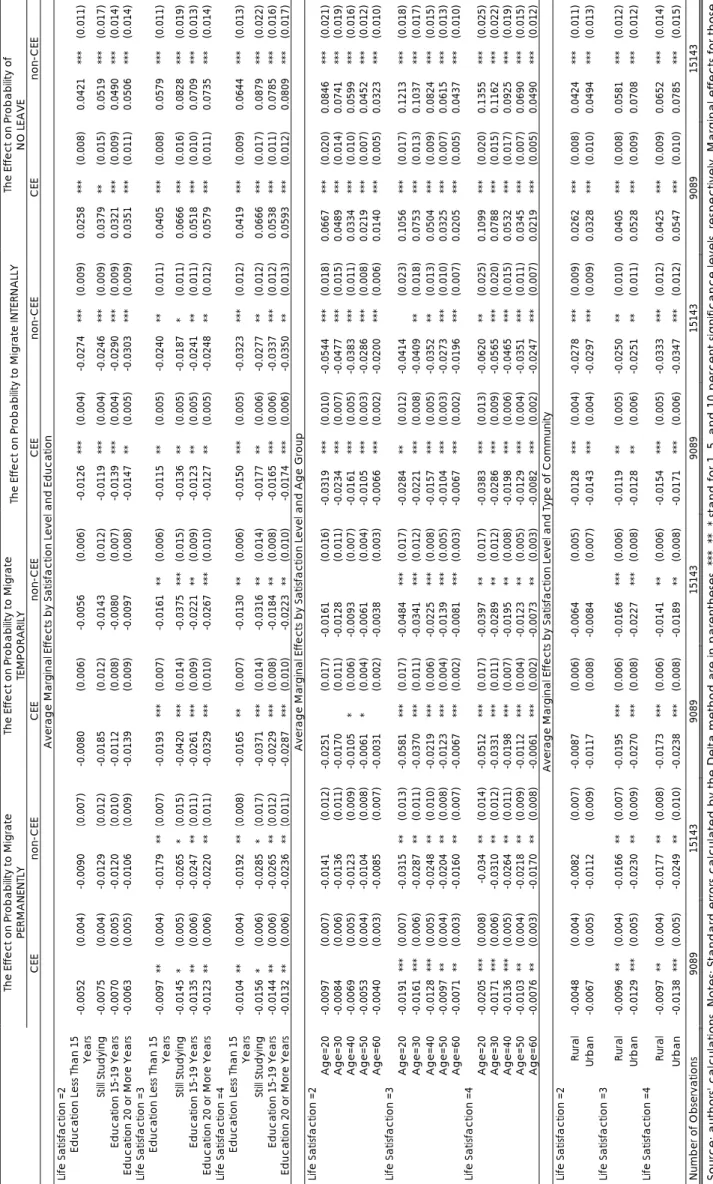
In Table 6B, we compute the average marginal e¤ects of life satisfaction on the intention to migrate for each level of income, employment status, education, age, past experience of migration, and regional location of CEE and non-CEE individuals. As observed, if life satisfaction increases, non-CEE individuals intend to migrate less than CEE individuals at each level of income. For instance, the probability to migrate permanently for "very satis…ed" individuals with income level 4 is lower by 2.49% and 1.42% (by 1.69% and 2.11% in the case of temporary migration) in non-CEE and CEE countries, respectively. The intuition behind this result is based on di¤erent income and employment prospects for people from CEE and non-CEE countries. According to data from the Eurostat, the average net nominal monthly earnings in non-CEE countries is about 1600EUR, while in CEE countries is 460EUR. At the same time, the average long-term unemployment rate is about 2% of the active population in non-CEE and 3% in CEE countries. Given huge wage di¤erentials and higher unemployment rate in the CEE region, individuals from this region are more likely to migrate to …nd a job abroad.
The results are further compared between the individuals with and without past migration experience. In non-CEE countries, "very satis…ed" individuals with past migration experience have lower intentions to migrate permanently than "not at all satis…ed" by 5.16%, while in CEE countries, these individuals intend to migrate less by 3.22%. Thus, once an individual migrated and met his/her expectations regarding life satisfaction, he/she intends to migrate less.
We also …nd that as compared to "not at all satis…ed", the "fairly satis…ed" and "very satis…ed" self-employed individuals from non-CEE countries have a lower inten-tion to migrate permanently than those from CEE, by 3.67% and 3.94% and by 2.12% and 2.27% (by 2.43% and 2% and by 2.9% and 2.53% in the case of temporary migra-tion), respectively. In fact, the average life satisfaction of self-employed individuals in CEE countries is 2.78, while in non-CEE countries is 3.05. This di¤erence is likely to be due to the lower quality of institutions in the CEE region. According to the World-wide Governance Indicators (see Kaufmann et al.[40]), CEE countries underperform
non-CEE countries in regulatory quality and rule of law, which is measured by the perceptions of regulations that allow and promote private sector development, degree of enforcement of property rights, the quality of the police, and the courts (0.99 vs. 1.42 and 0.63 vs. 1.46, respectively). Therefore, the life satisfaction of self-employed individuals may convey information about the quality of the business environment in the country where they work.
A similar pattern is observed for the "fairly satis…ed" and "very satis…ed" employed individuals; the probability to migrate permanently is lower by 1.95% and 2.09% for the non-CEE individuals and by 1.07% and 1.14% for the CEE ones (by 2.09% and 1.76% and by 2.45% and 2.17% in the case of temporary migration). For the "fairly satis…ed" and "very satis…ed" individuals who are not employed, we …nd that the intention to migrate is lower in non-CEE countries than in CEE, by 2.08% and 2.21% and by 1.16% and 1.24% (by 2.01% and 1.67% and by 2.42% and 2.12% in the case of temporary migration), respectively.24 These results suggest that individuals have lower intentions to migrate from regions where the social bene…ts are higher, which are consistent with the …ndings of previous literature (see Borjas [15]). For instance, according to data from the Eurostat, the average monthly unemployment bene…t in non-CEE countries is about 370EUR, while in CEE countries, it is about 70EUR. Thus, the higher intentions to migrate from CEE of those who are not employed may re‡ect their dissatisfaction with the social security system. This point also …nds support in the migration intention of individuals with di¤erent levels of education. We …nd that as compared to the "not at all satis…ed" from the same region, the "very satis…ed", individuals with less than 15 years of education in CEE countries have a lower intention to migrate by 1.04%, while in non-CEE countries this di¤erence is 1.92%. Higher educated individuals at all levels of life satisfaction have lower intentions to migrate than the lower educated although they are still more likely to migrate from CEE countries.
Di¤erences in the quality of the social security system and the quality of institutions
24In Table 6B, those who are not employed are denoted as "Not Working". This group of individuals
may also be re‡ected in the migration intentions of individuals at di¤erent ages. In Table 6B, we also split the results for the individuals in …ve age groups: 20, 30, 40, 50, and 60 years old. We …nd that at all levels of life satisfaction migration intentions decrease with age. The highest di¤erence between CEE and non-CEE countries in the intention to migrate permanently is observed for the age group of 30-year old. In CEE countries, where the quality of institutions and opportunities is lower, 30-year old "very satis…ed" individuals intend to migrate by less 1.71%, while in non-CEE countries, "very satis…ed" individuals of the same age group intend to migrate by less 3.10%.
Finally, we compare the average marginal e¤ects of being a "not at all satis…ed" individual with a "very satis…ed" one from rural and urban areas in Table 6B. We observe that the probabilities of the intention to migrate permanently and temporarily from urban areas decrease by 1.38% and 2.49% in CEE countries and by 2.38% and 1.89% in non-CEE countries, respectively. Thus, dissatis…ed individuals are likely to migrate more from urban areas in CEE, where they have more opportunities and better access to information to migrate abroad.
As our results suggest, the impact of life satisfaction on the intention to migrate for di¤erent groups of individuals in CEE is higher than in non-CEE countries. As discussed above, the life satisfaction measure may convey useful information regarding the quality of institutions and the business environment, the employment situation, and the development of a social security system in a region.
6
Conclusion
This paper provides empirical evidence of the impact of life satisfaction on the individ-ual intention to migrate. The e¤ects of both individindivid-ual and country level factors on the intention to migrate are analyzed jointly. The empirical …ndings of this paper suggest that people dissatis…ed with life have a higher intention to migrate. The individual socio-economic factors and macroeconomic conditions have an e¤ect on the intention
to migrate indirectly through life satisfaction. These empirical …ndings underline the importance of individual life satisfaction not only as a strong predictor of the individual migration decision, but also as a mediator between individual socio-economic variables and macroeconomic conditions and this decision.
Additionally, we analyze the di¤erences in intentions to migrate permanently and temporarily for the Central Eastern European (CEE) countries and the Western Euro-pean (non-CEE) countries. The impact of life satisfaction on the intention to migrate from CEE and non-CEE countries is examined for di¤erent groups of individuals. We …nd that at all levels of life satisfaction individuals with similar characteristics have higher intentions to migrate from CEE countries than from non-CEE countries. The low level of life satisfaction of individuals from CEE countries may be associated with the lower quality of institutions and business environment and with the development of the social security system in this region. Improvements in these conditions will result in an increase in individual life satisfaction and, thus, will lower individual migration intentions.
Our …ndings can be generalized to the migration decisions in regions with con‡icts or natural disasters, with a low quality of institutions, and with economic crises. It may also be interesting to apply our model to study more in detail internal migration. This will be left for future research.
References
[1] Ajzen, I. (1991): "The Theory of Planned Behavior", Organizational Behavior and Human Decision Processes, 50, 179-211.
[2] Ajzen, I., and M. Fishbein (1975): "Belief, Attitude, Intention, and Behavior: An Introduction to Theory and Research", Reading, MA: Addison-Wesley.
[3] Ajzen, I., and M. Fishbein (2005): "The In‡uence of Attitudes on Behavior ". In D. Albarracin, B. Johnson, and M. Zanna (Eds.), The Handbook of Attitudes, Mahwah, NJ: Erlbaum, 173-221.
[4] Antecol, H., and D. Cobb-Clark (2009): "Racial Harassment, Job Satisfaction, and Intentions to Remain in the Military", Journal of Population Economics, 22, 713-738.
[5] Berger, M., and G. Blomquist (1992): "Mobility and Destination in Migration Decisions: The Roles of Earnings, Quality of Life, and Housing Prices", Journal of Housing Economics, 2(1), 37-59.
[6] Bertocchi, G., and C. Strozzi (2006): "The Age of Mass Migration: Economic and Institutional Determinants", IZA Discussion Paper No.2499.
[7] Bertocchi, G., and C. Strozzi (2008): "International Migration and the Role of Institutions", Public Choice, 137, 81-102.
[8] Blanch‡ower, D., and R. Freeman (1997): "The Attitudinal Legacy of Communist Labor Relations", Industrial and Labor Relations Review, 50(3), 438-459.
[9] Blanch‡ower, D., J. Saleheen, and C. Shadforth (2007): "The Impact of the Recent Migration from Eastern Europe on the UK Economy", Bank of England External MPC Unit Discussion Paper, No. 17.
[10] Blanch‡ower, D., and C. Shadforth (2009): "Fear, Unemployment and Migration", Economic Journal, 119, 136-182.
[11] Bockerman, P., and P. Ilmakunnas (2009): "Job Disamenities, Job Satisfaction, Quit Intentions, and Actual Separations: Putting the Pieces Together", Industrial Relations, 48(1), 73-96.
[12] Boheim, R., and M. Taylor (2002): "Tied Down or Room to Move? Investigating the Relationships between Housing Tenure, Employment Status and Residential Mobility in Britain", Scottish Journal of Political Economy, 49, 369-392.
[13] Bohra-Mishra, P., and D. Massey (2011): "Individual Decisions to Migrate During Civil Con‡ict", Demography, 48, 401-424.
[14] Bollen, K. (1989): "Structural Equations with Latent Variables", John Wiley & Sons, Inc.
[15] Borjas, G. (1999): "Immigration and Welfare Magnets", Journal of Labor Eco-nomics, 17(4), 607-637.
[16] Cameron, A.C., and P.K. Trivedi (2005): "Microeconometrics: Methods and Ap-plications", Cambridge University Press.
[17] Clark, A. (2001): "What Really Matters in a Job? Hedonic Measurement Using Quit Data", Labour Economics, 8, 223-242.
[18] Clark, A., E. Diener, Y. Georgellis, and R. Lucas (2008): "Lags and Leads in Life Satisfaction: a Test of the Baseline Hypothesis", Economic Journal, 118, 222-243. [19] De Jong, G., R. Abad, B. Carino, J. Fawcett, and R. Gardner (1983): "Inter-national and Internal Migration Decision Making: a Value-Expectancy Based Analytical Framework of Intensions to Move from a Rural Philippine Province", International Migration Review, 17(3), 470-484.
[20] De Jong, G., A. Chamratrithirong, and Q. Tran (2002): "For Better, for Worse: Life Satisfaction Consequences of Migration", International Migration Review, 36(3), 838-863.
[21] De Neve, J., N. Christakis, J. Fowler, and B. Frey (2011): "Genes, Economics, and Happiness", mimeo.
[22] Di Tella, R., J. Haisken-De New, and R. MacCulloch (2010): "Happiness Adap-tation to Income and to Status in an Individual Panel", Journal of Economic Behavior and Organization, 76, 834-852.
[23] Diener, E., E. Suh, R. Lucas, and H. Smith (1999): "Subjective Well-Being: Three Decades of Progress", Psychological Bulletin, 125(2), 276-302.
[24] Dolan, P., and D. Kahneman (2008): "Interpretations of Utility and Their Impli-cations for the Valuation of Health", Economic Journal, 118, 215-234.
[25] Dreher, A., Krieger, T., and D. Meierrieks (2011): "Hit and (They Will) Run: The Impact of Terrorism on Migration", Economics Letters, 113, 42-46.
[26] Dustmann, C. (2003): "Children and Return Migration", Journal of Population Economics, 16, 815-830.
[27] Dustmann, C., F. Fabbri, and I. Preston (2005): "The Impact of Immigration on the British Labour Market", Economic Journal, 115, 324-341.
[28] Dustmann, C., T. Hatton, and I. Preston (2005): "The Labour Market E¤ects of Immigration", Economic Journal, 115, 297-299.
[29] Easterlin, R., and A. Zimmermann (2008): "Life Satisfaction and Economic Out-comes in Germany Pre- and Post-Uni…cation", Journal of Economic Behavior and Organization, 68 (3-4), 433-444.
[30] Freeman, R. (1978): "Job Satisfaction as an Economic Variable", American Eco-nomic Review, 68(2), 135-141.
[31] Frey, B., and A. Stutzer (2002): "What Can Economists Learn from Happiness Research?" Journal of Economic Literature, 40(2), 402-435.
[32] Frey, B., and A. Stutzer (2006): "Does Marriage Make People Happy, or Do Happy People Get Married?" Journal of Socio-Economics, 35, 326-347.
[33] Gibson, J., and D. McKenzie (2011): "The Microeconomic Determinants of Em-igration and Return MEm-igration of the Best and Brightest: Evidence from the Paci…c", Journal of Development Economics, 95(1), 18-29.
[34] Gordon, I., and I. Molho (1995): "Duration Dependence in Migration Behavior: Cumulative Inertia versus Stochastic Change", Environment and Planning, 27, 1961-1975.
[35] Greenwood, M.(1997): "Internal Migration in Developed Countries". In Rosen-zweig, M. and O. Stark (eds.) Handbook of Population and Family Economics, Ch.12, Vol. 1B, North Holland.
[36] Guven, C. (2012): "Reversing the Question: Does Happiness A¤ect Consumption and Savings Behavior?", Journal of Economic Psychology, 33, 701-717.
[37] Guven, C., C. Senik, and H. Stichnoth (2012): "You Can’t Be Happier Than Your Wife. Happiness Gaps and Divorce", Journal of Economic Behavior and Organization, 82(1), 110-130.
[38] Hale, J. and B. Householder (2002): "The Theory of Reasoned Action." In J. Dillard and M. Pfau (Eds.), The Persuasion Handbook: Developments in Theory and Practice, Newbury Park: CA Sage, 259-286.
[39] Kahneman, D., P. Wakker, and R. Sarin (1997): "Back to Bentham? Explorations of Experienced Utility", Quarterly Journal of Economics, 112(2), 375-405.
[40] Kaufmann, D., A. Kraay, and M. Mastruzzi (2009): "Governance Matters VIII: Governance Indicators for 1996-2008 ". World Bank Policy Research Working Pa-per #4978.
[41] Kennan, J., and J. Walker (2011): "The E¤ect of Expected Income on Individual Migration Decisions", Econometrica, 79(1), 211-251.
[42] Kristensen, N., and N. Westergerd-Nielsen (2004): "Does Low Job Satisfaction Lead to Job Mobility? " IZA Discussion Paper No. 1026.
[43] Lucas, R., A. Clark, Y. Georgellis, and E. Diener (2003): "Reexamining Adap-tation and the Set Point Model of Happiness: Reactions to Changes in Marital Status", Journal of Personality and Social Psychology, 84(3), 527-539.
[44] Lucas, R., A. Clark, Y. Georgellis, and E. Diener (2004): "Unemployment Alters the Set Point for Life Satisfaction", Psychological Science, 15(1), 8-13.
[45] Lyubomirsky, S., L. King, and E. Diener (2005): "The Bene…ts of Frequent Pos-itive A¤ect: Does Happiness Lead to Success?", Psychological Bulletin, 131(6), 803-855.
[46] Lyubomirsky, S., K. Sheldon, and D. Schkade (2005): "Pursuing Happiness: The Architecture of Sustainable Change", Review of General Psychology, 9(2), 111-131.
[47] Morrison, A. (1993): "Violence or Economics: What Drives Internal Migration in Guatemala?" Economic Development and Cultural Change, 41(4), 817-831. [48] Rabinovich, A., and P. Webley (2007): "Filling the Gap between Planning and
Doing: Psychological Factors Involved in the Successful Implementation of Saving Intention", Journal of Economic Psychology, 28(4), 444-461.
[49] Raudenbush, S. , and A. Bryk (2002): "Hierarchical Linear Models", 2nd ed., Thousand Oaks: Sage.
[50] Sa…, M. (2010): "Immigrants’Life Satisfaction in Europe: Between Assimilation and Discrimination", European Sociological Review, 26(2), 159-176.
[51] Shields, M., and M. Ward (2001): "Improving Nurse Retention in the National Health Service in England: the Impact of Job Satisfaction on Intentions to Quit", Journal of Health Economics, 20, 677-701.
[52] Sirkeci, I. (2005): "War in Iraq: Environment of Insecurity and International Migration", International Migration, 43(4), 197-214.
[53] Sjaastad, L. (1962): "The Costs and Returns of Human Migration", Journal of Political Economy, 70(5), 80-93.
[54] Stark, O. (2003): "Tales of Migration without Wage Di¤erentials: Individual, Family, and Community Contexts", ZEF Discussion Paper No.73.
[55] Stark, O. (2006): "Inequality and Migration: A Behavioral Link", Economics Letters, 96, 146-152.
[56] Stark, O., and D. Bloom (1985): "The New Economics of Labor Migration", American Economic Review, 75(2), 173-178.
[57] Stark, O., and J. Taylor (1991): "Migration Incentives, Migration Types: the Role of Relative Deprivation", Economic Journal, 101, 1163-1178.
[58] Stark, O., and Y. Wang (2000): "A Theory of Migration as a Response to Relative Deprivation", German Economic Review, 1(2), 131-143.
[59] Stevens, P. (2005): "The Job Satisfaction of English Academics and Their Inten-tions to Quit Academe", NIESR Discussion Paper No. 262.
[60] Tiebout, C. (1956): "A Pure Theory of Local Expenditures", Journal of Political Economy, 64 (5), 416–424.
[61] Vlaev, I. (2012): "How Di¤erent are Real and Hypothetical Decisions? Overes-timation, Contrast and Assimilation in Social Interaction", Journal of Economic Psychology, 33, 963-972.
Appendi x A. Tables. Table 1. Sample Mean Li fe Sati sf acti on Scores Coun try W a ve Apr-M a y 2 00 8 W a ve Oct -Nov 20 08 Rank Me an Life Sa tis fa c tio n St d. Dev . Rank Me an Life Sa tis fa c tio n St d. Dev . Den m ark 1 3. 614 0. 577 1 3. 616 0. 580 Ne th erl a nd s 2 3. 450 0. 604 2 3. 495 0. 564 Swed en 3 3. 447 0. 604 3 3. 457 0. 556 Luxe mbo urg 4 3. 393 0. 638 4 3. 304 0. 695 Fi nland 5 3. 272 0. 608 5 3. 275 0. 570 Ire la nd 6 3. 266 0. 673 7 3. 173 0. 682 U ni ted Ki ng d o m 7 3. 201 0. 695 6 3. 193 0. 692 M a lta 8 3. 144 0. 687 11 3. 030 0. 762 Cy prus ( Repub lic) 9 3. 118 0. 672 9 3. 120 0. 740 Be lgi um 10 3. 111 0. 724 8 3. 125 0. 690 Slo venia 11 3. 094 0. 638 10 3. 046 0. 710 Spain 12 3. 016 0. 615 12 2. 966 0. 624 A us tri a 13 2. 997 0. 620 13 2. 965 0. 639 Ger m any 14 2. 923 0. 724 14 2. 955 0. 715 France 15 2. 904 0. 736 16 2. 890 0. 730 Czech Republic 16 2. 903 0. 594 15 2. 907 0. 574 Es to ni a 17 2. 808 0. 659 18 2. 796 0. 621 Poland 18 2. 800 0. 732 17 2. 804 0. 668 Slo va kia 19 2. 681 0. 711 19 2. 728 0. 721 Gre e c e 20 2. 671 0. 745 23 2. 480 0. 751 Lithua nia 21 2. 638 0. 802 20 2. 627 0. 782 La tv ia 22 2. 623 0. 745 22 2. 611 0. 730 Ita ly 23 2. 619 0. 720 21 2. 613 0. 699 Romania 24 2. 483 0. 760 24 2. 391 0. 745 Por tuga l 25 2. 462 0. 732 25 2. 361 0. 744 Hungary 26 2. 347 0. 825 26 2. 301 0. 808 Bulgaria 27 2. 218 0. 862 27 2. 170 0. 793 Sourc e : cons tru c ted by t h e au thors using th e E urobarom e te r S ur vey . N o te s: Countries are ranked according t o the me an l ife sat isfact ion scor e in th e w a ve coll e c te d during A p ril -May 2008. Th e w a ve coll e c te d during Oct o b e r-N o ve mbe r 2008 is use d fo r the e st ima tions. T h e countries of Ce nt ral and Eas te rn Europ e are s ha d ed .
Ta ble 2 : T h e Number of I ntended Leav es by Li fe Sati sfacti on Life Sat isfact ion 1 (n ot at all sa tisfied) 2 ( not very sa tisfied) 3 ( fai rly sa tisfied) 4 ( very sa tisfied)
Total number of respondent
s Perc en t Cumul. Intended Leave 0 ( p e rm a nent int e rnat ional) 19 52 94 41 20 6 0. 85 0. 85 1 ( temporar y int e rnat ional) 40 1 45 347 196 728 3. 00 3. 85 2 ( int ern a l) 65 1 88 858 414 1 52 5 6. 29 10. 15 3 ( no lea ve) 1 18 9 4 28 6 11 9 27 4 37 1 21 7 73 89. 85 10 0. 00
Total number of respondent
s 1 31 3 4 67 1 13 2 26 5 02 2 24 2 32 Perc en t 5. 42 19. 28 54. 58 20. 72 Cu m ul. 5. 42 24. 69 79. 28 10 0. 00 e : cons tru c ted by t h e au thors using th e E urobarom e te r S ur vey . Ta ble 3: T h e Correlation Matr ix fo r Macroeconomi c Var iables CEE Log (Re al GDP per Capi ta ) Un em p lo ym e nt Ra te In fla tio n Rate Go ve rnment Effec tiv eness Regul a to ry Qua lit y Control of Corrup tio n Gi ni Coeffi ci ent CEE 1. 0000 Log (Re al GDP per Capi ta ) -0.8487 1 .0000 Un em pl oym e nt Ra te 0. 0491 -0.2013 1. 0000 In fla tio n R a te 0. 7088 -0.6932 0. 0006 1. 0000 Go ve rnment Effec tiv eness -0.6348 0 .8363 -0.3500 -0.5422 1. 0000 Regul a to ry Quali ty -0.5798 0 .7657 -0.3242 -0.4183 0. 8889 1. 0000 Control of Co rrup tio n -0.6989 0 .8641 -0.3230 -0.5906 0. 9489 0. 8860 1. 0000 Gi ni C o e ffi ci en t 0. 1501 -0.4152 0. 2509 0. 5019 -0.5754 -0.4234 -0.4834 1. 0000 e : cons tru c ted by t h e au thors using th e E urost a t and W G I dat a from Kau fmann et al . [40].
Ta
ble 4
: W
ithin Lev
e
l Results for the I
ntention to Mi gr ate Mu lti nomial Logit Est imat ion In ten tio n t o Migrate PE RMANEN TLY In ten tio n t o Migrate TEMPORAR IL Y In ten tio n t o Migrate INT ERNALL Y Cons tan t -2 .275 ** * (0 .566) -1 .159 ** * ( 0. 298) 0. 176 (0 .205) Life Sa tisfaction =2 (N ot V e ry Sat isfied) -0 .571 * (0 .312) -0 .360 * ( 0. 189) -0 .450 ** * ( 0. 110) Life Sa tisfaction =3 (F a irl y Sat isfie d) -1 .458 ** * (0 .328) -0 .877 ** * ( 0. 198) -0 .460 ** * ( 0. 120) Life Sa tisfaction =4 (V e ry Sat isfie d) -1 .661 ** * (0 .447) -0 .772 ** * ( 0. 203) -0 .598 ** * ( 0. 151) M a rri ed -0. 476 ** * (0 .134) -0 .537 ** * ( 0. 143) -0 .476 ** * ( 0. 074) M a le 0. 244 (0 .183) 0. 237 ** ( 0. 093) 0. 037 (0 .074) A g e -0. 036 ** * (0 .009) -0 .069 ** * ( 0. 005) -0 .051 ** * ( 0. 003) Chi ld -0. 240 (0 .163) -0. 215 * ( 0. 115) -0 .160 ** ( 0. 062) Incom e 0. 110 (0 .110) -0. 009 (0 .082) 0. 006 (0 .035) U rban 0. 468 ** * (0 .165) 0. 529 ** * ( 0. 123) 0. 234 ** * ( 0. 067) Ed uca tio n 1 5-19 Ye ars 0. 395 * (0 .206) 0. 226 (0 .223) 0. 100 (0 .088) Ed uca tio n 2 0 or M o re Ye ars 0. 231 (0 .310) 0. 671 ** * ( 0. 222) 0. 253 ** ( 0. 100) St ud en t 0. 437 (0 .412) 1. 019 ** * ( 0. 243) -0 .035 (0 .147) Econd 0. 692 ** * (0 .220) 0. 412 ** * ( 0. 124) 0. 391 ** * ( 0. 073) Em ploy ed -0. 168 (0 .175) -0. 044 (0 .115) -0. 169 * ( 0. 101) Self -e mp loy e d 0. 777 ** * (0 .293) 0. 362 ** ( 0. 176) -0 .051 (0 .158) Pas t M igra tio n Exp e rien ce 1. 436 ** * (0 .191) 1. 618 ** * ( 0. 157) 0. 408 ** * ( 0. 129) Coun try Du mmi es Yes Yes Yes Pseudo R-Squared 0. 208 0. 208 0. 208 N um b e r of Obse rv at ions 2423 2 2423 2 2423 2 Sourc e : au th ors' cal c ul at ions . No tes: St an dar d erro rs cl ust e re d a t th e coun tr y le ve l are in p a ren thes e s. ***, **, * s tand for 1 , 5, and 10 p e rc en t significanc e le ve ls, re sp e c tiv e ly . Li fe sa tisfact ion =1 (" not a t all s a tisfie d") is use d as t h e base ca teg o ry of l ife sa tisfact ion; le ss than 15 ye ars of educa tio n an d no full ti me edu c a tion ar e used as t h e base ca tegory for educ at io n l e ve l; t h ose w h o d o no t work are used as th e base ca
tegory for empl
oyment s tat us . Ec ond is a dummy e q ual to one if the inte n tio n to m igra te ab road i s driv en b y econom ic fa ctors . For th e i ndiv idual s w h o inte nd to mig ra te inte rnally, E c ond s tands for t h e fa ctors in t h e cas e of a hypothet ical mig ra tion abroad.
Table 5 : Wi thi n Lev e l Resu lts for L ife Satisfacti on Lo g it E sti m a tio n LI FE SA TI SF A C TI O N =2 (N o t V e ry S a tis fie d ) LI FE SA TI SF A C TI O N =3 (F a irl y S a tis fie d ) LI FE SA TI SF A C TI O N =4 (V e ry S a tis fie d) Cons tan t -0. 157 (0 .293) -0. 909 ** ( 0. 374) -3 .641 ** * ( 0. 281) M a rri ed -0. 201 ** * (0 .059) -0 .008 (0 .054) 0. 441 ** * ( 0. 041) M a le -0. 013 (0 .035) -0. 004 (0 .035) -0. 079 (0 .052) A g e 0. 041 ** * (0 .008) -0 .010 (0 .006) -0. 052 ** * ( 0. 010) Age squared/1000 -0. 396 ** * (0 .088) 0. 099 (0 .065) 0. 435 ** * ( 0. 089) Chi ld -0. 073 (0 .047) -0. 045 (0 .040) 0. 053 (0 .049) Incom e -0. 974 ** * (0 .072) 0. 443 ** * (0 .131) 1. 245 ** * ( 0. 076) U rban 0. 031 (0 .043) 0. 069 * ( 0. 038) -0 .091 * ( 0. 046) Ed uca tio n 1 5-19 Ye ars -0 .063 (0 .074) 0. 134 ** * (0 .049) -0. 027 (0 .071) Ed uca tio n 2 0 or M o re Ye ars -0 .273 ** * (0 .088) 0. 074 (0 .061) 0. 264 ** * ( 0. 073) St ud en t -0. 541 ** * (0 .116) 0. 129 (0 .096) 0. 499 ** * ( 0. 095) Em ploy ed -0. 038 (0 .070) 0. 193 ** * (0 .048) -0. 104 (0 .073) Self -e mp loy e d -0. 079 (0 .080) 0. 158 ** * (0 .048) 0. 041 (0 .072) Coun try Du mmi es Yes Yes Yes Pseudo R-sq uared 0. 187 0. 051 0. 249 N um b e r of Obse rv at ions 2423 2 2423 2 2423 2 e :a u th o rs' cal c ul at ions. tes: St an dar d erro rs cl ust e re d a t a coun try lev e l are in pare nthes e s. ***, ** , * s tand for 1 , 5 , and 10 perc en t significance le ve ls, re spe c tiv e ly. Le ss th a n 15 years of e d u c a tion and no full t ime educa tion are used as th e base ca tego ry for educa tio n l e ve l,t h ose w h o do no t w o rk are us ed as th e b a se ca te gor y f o r em p loy m e nt s ta tus .