BJRS
RADIATION SCIENCES
06-01 (2018) 01-14Patterns and trends of Computed Tomography usage
among pediatric and young adult patients in a private
hospital in Rio de Janeiro, 2005-2015
T. O. Chaves
a; A. C. M. Dovales
a; L. A. R. da Rosa
a; L. H. S. Veiga
a,baInstituto de Radioproteção e Dosimetria, Av. Salvador Allende, 22783-127, Barra da Tijuca,
Rio de Janeiro, RJ, Brasil
ABSTRACT
Computed tomography (CT) scanning is a relatively high-dose procedure which use has been rapidly increasing in many countries, although a decline has been observed recently in some developed countries. Relatively little is known about CT usage in Brazil. A recent report showed that number of CT procedures among outpatients of the Brazilian public healthcare system (SUS) tripled from 2001 to 2011 and about 13% of all CTs procedures were performed in pediatric and young adult patients. In the present study, we aimed to evaluate CT use in the private healthcare system, where the larger availability of CT scanners may result in a different CT usage pattern. We evaluated data from 15,892 CT procedures underwent by children and young adults (<20 years) between 2005 and 2015 in a private general hospital in the city of Rio de Janeiro. These procedures represented about 8% of the overall number of CT scans in the hospital over the study period. The number of CT examinations increased 10% per year, from 902 in 2005 to 2,376 in 2015. Head/neck was the most frequently examined body anatomical region for all age groups, except for patients aged 15-19 years for whom abdomen/pelvis was the most common scanned region. One third of the patients underwent more than one CT examination in the study hospital, with multiple CT exams increasing with patient age. The greater availability of other diagnostic imaging examinations in the private setting, such as magnetic resonance and ultrasound, could have contributed to the lower proportion of pediatric and young adult CT in the study hospital. The rapid increase of pediatric CT usage in the public and private healthcare setting reinforces the need for initiatives to avoid unwarranted CT exposure in Brazil.
1. INTRODUCTION
Population exposure to ionizing radiation has increased significantly in the last decades mostly because of the rising use of radiation in medicine, especially computed tomography (CT) [1]. The benefits of CT as a diagnostic tool are unquestionable, but there is concern about the potential risk of cancer induction, given the relatively high radiation doses involved [2]. Although the individual risk from a CT scan is likely to be very small, the large number of people exposed annually can lead to a considerable number of future cancer cases. Pediatric CT is particularly relevant as children have generally higher risks of developing radiation-induced cancer and a longer lifetime to cancer development [3].
Pediatric CT use has increased in many countries over the last years [4,5,6,7]. However, recent data suggest that pediatric CT use may be declining in some developed countries [8,9,10]. Studies conducted between 2000 and 2012 have shown that the proportion of pediatric and young adult CT in developed countries ranges from 1% in Germany and France [11,12] to 7–11% in the USA [13,14]. Head/neck is the most frequent type of CT scan for children and young adults, followed by abdomen/pelvis CT [4,5,15].
Relatively little is known about the trends and patterns of CT usage in developing countries [16-18]. A recent study in Brazil showed that CT use among outpatients of Brazilian public healthcare system (SUS), has more than tripled between 2001 and 2011 [19]. Of note, about 13% of all CT procedures were performed in pediatric and young adult patients (< 20 years), which is among the highest frequencies of CT use in this age group worldwide [19].
Nevertheless, healthcare in Brazil is also provided by a privately funded subsystem, which is accessed mainly by healthcare plan/insurance coverage. This coverage has increased over the last years and currently reaches around 25% of the Brazilian population. Differences in CT use between the public and private subsystems may be expected, mainly due to the greater availability of CT scanners in the last [19].
There is large variation in the rate of insured population within the country, with the Southeast presenting the highest coverage rate for Brazilian geographical regions (37%) [20]. Within the
Southeast region, the metropolitan region of the city of Rio de Janeiro [21] presents one of the highest coverage rate (around 50% of the population have health insurance/plan coverage).
Therefore, taking into account all these reasons: a) the worldwide concern about radiation-related cancer risk due to pediatric CT; b) the high proportion of pediatric CT in the public health care system in Brazil; d) the lack of information on pediatric CT usage in the Brazilian private setting; and e) the availability of information on CT usage in a private hospital of the metropolitan region of Rio de Janeiro, where half of the population is insured, we aimed to evaluate the patterns and trends of pediatric and young adult (< 20 years) CT usage in a private hospital in the city of Rio de Janeiro, from 2005 to 2015.
2. MATERIALS AND METHODS
This study evaluated CT examinations in one of the main private hospitals in Rio de Janeiro, which provides emergency and non-emergency health care services for local population (both out- and inpatients). The hospital operated with a 40-detector row CT scanner from 2005 to 2012. In 2013, a new 64-detector row machine replaced it and a new 16-detector row CT scanner was installed. Thereafter, the two scanners remained in operation until the end of the study period.
Information regarding each CT procedure, such as patient identification number (ID), age, gender, type and date of examination, among others, were extracted directly by the administrator of the Radiological Information System (RIS) through an online consultation. The patient ID was used to quantify the number of exams performed per patient during the 11-years period and the frequency of multiple exams. Few CT procedures with missing information on scanned body anatomical region or patient gender were excluded from the analysis.
Compound Annual Growth Rate (CAGR) was used to evaluate growth trends over the entire study period and also over the periods of 2005-2008, 2009-2011 and 2012-2015. These sub-periods were selected in order to evaluate differences in the annual growth rate over time. CAGR was calculated using the following equation:
1 / , 1 0 0 1 / 1 1 0 t t t t N N t t CAGR (1)Where and represent the number of procedures in the first and the last year of the period, respectively, and and represent the first and last year of the corresponding period respectively. Data treatment and statistical analysis were performed using the software STATA version 10 (Stata Corp, College Station, TX).
3. RESULTS
Our study population comprised children and young adults (< 20 years of age) who underwent 15,892 CT procedures in the study hospital between 2005 and 2015. CT examinations within this age group represented around 8% of the overall number of CT procedures for all ages.
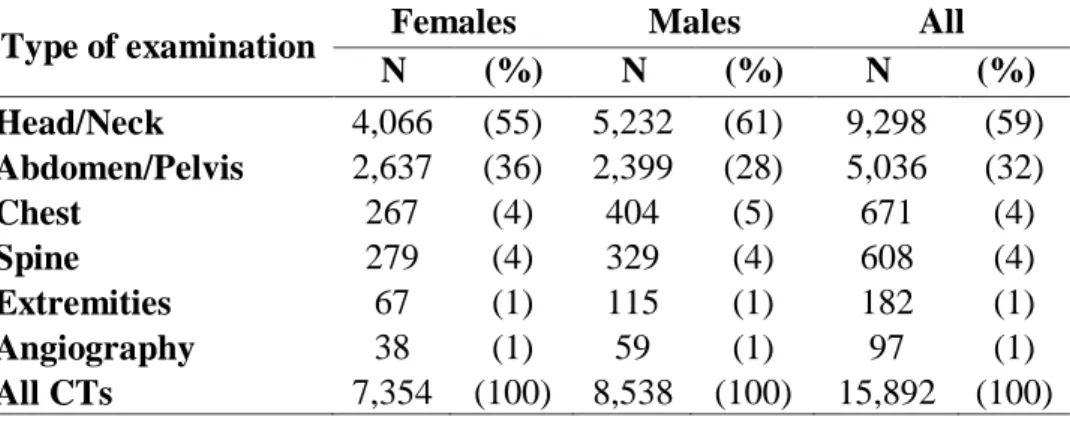
Table 1 shows the distribution of pediatric and young adult CT scans per gender and scanned body anatomical region for the period 2005-2015. Overall, the most frequent type of CT examination within patients under 20 years of age was head/neck (59%) followed by abdomen/pelvis (32%). In general, males underwent more CT scans than females (54 and 46% of all CT procedures, respectively). CT scans were more frequent in males than in females for most body anatomical regions, except for abdomen/pelvis, which was more frequently examined in females than in males.
Table 1. Number of pediatric and young adult CT examinations by
body anatomical region and gender, 2005-2015.
Type of examination Females Males All N (%) N (%) N (%) Head/Neck 4,066 (55) 5,232 (61) 9,298 (59) Abdomen/Pelvis 2,637 (36) 2,399 (28) 5,036 (32) Chest 267 (4) 404 (5) 671 (4) Spine 279 (4) 329 (4) 608 (4) Extremities 67 (1) 115 (1) 182 (1) Angiography 38 (1) 59 (1) 97 (1) All CTs 7,354 (100) 8,538 (100) 15,892 (100)
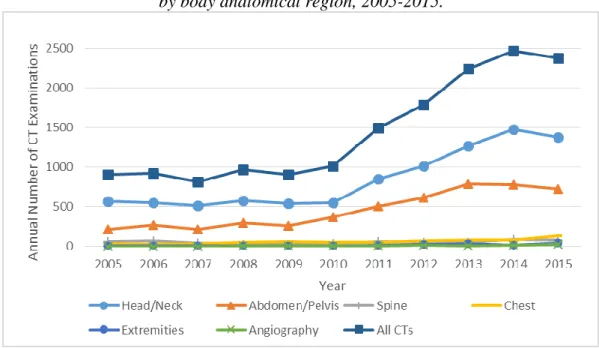
The overall number of CT examinations in children and young adults in the study hospital almost tripled over the study period, rising from 902 procedures in 2005 to 2,376 in 2015 (Figure 1). This trend was more pronounced between 2010 and 2014, with a slight decrease in 2015. Similar trends were observed for head/neck and abdomen/pelvis CT examinations.
Figure 1: Number of pediatric and young adult CT examinations per year
by body anatomical region, 2005-2015.
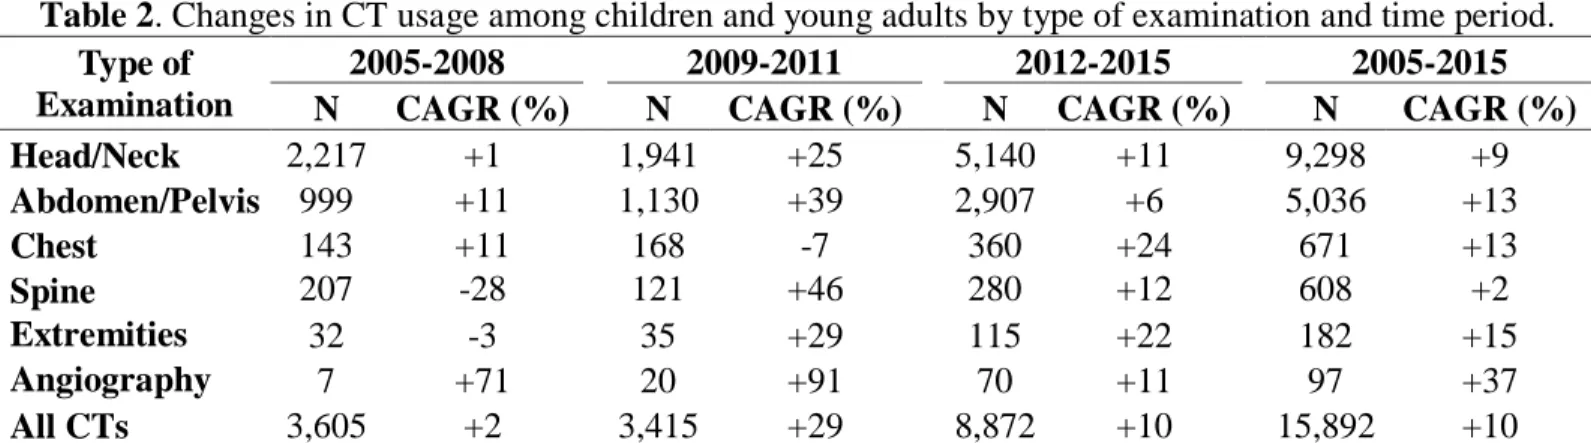
Overall, pediatric and young adult CT usage in the study hospital increased by 10% per year between 2005 and 2015 (Table 2). All types of CT procedures had increasing use, with angiography CT presenting the highest annual increase over the period (37%). When the different sub-periods 2005-2008, 2009-2011 and 2012-2015 were evaluated, most types of CT scan had the highest annual growth rate in 2009-2011.
Table 2. Changes in CT usage among children and young adults by type of examination and time period. Type of
Examination
2005-2008 2009-2011 2012-2015 2005-2015 N CAGR (%) N CAGR (%) N CAGR (%) N CAGR (%) Head/Neck 2,217 +1 1,941 +25 5,140 +11 9,298 +9 Abdomen/Pelvis 999 +11 1,130 +39 2,907 +6 5,036 +13 Chest 143 +11 168 -7 360 +24 671 +13 Spine 207 -28 121 +46 280 +12 608 +2 Extremities 32 -3 35 +29 115 +22 182 +15 Angiography 7 +71 20 +91 70 +11 97 +37 All CTs 3,605 +2 3,415 +29 8,872 +10 15,892 +10
Note: CAGR - Compound Annual Growth Rate as defined in the Methods section. CGAR is given as a percentage of increase (+) or decrease (-).
Table 3 shows the proportion of CT examinations and annual growth rates of CT usage by age group and scanned body anatomical region for the period 2005-2015. Throughout the study period, the frequency of head/neck CT scans decreased with increasing patient age, while abdomen/pelvis CT increased with the age of the patient. The overall number of CT examinations had the largest increase among children under 5 years of age (12.6% per year). The same was observed for head/neck scans, while for abdomen/pelvis examinations the youngest group had a lower growth rate than the older groups.
Table 3. Number and proportion (%) of CT procedures and changes (CAGR) in CT use by age
group and type of examination, 2005-2015.
Type of examination
Age at exposure (years)
<5 5-14 15-19 <20 Head/Neck N (%) 3,972 (84.9) 3,547 (58.4) 1,779 (34.6) 9,298 (58.5) CAGR (%) +13.4 +6.9 +6.8 +9.2 Abdomen/Pelvis N (%) 372 (8.0) 1,929 (31.7) 2,735 (53.2) 5,036 (31.7) CAGR (%) +9.5 +12.9 +13.3 +12.8 Chest N (%) 171 (3.7) 223 (3.7) 277 (5.4) 671 (4.2) CAGR (%) +10.4 +11.9 +17.3 +13.5 Spine N (%) 105 (2.2) 250 (4.1) 253 (4.9) 608 (3.8) CAGR (%) +2.9 -0.4 +3.6 +1.9 Extremities N (%) 24 (0.5) 107 (1.8) 51 (1.0) 182 (1.1) CAGR (%) +12 +17 +14 +15 Angiography N (%) 32 (0.7) 20 (0.3) 45 (0.9) 97 (0.6) CAGR (%) +7.6 +19.6 +36.4 +36.8 All CTs N (%) 4,676 (100.0) 6,076 (100.0) 5,140 (100.0) 15,892 (100.0) CAGR (%) +12.6 +8.7 +10.1 +10.2
Note: CAGR - Compound Annual Growth Rate as defined in the Methods section. CGAR is given as a percentage of increase (+) or decrease (-).
a CAGR calculated for the period 2008-2015 as there were no procedures for these age groups from 2005 to 2007. b CAGR calculated for the period 2007-2015 as there were no procedures for these age groups from 2005 to 2006.
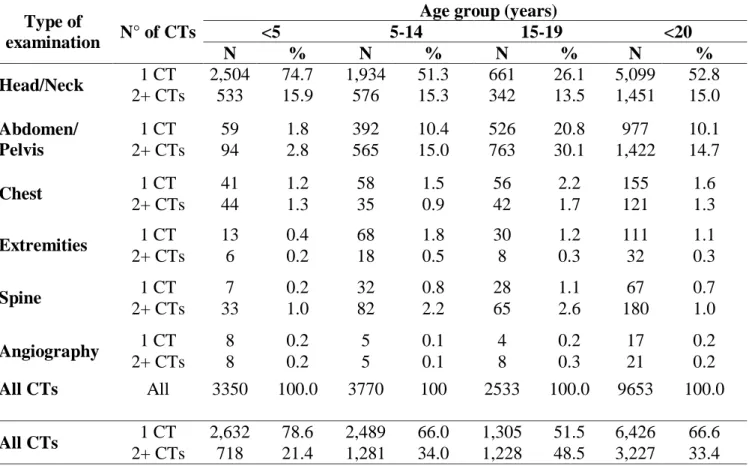
About one third the patients aged less than 20 years underwent more than one CT scan in the study hospital along the 11 years period (Table 4). The proportion of patients with multiple CT exams increased with patient age, ranging from 21.4% for patients <5 years to 48.5% among patients aged 15-19 years. Head/neck and abdomen/pelvis were the scanned body anatomical regions with the highest numbers of multiple examinations in the same patient, for all age groups.
Table 4. Number and proportion of patients that performed multiple examinations by age of exposure
and type of examination.
Type of
examination N° of CTs
Age group (years)
<5 5-14 15-19 <20 N % N % N % N % Head/Neck 1 CT 2,504 74.7 1,934 51.3 661 26.1 5,099 52.8 2+ CTs 533 15.9 576 15.3 342 13.5 1,451 15.0 Abdomen/ Pelvis 1 CT 59 1.8 392 10.4 526 20.8 977 10.1 2+ CTs 94 2.8 565 15.0 763 30.1 1,422 14.7 Chest 1 CT 41 1.2 58 1.5 56 2.2 155 1.6 2+ CTs 44 1.3 35 0.9 42 1.7 121 1.3 Extremities 1 CT 13 0.4 68 1.8 30 1.2 111 1.1 2+ CTs 6 0.2 18 0.5 8 0.3 32 0.3 Spine 1 CT 7 0.2 32 0.8 28 1.1 67 0.7 2+ CTs 33 1.0 82 2.2 65 2.6 180 1.0 Angiography 1 CT 8 0.2 5 0.1 4 0.2 17 0.2 2+ CTs 8 0.2 5 0.1 8 0.3 21 0.2 All CTs All 3350 100.0 3770 100 2533 100.0 9653 100.0 All CTs 1 CT 2,632 78.6 2,489 66.0 1,305 51.5 6,426 66.6 2+ CTs 718 21.4 1,281 34.0 1,228 48.5 3,227 33.4
4. DISCUSSION
In the present study, we evaluated the patterns and trends of CT use among patients aged less than 20 years in a private hospital in the city of Rio de Janeiro between 2005 and 2015. These
examinations represented about 8% of all CT examinations in the study hospital over the period. Pediatric and young adult CT usage has almost tripled over the study period, with CT angiography showing the greatest increase within types of CT. Males had more exams than females. The most frequent type of CT examination was head/neck, followed by abdomen/pelvis. Children under 5 years had the highest increase in the overall number of CT examinations over time. One third of the patients did more than one CT examination in the hospital between 2005 and 2015, with the frequency of patients with multiple exams increasing with patient age. In our study, pediatric and young adult CT exams corresponded to about 8% of all CTs, which was lower than the 13% reported for outpatients of the Brazilian public healthcare system [19]. We may suggest that this might be due to the greater availability of other diagnostic imaging examinations in the private hospital, such as magnetic resonance imaging and ultrasound [22]. Indeed, pediatric and young adult CT represents between 8 to 20% of the total number of CT examinations in less developed countries in Africa and Asia [22,23]. Conversely, studies conducted in developed countries as France, Germany, Switzerland and Israel have reported proportions of pediatric CT of 1-3% [7,11,12,24], while in the United States, pediatric and young adult CT represented 7-11% of the total number of CT procedures in the period 1998-2007 [13,14].
Furthermore, access to the private healthcare in Brazil is obtained mainly as an additional employment benefit (almost 75% of all private health insurance policies in 2008 were employment based) [21]. Children and unemployed young adults might have more limited access to health insurance coverage if they were not dependent from an insured adult. Indeed, the health insurance coverage rate for people under 20 years of age in Rio de Janeiro is about 23%, which is lower than the proportion of this age group in the population (27%), while the opposite occurs for adults (77% of insured adults for 73% in general population) [21,25].
Several studies have reported that head/neck is the most frequent pediatric CT examination [3,7,19,26,27], while abdomen/pelvis is the most frequent examination among adults [3,26]. In our study hospital, head/neck was the most frequent CT examination for patients under 20 years old, except for patients aged 15-19 years old, for whom abdomen/pelvis was the most frequent CT exam. These results contrast with the pattern observed for SUS outpatients, for whom the head/neck is the most frequent imaged body region for all patients under 20 years of age [19]. These differences may reflect the earlier insertion of modern multi-slice CT scanners in the private setting
than in the public healthcare system. These modern scanners allow for rapid image acquisition reducing significantly total scan times for abdomen/pelvis examination, which is essential for pediatric imaging as it avoids child sedation [26]. Therefore, the introduction of modern CT scanner in the private setting allowed more pediatric abdomen/pelvis CT examinations. As total scan time for head CT is short and it is usually done without sedation, its usage was not greatly affected by the introduction of multi-slice CT scanners.
Boys presented more CT examinations than girls in the study hospital. This may be a consequence of higher trauma rates in association with boys than girls. Indeed, it has been reported that most CT scans among children and young adults are head examinations due to trauma [5,28], with boys being generally more prone to trauma than girls [23].
We observed an annual increase of 10% for all pediatric and young adult CT examinations performed between 2005 and 2015 in the study private hospital. The greatest increase was observed for the youngest patient group (<5 years old)). Conversely, in the public healthcare system CT use increased the most among the oldest group (15-19 years old) between 2008 and 2011 [19]. This difference might also be a result of the earlier insertion of more modern CT scanners in the private setting allowing easier and faster examinations of younger patients for all parts of the body. Also, infants with private insurance have considerably more visits to medical office and emergency room than do uninsured children. The greater accessibility of CT scanners in the private setting coupled with parents' anxiety to have the most accurate diagnosis through the most sophisticated examinations, may have contributed to the greater proportion of examinations performed in children under 5 years of age at the private study hospital.
The highest annual increase in CT use was observed for CT angiography, although number of procedures were small over the study period. This type of examination emerged in the 1990s. Through a combination of helical CT, graphical volumetric image processing and a series of technical innovations over the 5–15 subsequent years, CT angiography toppled conventional angiography, as the preferred modality for the diagnosis and characterization of most cardiovascular abnormalities [29]. Most applications of CT angiography in children involve assessment of congenital and postoperative vascular and cardiac diseases. The use of CT angiography offered the opportunity to eliminate the long periods of sedation associated with MR (Magnetic Resonance)
and reduce the radiation exposure associated with conventional angiography [30], which might explain its steepest increase in the most recent period.
There was a slight reduction of 3.6% in the number of CT from 2014 to 2015. The reason for this decline is unknown. It is early to say that this reflect a decreasing trend in CT usage, as reported for some developed countries [5,7,31,32]. While initiatives like Image Wisely [33] and Image Gently [34] campaigns were implemented in developed countries, resulting in greater attention to the use of appropriateness criteria for CT studies [4,9,10], no similar action has been implemented in Brazil and neither in the study hospital to reduce unnecessary CT examinations.
The proportion of patients that performed multiple CT examinations in the study hospital (33%) was similar to the values reported in the United Kingdom (29%) [15]. Number of patients with multiple exams increased with patient age, which is not surprisingly as older patients have more time to present symptoms or conditions that require a CT scan. Head/neck and abdomen/pelvis were the scanned body anatomical regions with the highest numbers of multiple examinations in the same patient. This is not surprisingly as these are the most common examinations in the study group. When considering patients that underwent abdomen/pelvis and spine CT, more than half of these patients performed multiple examinations. It can be explained by the fact that these body anatomical regions are segmented and the lack of standardization of protocols. One spine CT could be registered in RIS as three procedures, for example: cervical, thoracic and lumbar spine scans. Therefore, the assessment of multiple examinations for a given patient may have been overestimated. The same could have occurred for abdomen/pelvis, where one complete examination may have been registered as three different scans (upper abdomen, lower abdomen and/or pelvis).
Several studies have reported a significant increase in cancer risk after radiation exposure in the dose ranges delivered by multiple CT scans or tens of diagnostic radiographs [35,36,37]. In our study, head/neck CT is the type of examination which presented the highest proportion of multiple examinations in the same patient. As a single head CT can deliver cumulative absorbed doses of about 50 mGy in the brain and 60 mGy in the red bone marrow, these multiple head CT might be of great concern as an increased risk of brain tumor and leukemia have been reported for these dose ranges [5,35].
Our study has strengths and limitations. Strengths of this study includes the availability of a large amount of electronic data extracted from RIS of one important hospital in the city of Rio de Janeiro, for a long period of time, which contributed to a robust assessment of CT patterns and trends.
Limitations of our study include the lack of information regarding the patient's attendance status (inpatient or outpatient) which did not allow the evaluation of CT pattern by type of care. Also, our study used data from a single private hospital. Therefore, our results cannot be generalized to the general private healthcare setting and our comparison to the CT pattern in the Brazilian public healthcare is limited.
5. CONCLUSION
The use of CT in children and young adults in a general private hospital in the city of Rio de Janeiro almost tripled between 2005 and 2015. Head/neck was the main type of CT examination. One third of the patients had more than one CT examination. The proportion of pediatric and young adult exams in our study (8%) was lower than the 13% reported for outpatients of the Brazilian public healthcare system. The greater availability of other diagnostic imaging examinations in the private setting could have contributed to the lower frequency of pediatric and young adult CT in the study hospital.
The use of CT in children and young adults demands policies and actions that recognize and maximize the multiple health benefits that can be obtained, while at the same time minimize potential health risks. Benefits of imaging children must be weighed against the potential risks of radiation exposure. It is fundamental to implement the two principles of radiation protection for patients: justification and optimization. Existing imaging referral guidelines can be used to support justification and enhance appropriateness of referral.
The study added limited but important information about the pattern and trend of pediatric CT use in a private hospital in Brazil, which reinforces the need for initiatives to avoid unwarranted CT exposure.
We thank Alexandre Roque for his willingness and assistance in extracting RIS data from the study hospital.
REFERENCES
[1] METTLER, F.A. JR.; BHARGAVAN, M., FAULKNER, K. et al. Radiologic and nuclear medicine
studies in the United States and worldwide: frequency, radiadion dose, and comparison with other radiation sorces: 1950-2007. Radiology 253 (2): 520-531, 2009.
[2] METTLER F.A. JR.; BHARGAVAN, M., FAULKNER, K. et al. Radiology and Diagnostic Nuclear
Medicine: A Catalog. Radiology 248:254-263, 2008.
[3] LINET, M. S.; KIM, K.; RAJARAMAN, P. Children’s exposure to diagnostic medical radiation and
cancer risk: epidemiologic and dosimetric considerations. Pediatr Radiol (2009) 39 (Suppl 1):S4-S26. DOI 10.1007/s00247-008-1026-3
[4] LEVIN, D.C.; RAO, V.M.; PARKER, L. The recent downturn in utilization of CT: the start of a new
trend? J Am Coll Radiol, 9(11):795-8, 2012.
[5] MIGLIORETTI, D. L. et al. The use of computed tomography in pediatrics and the associated radiation
exposure and estimated cancer risk JAMA Pediatr. 167 700–7, 2013.
[6] BRADY, Z.; CAIN, T. M.; JOHNSTON, P. N. Paediatric CT imaging trends in Australia J. Med.
Imaging Radiat. Oncol, 55 132–42, 2011.
[7] CHODICK, G.; RONCKERS, C.; RON, E.; SHALEV, V. The utilization of pediatric computed
tomography in a large Israeli Health Maintenance Organization Pediatr. Radiol. 36 485–90, 2006.
[8] BRENNER. D.J.; ELLISTON, C.; HALL, E. et al. Estimated risks of radiation-induced fatal cancer from
pediatric CT. AJR Am J Roentgenol 176(2):289-296, 2001.
[9] SMITH-BINDMAN, R.; MIGLIORETTI, D.L.; JOHNSON, E.; LEE, C.; FEIGELSON, H.S.; FLYNN,
M. et al. Use of diagnostic imaging studies and associated radiation exposure for patients enrolled in large integrated health care systems, 1996-2010. JAMA; 307(22):2400-9, 2012.
[10] NHS. National Health Services. Total number of imaging and radiodiagnostic examinations or tests, by
imaging modality, England, 1995-96 to 2012-13 England, UK: NHS; 2013. Available at: <
http://www.england.nhs.uk/statistics/statistical-work-areas/diagnostic-waiting-times-and-activity/imaging-and-radiodiagnostics-annual-data.>. Last accessed: 25 Jun. 2017.
[11] BERNIER, M.O.; REHEL, H.J. et al. Radiation exposure from CT in early childhood: a French
large-scale multicentre study. Br J Radiol 85(1009):53-60, 2012.
[12] GALANSKI, M,; NAGEL, H. D.; STAMM, G. Results of a federation inquiry 2005/2006: pediatric CT
x-ray practice in Germany. Rofo, 179 1110–1, 2007.
[13] BERRINGTON DE GONZÁLEZ, A.; MAHESH, M.; KIM, K.P. et al. Projected cancer risks from
computed tomographic scans performed in the United States in 2007. Arch Intern Med 169 (22):2071-2077, 2009.
[14] METTLER, F. A. JR.; WIEST, P. W.; LOCKEN, J. A.; KELSEY, C. A. 200 CT scanning: patterns of
[15] PEARCE, M. S. et al 2012 CT scans in young people in Great Britain: temporal and descriptive patterns,
1993–2002 Radiol. Res. Pract. 594278, 2012.
[16] THOMAS, K.E. CT utilization--trends and developments beyond the United States' borders. Pediatric
Radiology. 2011;41 Suppl 2:562-6.
[17] MUHOGORA, W.E.; AHMED, N.A.; BEGANOVIC, A.; BENIDER, A.; CIRAJ-BJELAC, O.;,
GERSHAN, V. et al. Patient doses in CT examinations in 18 countries: initial results from International Atomic Energy Agency projects. Radiation Protection Dosimetry, 136(2):118-26, 2009.
[18] PEARCE, M.S. Patterns in paediatric CT use: an international and epidemiological perspective. J Med
Imaging Radiat Oncol, 55(2):107-9, 2011.
[19] DOVALES, A.C., et al., Patterns and trends of computed tomography usage in outpatients of the
Brazilian public healthcare system, 2001-2011. J Radiol Prot, 36(3): p. 547-560, 2016.
[20] MALTA, D. C. S.; PEREIRA, S. R.; AZEREDO, C.; SZWARCWALD, C. L.; OLIVEIRA, M.; REIS,
A. C, DOS. Cobertura de Planos de Saúde na população brasileira, segundo a Pesquisa Nacional de Saúde, 2013. Ciência & Saúde Coletiva, 22(1), 179-190, 2017.
[21] ANS - Agência Nacional de Saúde Suplementar (Health insurance regulatory agency in Brazil).
Available at: <http://www.ans.gov.br/anstabnet/cgi-bin/tabnet?dados/tabnet_tx.def>. Last accessed in: April 14, 2017.
[22] MUGOHORA WE, AHMED NA, ALSUWAIDI JS, BEGANOVIC A, CIRAJ-BJELAC O, GERSHAN
V, et al. Paediatric CT examinations in 19 developing countries: frequency and radiation dose. Radiation Protection Dosimetry. 2010;140(1):49-58.
[23] VASSILEVA J, REHANI MM, AL-DHUHI H, ALl-NAEMI HM, AL-SUWAIDI JS, APPALEGATE
K, et al. IAEA survey of pediatric CT practice in 40 countries in Asia, Europe, Latin America, and Africa: Part 1, frequency and appropriateness. AJR American Journal of Roentgenology. 2012;198(5):1021-31.
[24] AROUA A, BOUCHUD FO, VALLEY JF, VADER JP, VERDUN FR. Number of X-ray examinations
performed on paediatric and geriatric patients compared with adult patients. Radiation Protection Dosimetry. 2007;123(3):402-8.
[25] SUS Database [Internet]. Ministério da Saúde, Brasil. Available at:
< http://tabnet.datasus.gov.br/cgi/tabcgi.exe?ibge/cnv/popbr.def>. Last accessed in: April 14, 2017.
[26] GALANSKI M, NAGEL HD, STAMM G (2006) Paediatric CT exposure practice in the Federal
Republic of Germany—results of a nation-wide survey in 2005/2006. Hannover Medical School, Hannover, Germany.
[27] CRCPD (2007) Nationwide evaluation of x-ray trends (NEXT): tabulation and graphical summary of
2000 survey of computed tomography. Conference of Radiation Control Program Directors, Frankfort, KY.
[28] FRENN, K.A., HENDRCKSON, M., KHARBANDA, A. A. Reducing Pediatric CT Usage through
Web-Based Education. Radiology Management, 36(3):12-6; quiz 17-8, May-Jun 2014.
[29] GEOFFREY D. RUBIN, JONATHON LEIPSIC, U. JOSEPH SCHOEPF, DOMINIK
FLEISCHMANN, SANDY NAPEL. CT Angiography after 20 Years: A Transformation in Cardiovascular Disease Characterization Continues to Advance. Radiology: Volume 271: Issue 3, June 2014. Doi: https://doi.org/10.1148/radiol.14132232
[30] SIEGEL, M.J. Pediatric CT angiography. Eur Radiol. 2005 Nov;15 Suppl 4:D32-6.
[31] COLLINS, A. C, MOLCHO, M., CARNEY, P., McEVOY, L., GEOGHEGAN, L., PHILLIPS, J. P.,
NICHOLSON, A.J.. Are boys and girls that different? An analysis of traumatic brain injury in children. Emerg Med J, 2013;30:675–678. doi:10.1136/emermed-2011-200496.
[32] TOWNSEND, B.A., et al., Has pediatric CT at children's hospitals reached its peak? AJR Am J
Roentgenol, 2010. 194(5): p. 1194-6. BRADY, Z., T.M. Cain, and P.N. Johnston, Paediatric CT imaging trends in Australia. J Med Imaging Radiat Oncol, 2011. 55(2): p. 132-42.
[33] BRINK JA, AMIS ES, Jr. Image Wisely: a campaign to increase awareness about adult radiation
protection. Radiology. 2010;257(3):601-2.
[34] GOSKE MJ, APPALGATE KE, BULAS D, BUTLER PF, CALLAHAN MJ, COLEY BD, et al. Image
Gently: progress and challenges in CT education and advocacy. Pediatric Radiology. 2011;41 Suppl 2:461-6.
[35] PEARCE, M.S., SALOTTI, J.A., LITLLE, M.P., McHUGH, K., LEE, C., KIM, K.P., et al. Radiation
exposure from CT scans in childhood and subsequent risk of leukaemia and brain tumours: a retrospective cohort study. Lancet. 2012;380(9840):499-505.
[36] EINSTEIN A.J., Effects of radiation exposure from cardiac imaging: how good are the data? J Am Coll
Cardiol. 2012; 59: 553–65.
[37] BOICE, J.D. Jr, PRESTON, D., DAVIS, F.G., MONSON, R.R., Frequent chest x-ray fluoroscopy and