DEPARTAMENTO DE BIOLOGIA ANIMAL
African Marine Invertebrate Data Analysis and Imaging: a Dataset
and Digital Platform for Research, Education and Outreach
Henrique Martins Espada Niza
Mestrado em Bioinformática e Biologia Computacional
Dissertação orientada por:
Acknowledgments and Dedications
It is with great joy and pleasure that I express my gratitude for the unconditional support and dedication of those involved in the realization of this dissertation, without whom none of this would be possible. To my two dissertation advisors, Alexandra Marçal Correia and Luís Filipe Lopez, I wish to thank you for being such great supporters throughout this entire project. They've made a point of helping in every way possible, and not once were they too busy to assist, no matter the subject.
To my colleague and working partner Marta Bento for being a lovely person, always willing to help, and a pleasure to work with.
To Alexandra Cartaxana for the sympathy and support given with her knowledge of the biological aspect of this project.
To Leonor Brites Soares and David Harper for providing essential assistance throughout the entire geocoding process.
To Luiz Coutinho for providing much-needed support in the field of GIS and web mapping.
To all the Master course professors and coordinators Octávio Paulo, Francisco Couto and Francisco Dionísio, through their lectures, direct or indirectly, gave me the basic knowledge to carry out this work. My accomplishments have not been mine alone, and over the years I have been encouraged, inspired, sustained and tolerated by some very important people in my life. I wouldn't have written these words if it wasn't for them. I'm dedicating this dissertation to all of them.
To my mother Helena and (late) father Carlos for their unconditional love and continued support throughout my whole life. They are the main reason I’m where I am right now.
To my best friend and brother Carlos Miguel for putting up with me and being there for me throughout not only this entire Master course, but also in everything else.
To my girlfriend Margarida for understanding and listening to my concerns and my outbursts, as well as her support and patience throughout this whole year.
To all my friends for their support and understanding, with particular appreciation to my friend Raquel, whose work ethic inspires me to be better every day.
It was a very intense year, full of challenges but it was much easier to overcome having great people like you, who supported and guided me through it all. Even though this work bears my name, it has a portion of all of you.
Abstract
The quantity of biological data accessible in online repositories is exponentially growing, thus computer science methods are required for its management and analysis. Online, digital repositories are useful instruments for biodiversity research, as they provide fast access to data from different sources. Among these, large contributors are museums that hold a vast quantity of specimens in their collections. This dissertation was developed as part of the COBIO-NET project, funded by FCT/AGA KHAN Foundation, and its goals were to create a comprehensive dataset on the marine coastal biodiversity of decapod crustaceans through different habitats in Mozambique and São Tomé and Príncipe, and to use digital tools to disseminate the compiled information online, so that its available to the scientific community and the general public. These digital tools have been used to aggregate, georeference and clean up global biodiversity data retrieved from online digital repositories, biodiversity data and scientific literature into a detailed dataset; to manage and structure biodiversity data for the compilation of biological studies through a relational database management system; to manage and process data through, also to show the acquired spatial data in the geographic information system QGIS and an interactive web map.
In this dissertation, a metadata structure was defined, which will be further used to store data collected during the COBIO-NET project. This metadata structure includes 26 fields defined by the Darwin Core metadata standard. A pilot dataset, based on this metadata structure was compiled, including 7486 decapod crustaceans occurrences records in Mozambique and São Tomé and Príncipe.
The database PostgreSQL constructed during this study is the digital support to manage and process information on decapod crustaceans from Mozambique and São Tomé and Príncipe. The data from the database can be filtered through queries, and this database is ready to be updated by researchers enrolled in COBIO-NET with more data from different marine invertebrate taxonomic groups.
The QGIS map design provides maps to visualize decapod crustacean occurrences, offering the foundation for the analysis of species incidence and allocation information. The map project is prepared in a way that it can be used to display information on larger datasets, including information on other marine taxonomic groups added during the COBIO-NET project.
A web map was constructed using Leaflet and is an interactive digital platform, that allows the visualization of decapod crustacean occurrences through mangroves, seagrasses, corals and other coastal areas of Mozambique and São Tomé and Príncipe. The web map provides distinct filters concentrations to manipulate the data, allowing visualization of occurrences events according with specific demands.
A dataset of biodiversity data, representing occurrence records, was compiled and the digital tools developed during this study will be published and disseminated through online digital repositories, that can be used in future studies to model crustacean species allocation studies. To evaluate species communities in an effort to estimate their probability of extinction and to preserve biodiversity. These data as well as the digital tools, and their following publication further adds and promotes our current knowledge on biodiversity of marine crustaceans in mangroves, seagrasses, corals and other coastal areas of Mozambique and São Tomé and Príncipe.
Resumo
As espécies costeiras e marinhas e os seus respectivos habitats estão a ser adversamente perdidos ou danificados, reduzindo significativamente a biodiversidade marinha. Os invertebrados marinhos, incluindo crustáceos decápodes, constituem importantes fontes de alimento para as populações locais, especialmente para pessoas mais pobres, que dependem destes recursos para sustento e alimentação. Moçambique e São Tomé e Príncipe abrigam um grande número de espécies decápodes indígenas, que são usadas pelas populações locais para a sua subsistência e segurança alimentar.
Existe uma grande quantidade de dados valiosos sobre a biodiversidade do mundo, armazenados em Coleções de História Natural, repositórios digitais, programas de vigilância climática, projetos de investigação e outros, que estão disponíveis para pesquisa. Em particular, as Coleções de História Natural albergam informação muito relevante para estudos de biodiversidade, incluindo séries espaciais e temporais, na medida em que são desenvolvidas desde o século XIX, e têm sido usadas em numerosos estudos, desde taxonómicos e sistemáticos até distribuição espacial e temporal e composição populacional.
A quantidade de dados acessíveis online cresce diariamente e desta forma, métodos e técnicas das ciências da computação são essenciais para a gestão e análise dos mesmos. Os repositórios online são instrumentos úteis na pesquisa sobre biodiversidade, pois fornecem acesso rápido aos dados de enumeras coleções. Vários museus, organizações e universidades processam informações das suas coleções em diversas bases de dados digitais que disponibilizam em repositórios na internet. Um desses repositórios de dados é o Global Information Facility for Biodiversity (GBIF). O modelo de metadados
Darwin Core (DwC), é usado pelo GBIF com o intuito de partilhar informação padronizada sobre
biodiversidade, e desempenha um papel fundamental na interoperabilidade e integração destes dados. Esta dissertação faz parte do projeto COBIO-NET – Coastal biodiversity and food security in
peri-urban Sub-Saharan Africa: assessment, capacity building and regional networking in contrasting Indian and Atlantic Ocean, financiado pela fundação FCT/AGA KHAN. O objetivo desta seção do
projeto COBIO-NET é compilar conjuntos de dados de crustáceos decápodes, e informação associada, de Moçambique e São Tomé e Príncipe por meio da catalogação em um conjunto de dados e base de dados organizados em DwC, e torná-los acessíveis através de repositórios e de mapas interativos online. Neste contexto, o principal objetivo da dissertação foi a construção de um conjunto de dados e o uso de ferramentas digitais para compilar informações a fim de criar um conjunto de dados abrangente sobre crustáceos decápodes e respetivos habitats nas zonas costeiras de Moçambique e São Tomé e Príncipe. O trabalho foi repartido em 4 partes: 1) recolha de dados mundiais sobre biodiversidade em repositórios digitais globais relacionados com Coleções de História Natural, outros dados de biodiversidade e literatura científica para a construção de um conjunto de dados; 2) gestão e processamento de dados sobre biodiversidade a partir da compilação de estudos biológicos por meio de um sistema de gestão de bases de dados relacional (SGBDR) de código aberto; 3) armazenamento e representação de eventos e distribuição de dados geográficos na ferramenta de um sistema de informação geográfica de código aberto; 4) disseminação de dados online através da criação de um web map interativo usando uma biblioteca JavaScript de web mapping de código aberto.
Nesta dissertação, a estrutura dos metadados é a base do projeto COBIO-NET, que será usada para armazenar os dados de invertebrados marinhos obtidos durante o projeto. O conjunto de dados piloto desenvolvido durante esta dissertação, apresenta um layout com 26 campos Darwin Core, e contém um conjunto de dados referente a 7486 ocorrências de crustáceos decápodes em mangais, pradarias marinhas, corais e outras áreas costeiras de Moçambique e São Tomé e Príncipe. Este modelo
de metadados é adequado para a recolha de informação pré-estruturada de acordo com o formato de dados usado pelo GBIF.
Ferramentas digitais tais como o software Open Refine e a linguagem de programação Python foram usadas para criar um conjunto de dados, através da compilação e limpeza de dados de ocorrências de biodiversidade obtidos a partir de repositórios digitais, dados obtidos diretamente de outras fontes e literatura científica, agregados em um conjunto de dados detalhado. De forma a poder realizar uma análise geográfica, é necessário que os dados incluam os locais de recolha na forma de coordenadas espaciais. Nos casos em que os registos obtidos não incluíam esta informação, a georreferenciação foi feita utilizando o software GEOLocate.
A base de dados PostgreSQL construída durante este estudo é o suporte digital usado para gerir e processar informações sobre crustáceos decápodes de Moçambique e São Tomé e Príncipe. Os dados da base de dados podem ser filtrados por meio de consultas e a base de dados pode ser atualizada pelos investigadores do COBIO-NET com mais dados referentes a outros grupos taxonómicos de invertebrados marinhos.
O QGIS foi o sistema de informação geográfica de código aberto utilizado para visualizar, processar e avaliar os dados e informações geográficas recolhidas. A avaliação geográfica, usando o
QGIS, envolveu vários passos, como processamento de informações geográficas, mapeamento de
diferentes habitats, combinação de camadas de informação e personalização da simbologia existente. O
design do mapa QGIS foi projetado especificamente para o projeto COBIO-NET, oferecendo uma base
para analisar informações sobre incidência e alocação de espécies. O projeto de mapeamento em QGIS permite a sua aplicação a outros conjuntos de dados mais amplos, incluindo informação sobre outros invertebrados marinhos.
O plugin qgis2web para o QGIS foi utilizado para produzir um mapa interativo em JavaScript, tornado público na internet, personalizado através da biblioteca Leaflet que permite visualizar as ocorrências das espécies de crustáceos decápodes. O mapa fornece vários filtros para manipular os dados, permitindo a visualização de ocorrências de acordo com critérios específicos. Este mapa inclui 18 camadas que podem ser escolhidas ou não para filtrar as informações visualizadas, e são categorizadas em (1) ocorrência de espécies, (2) habitat, (3) áreas dos países e (4) zonas costeiras globais.
Ao longo desta dissertação, foram usadas várias ferramentas e técnicas, que apresentaram vários desafios. A limpeza e validação de nomes científicos no conjunto de dados de biodiversidade foi um deles. O campo da taxonomia está em constante mudança, dificultando a compreensão de quais termos descritos correspondem ao nosso conhecimento contemporâneo de uma espécie em particular. As limitações também se estendem aos shapefiles de habitat usados neste estudo. A maioria dos conjuntos de dados possui cobertura global e foi compilada a partir de várias fontes de dados de qualidade e a escalas variadas para as quais a interpretação da imagem foi realizada. Outra limitação foi o mapa em
JavaScript gerado com o plugin qgis2web no QGIS. Embora o plugin possa simular muitos elementos
do QGIS, incluindo símbolos e estilos de camada, não consegue replicar aspetos mais complexos. Os dados recolhidos no conjunto de dados podem ser partilhados através de repositórios online, a fim de serem usados, por exemplo, em estudos de distribuição de espécies e avaliar a composição de comunidades ecológicas distintas, para estimar a probabilidade de extinção e preservação da biodiversidade.
Outra aplicação deste trabalho é permitir a criação de uma coleção de dados de referência alargada a outros invertebrados marinhos de Moçambique e São Tomé e Príncipe, que seja
disponibilizada à comunidade científica e ao público em geral de forma a dar a conhecer a biodiversidade e história natural destes países africanos.
Uma das ideias do projeto COBIO-NET é gerir e centralizar todos os conjuntos de dados de biodiversidade produzidos durante o projeto e a documentação associada com recursos a ferramentas multimédia, num repositório digital. Este repositório será usado para disseminar as informações e dados reunidos para a comunidade científica e o público em geral. Portanto, o conjunto de dados, mapas QGIS e mapas interativos produzidos durante esta dissertação serão incluídos no repositório digital COBIO-NET para maior disseminação da informação a investigadores e sociedade em geral.
Além disso, as caraterísticas do conjunto de dados desenvolvido, que integra um conjunto de dados de biodiversidade de invertebrados marinhos estruturado em DwC, a base de dados, os mapas e o mapa online serão publicados em artigos científicos, data papers e repositórios digitais (GBIF e COBIO-NET) no âmbito do COBIO-NET, em colaboração com outros investigadores do projeto. Adicionalmente, ao serem disponibilizados ao público, estes dados e ferramentas digitais podem ser usados por outros utilizadores como ferramentas de ensino ou divulgação, para escrever livros, artigos científicos, folhetos de divulgação, etc.
Os crustáceos decápodes são elementos relevantes da dieta e meios de subsistência das populações locais de Moçambique e São Tomé e Príncipe. Neste contexto, os resultados obtidos nesta dissertação são relevantes na medida em que podem ser usados para ligar o conhecimento destes recursos naturais ao seu valor gastronómico nestes dois países, bem como aos Objetivos de Desenvolvimento Sustentável (ODS) das Nações Unidas, a saber, o ODS #2 (Erradicar a fome), que visa acabar com a fome, alcançar a segurança a alimentar e melhorar a nutrição; e o ODS #14 (Proteger a vida marinha), que se refere à biodiversidade marinha e costeira, sua conservação e uso sustentável para um desenvolvimento sustentável da sociedade humana.
Table of Contents
List of Figures ... xi
List of Tables ... xiii
List of Abbreviations ... xiv
1. INTRODUCTION ... 1
1.1. BIODIVERSITY DATASET CONSTRUCTION ... 2
1.2. DATA MANAGEMENT ... 4
1.3. GEOGRAPHIC DATA REPRESENTATION ... 5
1.4. ONLINE DATA DISSEMINATION ... 5
1.5. OBJECTIVES ... 6
1.6. DISSERTATION ONLINE ... 7
2. METHODOLOGY ... 8
2.1. BIODIVERSITY DATASET CONSTRUCTION ... 9
2.1.1. Data Structuring ... 9
2.1.2. Data Compilation ... 10
a) NHC records ... 10
b) Online Digital Repositories ... 11
c) Scientific Literature ... 11 2.1.3. Data Geocoding ... 12 a) Uploading Data ... 13 b) Geocoding Data ... 14 2.1.4. Data Quality ... 15 a) Data Cleaning ... 15 b) Data Transformation ... 16 c) Data Extension ... 17 2.1.5. Coding ... 17 a) getData.py ... 18 b) previousName.py ... 18 c) taxonInfo.py ... 19 d) coordDec.py ... 19 e) matchShape.py ... 20 2.2. DATA MANAGEMENT ... 21 2.2.1. PostgreSQL ... 21
2.3. GEOGRAPHIC DATA REPRESENTATION ... 23
2.3.1. QGIS ... 23 a) Data Processing ... 23 b) Habitat Layers ... 23 c) Merging Layers ... 26 d) Background Layers ... 26 e) PostGIS Layers ... 26 f) Symbology ... 27
2.4. ONLINE DATA DISSEMINATION ... 28
2.4.1. Leaflet ... 28
a) Customization ... 29
2.5. DATA ANALYSIS ... 29
3. RESULTS ... 30
3.1. BIODIVERSITY DATASET CONSTRUCTION ... 30
3.2. DATA MANAGEMENT ... 36
3.4. ONLINE DATA DISSEMINATION ... 38 3.4.1. Species Occurrences ... 39 3.4.2. Habitats ... 40 3.4.3. Country Boundaries ... 41 3.4.4. Appearance ... 42 3.4.5. Online Access ... 43 4. DISCUSSION ... 44
4.1. BIODIVERSITY DATASET CONSTRUCTION: DEVELOPMENT OF A DATASET OF MOZ AND STP DECAPOD CRUSTACEANS ... 44
4.1.1. Limitations to the development of the dataset ... 44
4.1.2. Different approaches to the used methodology ... 46
4.2. DATA MANAGEMENT: USING THE POSTGRESQLRDBMS ... 47
4.2.1. Limitations of the PostgreSQL RDBMS ... 47
4.2.2. Different approaches to the used methodology ... 48
4.3. GEOGRAPHIC DATA REPRESENTATION: MAPPING WITH QGIS ... 48
4.3.1. Limitations of the shapefiles data ... 48
4.3.2. Different approaches to the used methodology ... 49
4.4. ONLINE DATA DISSEMINATION: WEB MAPS FOR GEOGRAPHIC VISUALIZATION ... 49
4.4.1. Limitations of the online data dissemination instruments ... 49
4.4.2. Different approaches to the used methodology ... 50
4.5. APPLICATIONS OF THE DEVELOPED DIGITAL TOOLS ... 50
4.6. LONG-TERM GOALS AND PERSPECTIVES ... 52
5. REFERENCES ... 54 6. ANNEXES ... 62 6.1. DATA SOURCES ... 62 6.2. CODE SCRIPTS ... 76 6.2.1. getData.py ... 76 6.2.2. previousName.py ... 78 6.2.3. taxonInfo.py ... 80 6.2.4. coordDec.py ... 82 6.2.5. matchShape.py ... 83 6.2.6. PostgreSQL ... 87 6.2.7. Leaflet ... 88
List of Figures
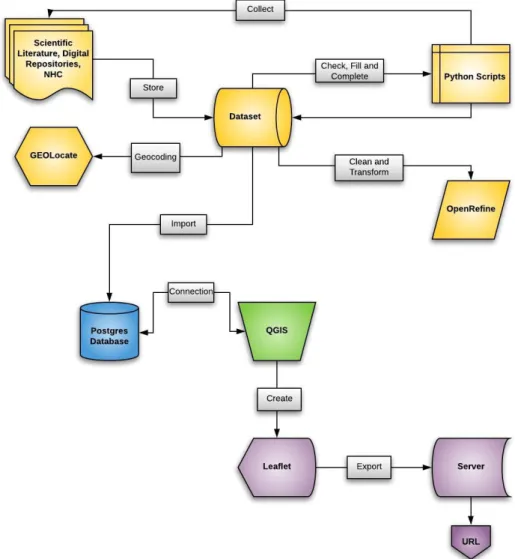
FIGURE 2.1–WORKFLOW OF THE STUDY PROJECT, DEPICTING THE MAIN TASKS OF 1) DATA COLLECTION IN YELLOW,
2) DATA MANAGEMENT IN BLUE,3) DATA REPRESENTATION IN GREEN AND 4) DATA DISSEMINATION IN PURPLE
(CREATED USING THE LUCIDCHART WEB-BASED APPLICATION). ... 8
FIGURE 2.2 – GBIF WEBSITE WITH A DESCRIPTIVE SEARCH CONDUCTED UNDER GET DATA, OCCURRENCES SUBMENU (GBIF.ORG,2018). ... 11
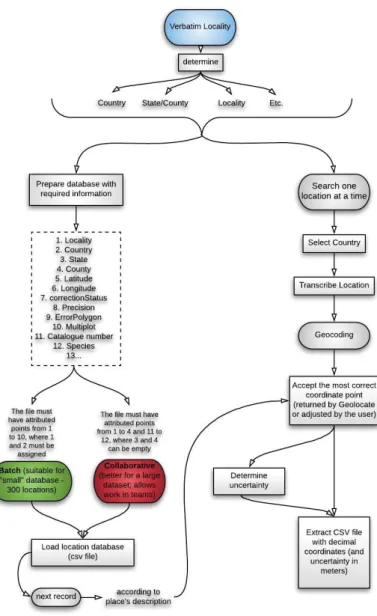
FIGURE 2.3–WORKFLOW OF HOW TO GEOCODE DATA IN GEOLOCATE DIRECTLY FROM THE WEB BROWSER, USING AVAILABLE WEB-BASED CLIENTS (ADAPTED FROM SOARES,2019; CREATED USING THE LUCIDCHART WEB -BASED APPLICATION). ... 13
FIGURE 2.4–WEB-BASED DATA MANAGEMENT PORTAL FOR MAPPING FIELDS IN DATA SOURCE.REQUIRED FIELDS ARE INDICATED IN DARK GREY. MATCHING FIELD ARE MAPPED WITH AUTO-MAPPING (COGE.GEO -LOCATE.ORG,2019). ... 14
FIGURE 2.5–CORRECTION DEPICTED WITH THE “MEASURE” TOOL. THE LOCATION OF THE GREEN MARKER WAS DRAGGED AND DROPPED IN THE DESIRED LOCATION.THE “CORRECT” BUTTON SAVES THE CORRECTIONS AND MOVES TO THE NEXT UNCORRECTED LOCALITY (GEO-LOCATE.ORG,2019). ... 14
FIGURE 2.6–PART OF THE “TEXT FACET” FUNCTION FOR THE LOCALITY COLUMN. ... 16
FIGURE 2.7–PART OF THE “CLUSTER” FUNCTION FOR THE LOCALITY COLUMN. ... 16
FIGURE 2.8&2.9–BIOVEL PATH COMMAND AND SETTINGS. ... 17
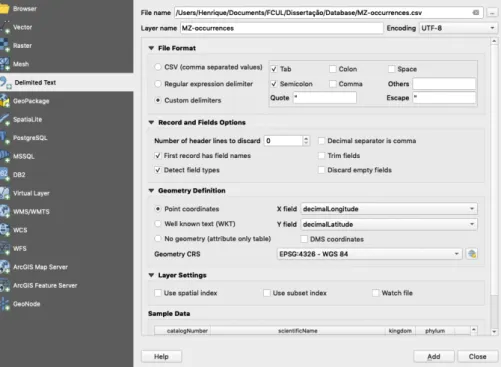
FIGURE 2.10–DEPICTION OF AN INPUT USED IN THE “ADD DELIMITED TEXT LAYER” SUB-MENU. ... 23
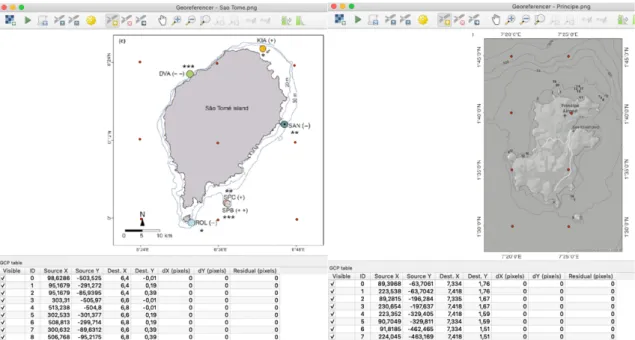
FIGURE 2.11&2.12–QGISGEOREFERENCER INTERFACE USING TWO RASTER DATA COLLECTED FROM LITERATURE WITH MANGROVE HABITATS (IDENTIFIED BY THE COLORED CIRCLES IN THE LEFT IMAGE AND THE NUMBERS IN THE RIGHT IMAGE).RASTER GROUND CONTROL POINTS ARE MARKED AS RED DOTS. ... 25
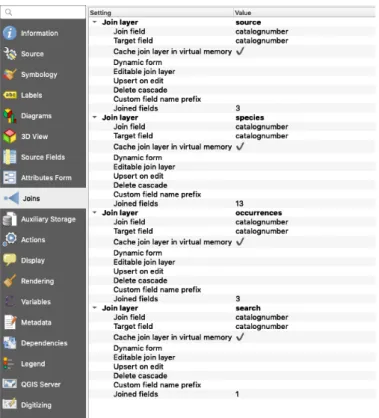
FIGURE 2.13 – ATTRIBUTE TABLES: OCCURRENCES, SPECIES AND SOURCE JOINED TO THE VECTOR LAYER: LOCATION. ... 27
FIGURE 2.14–SPECIES OCCURRENCES LAYER SYMBOLOGY. ... 27
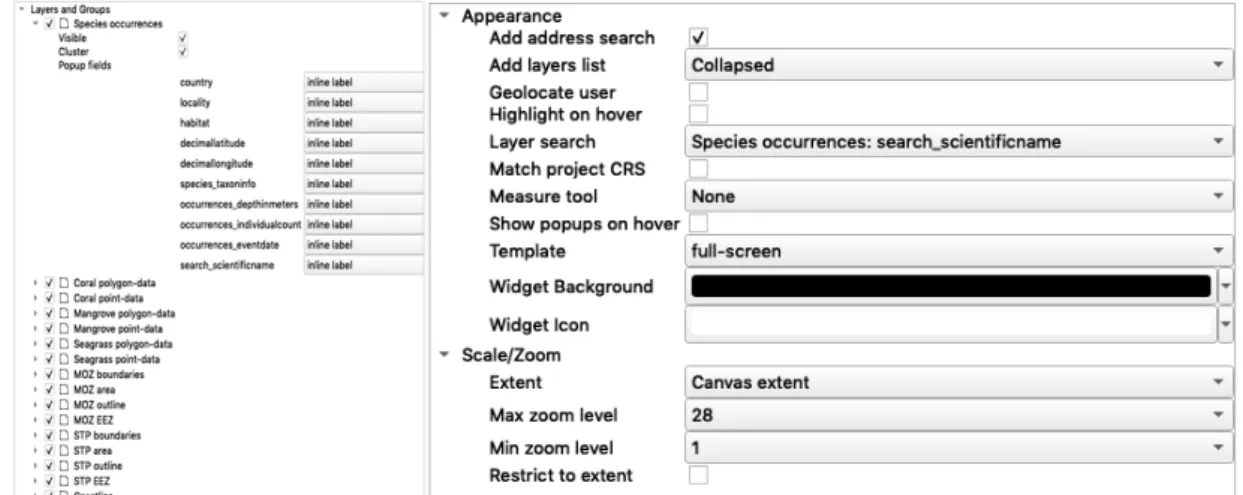
FIGURE 2.15&2.16–LEAFTLET WEB MAP SETTINGS ON LAYERS, GROUPS, APPEARANCE, SCALE AND ZOOM. ... 28
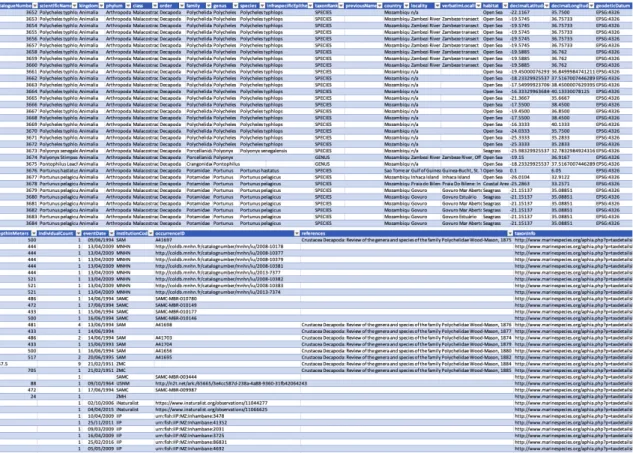
FIGURE 3.1–DATASET SECTION SHOWING ITS STRUCTURE WITH THE ATTRIBUTE COLUMN TERMS AND OCCURRENCES EXAMPLES. ... 30
FIGURE 3.2–REPRESENTATIVE SOURCES BY NUMBERS AND PERCENTAGES. ... 31
FIGURE 3.3–TOP 5 MOST REPRESENTED INSTITUTIONS SOURCES IN THE DATASET. ... 31
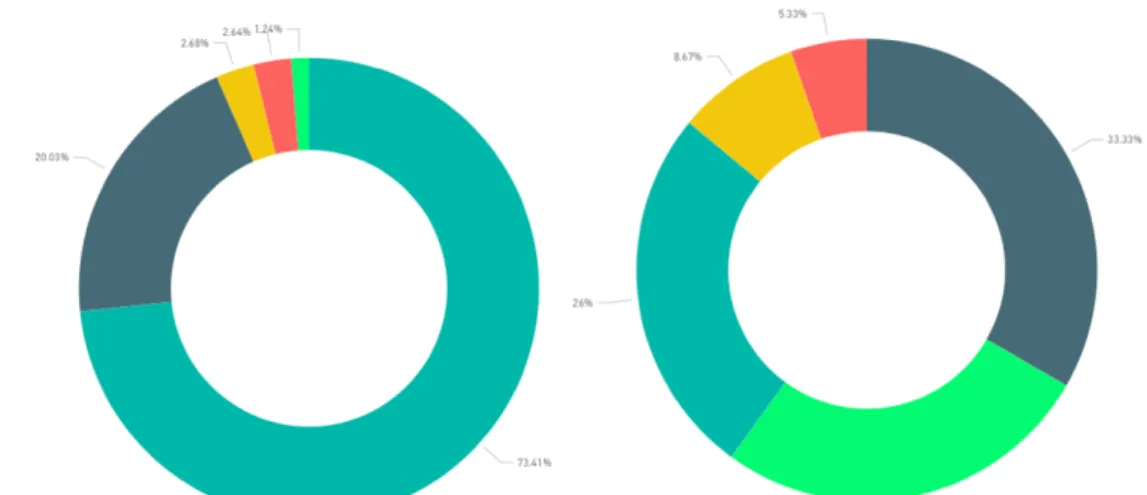
FIGURE 3.4–OVERALL PERCENTAGE OF SPECIES OCCURRENCES BY HABITAT TYPE. ... 32
FIGURE 3.5–PERCENTAGE OF SPECIES OCCURRENCES PER HABITAT TYPE IN MOZ AND STP, RESPECTIVELY. ... 32
FIGURE 3.6–TOP 6 MOST REPRESENTED FAMILIES IN BOTH COUNTRIES WITH GREATER THAN OR EQUAL TO 100 OCCURRENCES. ... 33
FIGURE 3.7–TOP 8 MOST REPRESENTED FAMILIES IN STP WITH GREATER THAN OR EQUAL TO 5 OCCURRENCES. 33 FIGURE 3.8–TOP 8 MOST REPRESENTED SPECIES OCCURRENCES IN MOZAMBIQUE AND SÃO TOMÉ AND PRÍNCIPE WITH GREATER THAN OR EQUAL TO 100 OCCURRENCES. ... 34
FIGURE 3.9–TOP 7 MOST REPRESENTED SPECIES OCCURRENCES IN SÃO TOMÉ AND PRÍNCIPE WITH GREATER THAN OR EQUAL TO 5 OCCURRENCES. ... 34
FIGURE 3.10–TOP 6 MOST REPRESENTED SPECIES BY INDIVIDUAL NUMBERS IN MOZAMBIQUE AND SÃO TOMÉ AND PRÍNCIPE WITH GREATER THAN OR EQUAL TO 1000. ... 35
FIGURE 3.11–TOP 9 MOST REPRESENTED SPECIES BY INDIVIDUAL NUMBERS IN MOZAMBIQUE AND SÃO TOMÉ AND PRÍNCIPE WITH GREATER THAN OR EQUAL TO 15. ... 35
FIGURE 3.12–POSTGRESQLRDBMS BROWSER WITH THE MANAGEMENT TOOL PGADMIN. ... 36
FIGURE 3.13–PART OF RESULT-SET FROM A SELECT QUERY. ... 37
FIGURE 3.14 – GRAPHICAL OUTPUT OF QUERY ON A GEOMETRY COLUMN DISPLAYED AGAINST AN OPENSTREETMAP. ... 37
FIGURE 3.15–QGIS PROJECT DISPLAYING ALL LAYERS ASSIGNED TO SÃO TOMÉ AND PRÍNCIPE AND MOZAMBIQUE. ... 38
FIGURE 3.17–WEB MAP ZOOMED IN MOZAMBIQUE, SHOWING THE USE OF DIFFERENT SYMBOLS ACCORDING WITH SPECIMEN TYPOLOGY. ... 40 FIGURE 3.18–ILLUSTRATION OF THE THREE TYPES OF HABITATS IN THE COAST OF MOZAMBIQUE REPRESENTED IN THE
WEB MAP BY POLYGON-DATA: CORAL, MANGROVE AND SEAGRASS, RESPECTIVELY.
... 40
FIGURE 3.19 – ILLUSTRATION OF THE THREE TYPES OF HABITATS IN THE COAST OF SÃO TOMÉ AND PRÍNCIPE REPRESENTED IN THE WEB MAP BY POINT-DATA: CORAL IN RED, MANGROVE IN GREEN AND SEAGRASS IN BLUE. 41 FIGURE 3.20–REPRESENTATION OF THE BOUNDARIES OF SÃO TOMÉ AND PRÍNCIPE (LEFT) AND MOZAMBIQUE (RIGHT).
... 41
FIGURE 3.21–WEB MAP DEFAULT APPEARANCE AND SCALE/ZOOM. ... 42 FIGURE 3.22–REPRESENTATION OF THE SEARCH SHOWING THE SUGGESTIONS FOR THE NAME AND THE RED CIRCLE INDICATING THE RESULT ON THE WEB MAP. ... 42
FIGURE 4.1–RECONCILING FUNCTION UNDER COLUMN HEADER → RECONCILE → START RECONCILING (PAGE,
2012). ... 46 FIGURE 4.2–RESULT OF RECONCILING NAMES LINKED TO UBIO (PAGE,2012). ... 47
FIGURE 4.3–QGIS PROJECT LAYERS MENU DEPICTING GROUPED LAYERS IN 6 GROUPS:OCCURRENCES,CORAL,
MANGROVE,SEAGRASS,MOZ AND STP ... 49
FIGURE 4.4–QUERY OUTPUT DISPLAYED IN A SQLWINDOW. ... 51
FIGURE 4.5 – MAP OBTAINED; GRADUATED SYMBOLOGY BY METHOD COLOR AND SIZE DEFINED BY FIELD INDIVIDUALCOUNT; THE SIZE OF THE CIRCLES REPRESENTS THE INDIVIDUALCOUNT FIELD AND THE COLOR REPRESENTS THE DEPTHINMETERS FIELD (DARKENS WITH DEPTH). ... 51
FIGURE 4.6–TIMEMANAGER TOOLBAR IN QGIS DATA WINDOW.THE SETTINGS BUTTON IS USED TO ACCESS THE LAYER SELECTION OPTION.THE SCROLL BUTTONS AND SLIDER ENABLE NAVIGATION THROUGH THE DATA SPECIES OCCURRENCES, THROUGH YEARS 1921 TO 2017. ... 52
List of Tables
TABLE 1.1–TYPE OF ERRORS THAT CAN BE FOUND IN DATA QUALITY ASSESSMENTS (CHAPMAN,2005). ... 3
List of Abbreviations
% Percentage
1:10m 1 centimeter on the screen is 100 kilometers in the real world AToL Assembling the Tree of Life
API Application Programming Interface
CRS Coordinate Reference System
CSV Comma-separated values
DMS Degrees, Minutes and Seconds
DOI Digital Object Identifier
DwC Darwin Core Metadata Model
EEZ Exclusive Economic Zone
EML Ecological Metadata Language
EoL Encyclopedia of Life
EPSG European Petroleum Survey Group GBIF Global Biodiversity Information Facility
GIS Geographic Information System
gni Global Names Index
GPS Global Positioning System
GREL General Refine Expression Language HTML Hypertext Markup Language
iDigBio Integrated Digitized Biocollections IIP National Institute of Fisheries Research INBO Institute for Nature and Forest
ITIS Integrated Taxonomic Information System MNHN Muséum national d'Histoire naturelle
MOZ Mozambique
MSSQL Microsoft SQL Server
MUHNAC Museu Nacional de História Natural e da Ciência de Lisboa NCBI National Center for Biotechnology Information
NHC Natural History Collection NHMUK Natural History Museum, London NRM Swedish Museum of Natural History OBIS Ocean Biogeographic Information System ODBC Open Database Connectivity
OGC Open Geospatial Consortium
RDBMS Relational Database Management System RMCA Royal Museum for Central Africa
SAM Iziko South African Museum SAMC Iziko South African Museum SDG Sustainable Development Goals
SQL Structured Query Language
STP São Tomé and Príncipe
SVG Scalable Vector Graphics
TDWG Biodiversity Information Standards
UN United Nations
URL Uniform Resource Locator
USNM Smithsonian National Museum of Natural History
WCS Web Coverage Service
WFS Web Feature Service
WGS World Geodetic System
WMS Web Map Service
WoRMS World Register of Marine Species
ZMC Zoologisk Museum Copenhagen
ZMH Zoological Museum Hamburg
1. Introduction
The growth of human populations within coastal areas has increased due to rural-urban migration, with people relocating to more urbanized and economic centers. This migration increases human pressure on the environment due to land and marine-based human activities. Nearshore habitats are of great socio-economic significance, especially in the western Indian Ocean, since 65 million people live within 10 km of the coast in the greater Indian Ocean region (Burke et al., 2011). As a result, coastal and marine living resources and their habitats are being adversely lost or damaged reducing marine biodiversity. Marine invertebrates, including decapod crustaceans, comprise important food sources for local populations, especially for the poorest people, that depend on these resources for their livelihoods and food security.
Among crustaceans (Phylum Arthropoda, Subphylum Crustacea), the order Decapoda is the largest with nearly 15,000 extant species and approximately 3.000 genera (De Grave et al., 2009). The decapod crustaceans include diverse living species that inhabit a wide variety of habitats (Mantelatto and Sousa, 2000). Mozambique (MOZ) and São Tomé and Príncipe (STP), respectively on the eastern and weastern coastlines of Africa, are home to a large number of indigenous decapod species. The species present in both countries belong to a significant part of all classified families of decapods, with over 100 families present of 180 classified families (De Grave et al., 2009; Emmerson, 2016). Brachyuran crabs alone have over 7,000 extant species and over 400 species have been identified as inhabiting the Western Indian Ocean (WIO) (Ng et al., 2008). Decapods are of high commercial, gastronomic and ecological importance (Silva et al., 2004; Almeida et al., 2008). For instance, a third of MOZ’s population lives along the coast and depends on resources in those areas to sustain their livelihoods (Francis and Torell, 2004). Decapods are used as food source all over the world and are one of Mozambique’s main fishery products. Deep and shallow water species are targeted by fleets which work in three sectors: 1) artisanal, 2) semi-industrial and 3) industrial. Artisanal catches from mangroves are of high importance since most coastal adult population is employed in fisheries (Hutchinson et al., 2014). The fisheries sectors in STP, on the other hand, are shaped mainly by traditional, small-scale fishing activities, built exclusively by the resources available in the country national waters, particularly those closest to shorelines. A situation that is common to most African fisheries, because of insufficient capital for investments in the fishery sector (Heck et al., 2007).
Digital repositories are valuable tools in biodiversity studies, since they provide centralization of the available global information, allow prompt accessibility, integrate data from various sources around the world enabling more holistic data analysis and reliable reproducible studies (Maldonado et
al., 2015), and they also reduce financial and biodiversity costs of more in situ collecting events.
Biodiversity repositories have been developed since the 1800’s as natural history collections (NHC) which have been used in diverse studies from taxonomic and systematic information, geographic and temporal distributions, and population composition (Suarez and Tsutsui, 2004). NHC convey important scientific infrastructures of valuable data regarding the world’s biodiversity because they comprise organized sets of natural objects collected over time, in various locations, with relevant information associated (Cartaxana et al., 2014). These collections play an indispensable and often overlooked role in our current knowledge, as they do not only open an important “window” to the current and past diversity of life on Earth, but also play a vital role in fostering cutting-edge research in many areas (Lane, 1996). Hence, NHC contain valuable data and specimens used in research, higher education and science communication. NHC are a result of centuries of natural history and systematic studies, environmental monitoring programs, sound archives, research projects, among others, which have collected and stored data on the world biodiversity. All the collected information is stored and managed in many different systems and environments, that vary widely depending on the type of details captured
and stored for any individual record (Schindel and Cook, 2018). However, the standardization and availability of information from NHC on the internet has been increasing, allowing rapid access to data from various collections, as well as a greater taxonomic efficiency and quality control in the use of scientific nomenclature. Several museums, institutions and universities are digitizing and processing data from their collections, making it available on online repositories, which hold information on diversity, taxonomy and historical distributions of species (Graham et al., 2004). One of these repositories is the Global Biodiversity Information Facility (GBIF), which supports the publication of datasets using widely accepted biodiversity data standards. Currently, the GBIF only publishes datasets directly from organizations, therefore, any individual wishing to publish relevant data sets should work through their affiliate organizations or consider submitting the data to a journal (Robertson et al., 2014).
Other online repositories such as Integrated Digitized Biocollections (iDigBio), VertNet, World Register of Marine Species (WoRMS), Integrated Taxonomic Information System (ITIS) and citizens-based like iNaturalist and Biodiversity4all, are available, and often complement each other. Other sources of biodiversity data include academic publications and checklists, either on digital (open-access or not, with or without specific Digital Object Identifiers (DOI)) or in paper support that are often more specific and scattered. Therefore, gathering data included in these sources on more broad datasets, is also an important step to make the information available to different purposes and to wide audiences.
Given the increasing rates of biodiversity and habitat loss, it becomes imperative that we establish a simpler and more efficient form to integrate all biodiversity information in datasets and promote open sharing of associated data, so that scientists, analysts and politicians can both understand and apply them in research and policy decisions (Rocha et al., 2014). Marine biodiversity databases are important tools, which allow research, capacity-building and society outreach. Exploring existing digital records of decapod crustaceans biodiversity from MOZ and STP, including global digital repositories, NHC records and scientific literature; compile them into a comprehensive dataset; generate species occurrences distribution maps; and make these available online through interactive platforms; will increase our understanding of decapod crustaceans occurrences and distribution along the coast of both countries and will contribute to science, policy making and legislating, as well as to engage Mozambican and São Tomé and Principe’s citizens with science and the preservation of their natural resources.
1.1. Biodiversity Dataset Construction
Datasets comprise a collection of data organized into rows and columns where each column represents a particular variable and each row corresponds to a given record of the dataset. These data are prepared for statistical analysis. The dataset structure and properties are defined by several characteristics, that should be standardized in accordance to the purpose of the dataset. Despite the increasing number of technological tools available, a great deal of work is still being done to integrate biodiversity information on online digital repositories. For example, it is estimated that only 5% of NHC data is captured in digital databases (Beaman and Conn, 2003). The Darwin Core (DwC) metadata model defines standards for a straightforward and flexible framework for compiling biodiversity data from varied and variable sources, ensuring data interoperability. Originally developed by the Biodiversity Information Standards (TDWG) community, DwC is maintained by the evolving community (Wieczorek et al., 2012). It plays a key role in sharing, using and reusing open access biodiversity data and the vast majority of the hundreds of millions of species records available through GBIF are currently in this format (Baskauf et al., 2016). In fact, the DwC serves to share biodiversity data and first emerged in 1999 as a loosely defined set of terms. It has developed through several iterations across different groups, resulting in many different variants. A formal set of terms and processes for managing change was needed to ensure the usefulness of data integration. The objective has been to keep DwC as simple and open as possible, developing terms only when there is a shared
demand for them. DwC has a relatively long history of community development and is widely used (Wieczorek et al., 2012).
Once the data is incorporated into a dataset, additional work is generally required to make the sample record usable for further analysis. To do that, data must be validated and follow certain data quality requirements. Some common errors that hamper data quality are summarized in Table 1.1.
Table 1.1 – Type of errors that can be found in data quality assessments (Chapman, 2005).
Data values Description
Duplicated Two or more occurrences records referring to exactly the same occurrence (e.g. records from two or more different sources).
Inconsistent Same records from multiple sources with different formats, languages or other criteria (e.g. same institution, different acronyms).
Incorrect Values that do not match a given field within its context and possible values (e.g. misspellings of localities).
Missing Non-existent values where data should occur (e.g. if a lower taxonomic rank is included, all higher ranks should be included as well).
Non-atomic Values lumped together into a single cell that should be split in two or more fields (e.g. latitude and longitude coordinates in the same cell).
Unintended Using dubious values in species (e.g. ‘to be determined’, ‘sp. nov.’).
Verification and validation of data is a very important step in correcting and homogenizing data, according to a defined metadata model. For example, the dates may be in different formats (01-02-1990; 1990-02-01; 02-01-1990; February 1, 1990, etc.). This information will need to be standardized. There are several tools available for manipulating and correcting large datasets such as the spreadsheet software, Open Refine, and the programming languages R and Python. More complete, accurate and organized data have greater scientific value, and are easier to work with and publish on local or international repositories, in data papers, etc.
The spatial coordinates of the sampling, or observation locality, are extremely crucial information for biodiversity records. The term spatial data denotes any type of data, that describes phenomenon associated with some spatial dimension. Georeferenced data belong to a particular class of spatial data, which describe events, objects, and phenomena in the world associated with their location on the surface, at a certain moment or period of time (Câmara et
al., 1996). While advances in technology have made portable Global Positioning System (GPS)
receivers a practical solution for capturing spatial coordinates as they are gathered, text-based location descriptions remain essential and sometimes the only information available. The process of converting a text-based description based on the locality of the record into geospatial coordinates is called geocoding (Murphey et al., 2004, Wieczorek et al., 2004) or retrospective georeferencing, if added later by others than the collector (Chapman, 1991). Geocoding describes the process of locating an entity in real-world coordinates. It has become more prominent in recent years, due to the increasing availability of Geographic Information System (GIS) tools to facilitate this process. The geocoding process is, ultimately, a set of methods for overcoming problems associated with misinterpreted localities in museum specimens in NHCs. In fact, museum curators and technicians, currently face the great challenge of assigning spatial coordinates to locality data, for hundreds of millions of antique species records in NHC (Baker et al., 1998). The base information from older collections often lacks
geospatial coordinates, needed to track biodiversity change over time. Unfortunately, the older the collection data, the less accurate it usually is. This is partly due to the changing geographical terminology and collection standards over time (Chapman and Milne, 1998). Another significant factor is the disassociation of detailed records of collecting events (text, maps, photographs, coordinates), of sample labels and collection catalogs (Bloom et al., 2018). Nowadays, museums are starting this process with the common goal of making data available for geospatial analysis and their quality directly determines their usability of the data in geospatial analysis (Brisby, 2000). This relatively new activity is leading to the development of methodologies and tools to streamline the process, through a combination of shared and independent methods. Several projects have developed guidelines, protocols and tools for geocoding biodiversity information such as BioGeomancer (Chapman and Wieczorek, 2006), GEOLocate (Rios and Bart, 2010), MaNIS (Wieczorek et al., 2004; Wieczorek and Wieczorek, 2015) and MapSteDI (Murphey et al., 2004).
However, if the goal is to achieve comparable georeferenced data, developing different standards works against it. Georeferencing refers not only to assigning a point to a location, but also to determining the certainty of the assigned point. If properly implemented, georeferencing increases the accuracy of raw locality data, while turning it into an analytically useful format (Marinoni and Peixoto, 2010). Since, the degree of accuracy and precision processed by the georeferencing procedure depends on raw locality data, the geocoding process should include the attribution of some measure of degree of error or reliability in the data. For the most part, methods that currently include such confidence measures are expressed and derived in different ways. Perhaps the most important aspect of georeferencing is that it is a reproducible process. This is largely responsible for the impetus behind the georeferencing efforts, because it means that the process can transform location data consistently and accurately. The importance of these efforts is emphasized by the underlying purpose: to greatly increase data available for biological distribution and diversity studies. The ultimate goal is a quantitative and qualitative biological history derived from geospatial and temporal information (Matos, 2013).
1.2. Data Management
Data can be stored and maintained in databases in order to share and exchange data. Databases hold information in a manner that ensures the efficient management of large quantities of data and the retrieval of information as required to perform analysis and are intended for data research and interoperability with other databases (Shanmughavel, 2007). The PostgreSQL is a POSTGRES Version 4.2 based relational database management system (RDBMS), developed by the Department of Computer Science at the University of California, Berkeley. POSTGRES pioneered a number of concepts that became available much later in some commercial database systems. PostgreSQL is an open-source descendant of this original Berkeley code, which supports much of the Structured Query Language (SQL) standard and offers many modern features. PostgreSQL may be used, modified and distributed by anyone for any purpose, whether private, commercial or academic, free of charge (The PostgreSQL Global Development Group, 2019). Using a RDBMS like PostgreSQL can be advantageous, since it allows the integration of standardized biodiversity data from datasets, manage data access to multi-users, and its compatibility and facility in management geographic data by integrating the database into GIS tools (Senterre and Wagner, 2016).
1.3. Geographic Data Representation
An important tool for biodiversity data management is GIS, which can accommodate and display various sources for spatial information and analysis (Wahid, 2006). Several researchers have studied distribution patterns in marine species, giving every information regarding population regulation, local depletion, migration, marine reserve design and habitat selection, amongst others (Freire and Gonzalez-Gurriaran, 1998; Hooge and Taggart, 1998). However, little of the distribution pattern analysis developed and used in the terrestrial environment has been applied to aquatic species. In fact, despite the extensive development and use of analytical methods in spatial patterns studies on terrestrial species, using these techniques with GIS in aquatic systems have been difficult due to the lack of specific and suitable tools (White and Garrott, 1990; Hooge et al., 1999). Nevertheless, the combined use of radio-tracking, satellites, GPS and GIS systems, are becoming more used by scientists in aquatic studies. Moreover, the increase of georeferenced species occurrences data enables the use of GIS tools that can be used for geographic data representations through, e.g., the creation of accurate distribution maps.
The advantage of a GIS is that it modulates reality based on data and plays a major role in today's society, as it is an information system designed to capture, model, store, receive, share, manipulate, analyze and present geographically referenced information (Worboys and Duckham, 2004). Basic GIS operations now provide a secure basis for measuring, mapping and analyzing data. Data stored in a GIS database provides a simplified version of the Earth's surface. Georeferenced data can be organized by a GIS using different criteria, e.g. thematic maps or spatial objects. Each thematic layer can be saved using an appropriate data format, depending on its nature and the purpose of its use (Santos, 2013).
For example, in a study by Ramos et al. (2012), location descriptions were initially cleaned in GIS using administrative maps. The result was a georeferenced database with 2067 occurrences records of 47 nationally threatened forest species. Each record had a unique point resource by species and sufficient metadata directing the database user to the hit data source. The database can be used as a tool in determining priority species for species, taxonomic identification and historical mapping. It also serves as an integral component in the spatial modeling of tree species distribution and forest formations in the past and in a possible future scenario.
QGIS is a free and open-source geographic information application system that allows the visualization, editing, and analysis of spatial data. QGIS provides a rich environment for analyzing motion patterns, it allows the integration of multiple layers of habitat data into a structure capable of complex two-dimensional and three-dimensional analysis. QGIS integrates other open-source GIS packages, including PostGIS, GRASS and MapServer, to provide users with extensive functionality (Raes and van't Zelfde, 2016). One of the essential aspects of QGIS is that it works with geographic coordinates in the decimal format (e.g. 37.38º N).
1.4. Online Data Dissemination
Web mapping is the process of using GIS maps to interactively navigate and are accessed through a web browser. Since their conception, web maps have become more important than the historical and static cartography. This is because, from the moment data and geographic information are available on the web, the user chooses what to see, interacting with the map in search of understanding the various possibilities, depending on the exposed layers. The use of interactive platforms comprising web maps are becoming more important not only for the scientific community, but also for the civil society and decision-makers as they allow the
presentation of data in a simple and understandable visual scheme, as shown in the studies of Cristofori et al. (2015, 2016b and 2017) and Vincent et al. (2018).
Making web maps available online to the public can be accomplished using, for example, the QGIS Cloud online, which allows the creation of maps and can then be published and mapped with the QGIS Cloud plugin. QGIS Cloud data management offers a PostgreSQL 9 database with the PostGIS spatial component. New databases can be created and managed with any compatible administration tool, such as pgAdmin. The data and maps can be shared through Open Geospatial Consortium (OGC) compliant web services (e.g. Geoserver) via the three web service standards: 1) Web Map Service (WMS) to display maps, 2) data downloaded via Web Feature Services (WFS) and 3) Web Coverage Service (WCS). These allow web clients to query and receive geographic information in the form of image, vector, or coverage data. With the transactional Web Feature Service (WFS-T), spatial data can be directly edited through the web service (Sourcepole AG, 2018). Another option for publishing web interactive maps from QGIS, is OpenLayers, one of the most popular web publishing tools, which is an open-source JavaScript library. OpenLayers is modular, high-performance, and has many functions for displaying and interacting with maps and geospatial data (Henriques, 2016). Finally, Leaflet is a JavaScript library that incorporates maps, while more recent than OpenLayers, it quickly gained popularity as it works efficiently on all major desktop and portable platforms out of the box, leveraging HTML5 and CSS3 in modern browsers. It can be extended with add-ons, has an easy-to-use, well-documented Application Programming Interface (API), and a simple, readable source code (Agafonkin, 2019).
1.5. Objectives
This dissertation is integrated in the COBIO-NET project: Coastal biodiversity and food security in peri-urban Sub-Saharan Africa: assessment, capacity building and regional networking in contrasting Indian and Atlantic Ocean. Accordingly, the current work was developed with specific objectives within the scope of COBIO-NET.
The main objective of this dissertation was to integrate comprehensive information on decapod crustaceans inhabiting mangroves, seagrasses, corals and other coastal areas of MOZ and STP, and to disseminate this information online by constructing a dataset and making it available through an interactive digital platform where this data can be accessed, filtered and mapped. Understanding the spatial occurrences and distributions of decapod crustaceans in MOZ and STP will provide an important baseline information, trends on costal marine biodiversity and food security in these two countries. Furthermore, this work aimed to structure a dataset ready to be updated with new marine invertebrate data and implement digital tools to link these data, allowing the generation of online maps for interactive visualization.
Therefore, the following specific objectives were addressed:
o Dataset construction: aggregate global biodiversity data on decapod crustaceans from MOZ and STP, scattered in digital repositories (and to some extent on non-digital archives) relating to biodiversity data sources such as NHC and scientific literature, into a detailed dataset to create a reference biodiversity collection, expandable by other marine invertebrate data compiled by the COBIO-NET researchers with the future purpose to make all the information publicly available and accessible through the publication of the entire dataset on global biodiversity repositories (e.g. GBIF).
o Data management: develop a data management structure to manage and process biodiversity data from the previous dataset through an open-source relational database management system (RDBMS).
o Geographic data representation: construct maps with geographic data to visualize and analyze occurrence and distribution data of decapod crustaceans, included in the dataset using an open-source geographic information system (GIS) application tool.
o Online data dissemination: develop of an interactive digital platform, based on the dataset information, to visualize decapod crustaceans occurrences and distribution through different habitats using an open-source JavaScript library designed for web mapping and make it accessible to the scientific community and the general public.
o
Apply the dataset and platform to address specific issues, namely species occurrences and distribution of decapod crustaceans from mangroves, seagrasses, corals and other coastal areas along the coastlines of MOZ and STP.1.6. Dissertation Online
This outline gives an overview of the main points of the dissertation and it clarifies the framework and the focus of the dissertation.
Table 1.2 – Schematic outline of the dissertation.
Methodology
ß
Biodiversity Dataset Construction Data structuring Data compilation Data geocoding Data quality Coding ¯ Data Management PostgreSQL ¯
Geographic Data Representation QGIS
¯
Online Data Dissemination Leaflet
¯ Data Analysis
Results
ß
Biodiversity Dataset Construction ¯
Data Management ¯
Geographic Data Representation ¯
Online Data Dissemination Species occurrences Habitats Country boundaries Appearance Online access Discussion ß
Dataset Construction: development of a Dataset of MOZ and STP decapod crustaceans
Limitations on the development of the dataset Different approaches to the used methodology
¯
Data Management: using the PostgreSQL RDBMS
Limitations on data management
Different approaches to the used methodology ¯
Geographic Data Representation: mapping with QGIS
Limitations to the shapefiles data
Different approaches to the used methodology ¯
Online Data Dissemination: web maps for geographic visualization
Limitations to the online data dissemination Different approaches to the used methodology
¯
Applications of the Developed Digital tools ¯
2. Methodology
This study comprised the employment of digital tools, see Figure 2.1, applied for data collection, to construct a comprehensive dataset on decapod crustaceans and respective habitats through coastal zones in MOZ and STP, data processing and management, geographical data representation, and online data dissemination through an interactive digital platform, as follows:
§ Dataset Construction: aggregation of global biodiversity data contained in digital repositories relating to NHC, biodiversity data and scientific literature into a detailed dataset, using coding of different Python scripts to automate processes within the application.
§ Data Management: management and processing of biodiversity data from biological research collections through an open-source relational database management system (RDBMS).
§ Geographic Data Representation: manipulation and presentation of occurrence and distribution spatial data in an open-source geographic information system (GIS) application tool.
§ Online Data Dissemination: development of an interactive digital platform map using an open-source JavaScript library designed for web mapping.
Figure 2.1 – Workflow of the study project, depicting the main tasks of 1) data collection in yellow, 2) data management in
2.1. Biodiversity Dataset Construction
The construction of a dataset involved the compilation and organization of decapod crustacean data from STP and MOZ contained in digital repositories relating to NHC, biodiversity data and scientific literature. The dataset was compiled and organized in a Microsoft Excel spreadsheet, in which each row corresponds to a single occurrence in the dataset, i.e. an observation or sample, in a defined geographic location and period of time. Only the occurrences with taxon rank equal to genus or more specific, such as species and subspecies, were considered for this dataset. The data was catalogued into a DwC structured dataset, compiled, geocoded and validated.
2.1.1. Data Structuring
The majority of the attributes included in the dataset were defined in accordance to the corresponding DwC column terms (TDWG, 2014):
§ catalogNumber, unique identifier for the record within the data set or collection.
§ scientificName, full scientific name, with information on author and date, if available. When forming part of an Identification, this should be the name in the lowest level of taxonomic rank that can be determined.
§ kingdom, full scientific name of the kingdom in which the taxon is classified. § phylum, full scientific name of the phylum or division in which the taxon is
classified.
§ class, full scientific name of the class in which the taxon is classified. § order, full scientific name of the order in which the taxon is classified. § family, full scientific name of the family in which the taxon is classified. § genus, full scientific name of the genus in which the taxon is classified. § infraspecificepithet, name of the lowest or terminal infraspecific epithet of the
scientificName, excluding any rank designation.
§ taxonRank, taxonomic rank of the most specific name in the scientificName. § country, name of the country or major administrative unit in which the location
occurs, using the controlled vocabulary Getty Thesaurus of Geographic Names. § locality, specific description of the place. This term may contain interpreted information modified from the original to correct perceived errors or standardize the description.
§ verbatimLocality, original textual description of the place.
§ habitat, category or description of the habitat in which the event occurred (characterized by Python code. See Section 2.1.5.).
§ decimalLatitute, geographic latitude (in decimal degrees, using the spatial reference system given in geodeticDatum) of the geographic center of a location. Positive values are north of the Equator, negative values are south of it. Legal values lie between -90 and 90, inclusive.
§ decimalLongitude, geographic longitude (in decimal degrees, using the spatial reference system given in geodeticDatum) of the geographic center of a location. Positive values are east of the Greenwich Meridian, negative values are west of it. Legal values lie between -180 and 180, inclusive.
§ geodeticDatum, ellipsoid, geodetic datum, or spatial reference system (SRS) upon which the geographic coordinates given in decimalLatitude and decimalLongitude are based.
§ individualCount, number of individuals represented present at the time of the occurrence.
§ eventDate, date-time or interval during which an event occurred. For occurrences, this is the date-time when the event was recorded. Not suitable for a time in a geological context.
§ institutionCode, name (or acronym) in use by the institution having custody of the object(s) or information referred to in the record.
§ occurrenceID, identifier for the occurrence (as opposed to a particular digital record of the occurrence). In the absence of a persistent global unique identifier, construct one from a combination of identifiers in the record that will most closely make the occurrenceID globally unique.
§ references, resource that is referenced, cited, or otherwise pointed to by the described resource.
According to the specificity of the data been studied, a few new attributes not present in DwC were created in the dataset:
§ species, full scientific name of the species in which the taxon is classified, concatenation of genus and specificEpithet (name of the species epithet of the scientificName).
§ previousName, previous full scientific name in which the taxon was classified (checked by Python code. See Section 2.1.5.).
§ depthInMeters, the depth below the local surface.
§ taxonInfo, external link of information to the website WoRMS (filled by Python code. See Section 2.1.5.).
2.1.2. Data Compilation
The data was gathered from worldwide, open-source, available information from a) NHC records, b) online digital repositories and c) scientific literature. The following sources were used for each step:
a) NHC records
Museums such as the Smithsonian National Museum of Natural History (USNM), Naturalis Biodiversity Center, Muséum national d’Histoire naturelle (MNHN) and Royal Museum for Central Africa (RMCA), which have their collections information available online. The download was accomplished directly from all museums’ websites mentioned, with the exception of the MNHN. The data was instead retrieved through a Python script written specially for this purpose (See Section 2.1.5.). For such cases, in which NHC records were not available online, data was requested directly to the respective curator, e.g. Museu Nacional de História Natural e da Ciência de Lisboa (MUHNAC) and Swedish Museum of Natural History (NRM). The data was retrieved in the last quarter of 2018. Sources used are listed in Section 6.1.
b) Online Digital Repositories
– GBIF (Global Biodiversity Information Facility)
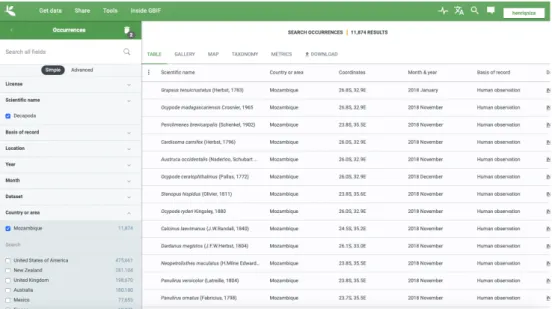
At gbif.org, the search for occurrences matching the desired criteria was conducted through “Occurrences” search under the “Get data” submenu at https://www.gbif.org/occurrence/search. Filtered by specific fields such as “Scientific name” and “Country or area”, with the terms “Decapoda”, and “Mozambique” and “Sao Tome and Principe”, respectively (see Figure 2.2). The data was downloaded in Comma-separated values (CSV) format. Retrieved on 21 September 2018. Sources used are listed in Section 6.1.
Figure 2.2 – GBIF website with a descriptive search conducted under Get data, Occurrences
submenu (GBIF.org, 2018).
– iDigBio (Integrated Digitized Biocollections)
At idigbio.com, inside the portal, the search was filtered by “Order” and “Country”, with the terms “Decapoda”, and “Mozambique” and “Sao Tome and Principe”, respectively. The data was downloaded in CSV format. Retrieved on 7 November 2018. Sources used are listed in Section 6.1.
– OBIS, former IOBIS (Ocean Biogeographic Information System) At iobis.org, now obis.org, the data was filtered using the search terms, “Decapoda”, “Mozambique” and “Sao Tome and Principe”. The data was downloaded in XLSX format. Retrieved on 3 November 2018. Sources used are listed in Section 6.1.
c) Scientific Literature
Species checklists were used to better understand existing species of decapod crustacean from MOZ and STP (e.g. Bandeira, S. & Paula, J. (eds.) (2014). The Maputo Bay Ecosystem. WIOMSA, Zanzibar Town, 427; De Grave & Fransen (2011). Carideorum catalogus (Crustacea: Decapoda). Zool. Med. Leiden 85; Bento, M. & Paula, J. (2018). WIO Journal of Marine Science 17, 13-51; Charles L Griffiths (2017). A Guide to, and Checklist for, the Decapoda
search of scientific literature was based mainly in the freely accessible web search engine Google Scholar, using keywords such as e.g. “decapods”, “Decapoda”, “Maputo”, “Inhaca”, “Mozambique”, “São Tomé and Príncipe”. Other sources used were the websites National Center for Biotechnology
Information (NCBI) database PubMed at
https://www.ncbi.nlm.nih.gov/pubmed/, ScienceDirect at https://www.sciencedirect.com, ResearchGate at https://www.researchgate.net and Assembling the Tree of Life (AToL): Decapoda at https://decapoda.nhm.org. The data was retrieved in the last quarter of 2018. Sources used are listed in Section 6.1.
2.1.3. Data Geocoding
Geocoding is the process of taking coded location information, such as addresses or grids and turning it into explicit location information – X and Y coordinates. Geocoding biodiversity data records is imperative so it can be related to a ground system of geographic coordinates. However, a large percentage of the data collected did not have latitude/longitude coordinates. Therefore, geocoding, verification and correction of geographic coordinates was accomplished using the GEOLocate Collaborative Georeferencing Web Client interface at https://www.geo-locate.org/web/default.html. GEOLocate georeferencing services were introduced in 2005 and these services allow software developers, to integrate georeferencing directly into their databases and applications. Specifically, the application enables collection management by providing users with direct access to geo-referencing, without having to export and import data or run additional software. A number of web-based clients also use GEOLocate e.g. Arctos, Specify, Symbiota and Tropicos. (Geo-locate.org, 2019).
GEOLocate uses an algorithm that begins by standardizing the locality sequence, in common terms, analyzes distances, compasses directions, and important geographic identifiers. This information is then used in a series of surveys and displacement calculations, to determine geographic coordinates. The resulting coordinates are then sorted, based on the type of information on the digital map display, for user verification, correction and error determination. In addition to automated location description processing, one of GEOLocate's goals is to provide an interface through which users can geo-reference records one by one in batches of files, view and correct calculated coordinates and determine polygonal error descriptions. After the coordinates derived from a location, then description and adjustments can be made by clicking and dragging a point displayed on a map. Error estimates can subsequently be recorded, as the maximum length a description can occupy. GEOLocate also allows the creation of shared communities, in which the users can co-operatively review and edit, by providing comments and saving them to the shared dataset in the collaborative georeferencing framework. See Figure 2.3.
Figure 2.3 – Workflow of how to geocode data in GEOLocate directly from the web browser, using available
web-based clients (Adapted from Soares, 2019; created using the Lucidchart web-based application).
GEOLocate tasks included a) uploading data and b) geocoding data associated with locations.
a)
Uploading Data
To upload the data into the GEOLocate Collaborative Georeferencing Web Client interface, data from the two countries studied, MOZ and STP were split into two distinct datasets. Data was further split into different files according to the verbatimLocality language: English, Spanish, French, German, Dutch and Portuguese. Entries with sourced coordinates were excluded from the analysis.
The collaborative georeferencing framework was used in the analysis, as it is ideal for largescale multi-institution projects. The data source fields catalogNumber, scientificName, country and verbatimLocality were
mandatorily used for the analysis and were mapped into the desired system field for uploading. See Figure 2.4.
Figure 2.4 – Web-based data management portal for mapping fields in data source. Required
fields are indicated in dark grey. Matching field are mapped with auto-mapping (coge.geo-locate.org, 2019).
b)
Geocoding Data
To geocoding the occurrences, it was necessary to search one location at a time. According to the local description, the coordinates’ point that were most correct were accepted, either determined automatically by the GEOLocate or manually by the user.
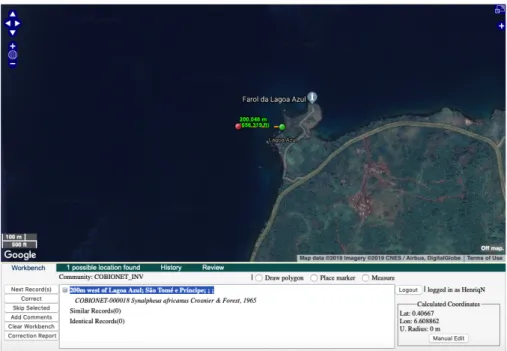
Most of the records were geocoding using the “Place marker” automatic option, via a similarity index which is used to identify all records that appear to describe the same collection locality, regardless of syntax. Records such as e.g. “200 m west of Lagoa Azul; São Tomé e Príncipe” were also geocoded by using the “Measure” option to re-classify records that had to be manually corrected. See Figure 2.5.
Figure 2.5 – Correction depicted with the “Measure” tool. The location of the green marker
was dragged and dropped in the desired location. The “Correct” button saves the corrections and moves to the next uncorrected locality (geo-locate.org, 2019).
Records with the general description of “Off” e.g. Zambeze River, Off Mouth, were geocoded 200 to 300 meters from the locality. The uncertainty of the records was dismissed. The georeferenced work was extracted in a CSV file. Any records that were unable to be geocoded by GEOLocate, were either discarded or manually searched and georeferenced using Google Maps.
2.1.4. Data Quality
The data saved in a spreadsheet was collected from multiple sources. Therefore, ensuring data standardization was essential to produce a reliable dataset. To obtain such a dataset, the data was a) cleaned, b) transformed and c) extended by using relational information. In order to achieve this, the open-source desktop application OpenRefine v3.1 was used to wrangle the data.
a)
Data Cleaning
The various sources were compared amongst each other in order to spot duplicates, erroneous data and when possible to fill in missing information. Using the “Text facet” feature for text columns, cell contents were grouped into unique entries allowing the quick visualization of similar data written in different ways. For example, in Figure 2.6., one can observe how “Beira” is written in different ways, including differences in lower/upper cases and even wrong spelling.
For each column various inconsistencies were found, such as trailing white spaces. To fix these, a trimming transformation was applied to the columns:
Þ 2.1 value.trim()
Other inconsistences, like words written in many alternative representations of the same object, were otherwise fixed using the clustering feature, which assembles words in groups based on heuristics methods. Different methods were chosen based on the best obtained results. See Figure 2.7.