Submitted6 August 2016 Accepted 1 November 2016 Published13 December 2016
Corresponding author Nora Escribano,
Academic editor Stuart Pimm
Additional Information and Declarations can be found on page 11
DOI10.7717/peerj.2743
Copyright 2016 Escribano et al.
Distributed under
Creative Commons CC-BY 4.0
OPEN ACCESS
Biodiversity data obsolescence and land
uses changes
Nora Escribano, Arturo H. Ariño and David Galicia
Department of Environmental Biology, Universidad de Navarra, Pamplona, Spain
ABSTRACT
Background. Primary biodiversity records (PBR) are essential in many areas of scientific research as they document the biodiversity through time and space. However, concerns about PBR quality and fitness-for-use have grown, especially as derived from taxonomical, geographical and sampling effort biases. Nonetheless, the temporal bias stemming from data ageing has received less attention. We examine the effect of changes in land use in the information currentness, and therefore data obsolescence, in biodiversity databases.
Methods. We created maps of land use changes for three periods (1956–1985, 1985– 2000 and 2000–2012) at 5-kilometres resolution. For each cell we calculated the percentage of land use change within each period. We then overlaid distribution data about small mammals, and classified each data as ‘non-obsolete or ‘obsolete,’ depending on both the amount of land use changes in the cell, and whether changes occurred at or after the data sampling’s date.
Results. A total of 14,528 records out of the initial 59,677 turned out to be non-obsolete after taking into account the changes in the land uses in Navarra. These obsolete data existed in 115 of the 156 cells analysed. Furthermore, more than one half of the remaining cells holding non-obsolete records had not been visited at least for the last fifteen years.
Conclusion. Land use changes challenge the actual information obtainable from biodiversity datasets and therefore its potential uses. With the passage of time, one can expect a steady increase in the availability and use of biological records—but not without them becoming older and likely to be obsolete by land uses changes. Therefore, it becomes necessary to assess records’ obsolescence, as it may jeopardize the knowledge and perception of biodiversity patterns.
SubjectsBiodiversity, Biogeography, Bioinformatics, Ecosystem Science, Zoology
Keywords Historical records, Land use changes, Small mammals, Temporal bias, Biodiversity datasets, Primary biodiversity records, Obsolescence
INTRODUCTION
Primary biodiversity records (PBR) are essential in biogeography, trend assessment, climate change ecology or conservation biology (Rocchini et al., 2011;Powney & Isaac, 2015). At their most basic level, PBR provide fundamental data about location of living beings—what, where and when—(Ariño et al., 2012) and have been widely used for building maps and models of species distribution.
become one of the main concerns in the scientific community (Hermoso, Kennard & Linke, 2013). The relevance and utility of these data are both important for assessing priority areas for conservation and determining drivers of biodiversity loss (Willis et al., 2007;Powney & Isaac, 2015,Convention on Biological Diversity (CBD), 2010).
Free access to PBR has been steadily increasing in the last decade as many initiatives of data sharing have been launched (e.g., GBIF, VerNet, Living Planet Index). However, concerns about the quality and fitness-for-use of this data have grown since massive biodiversity data have become available (Hill et al., 2010;Ariño, Chavan & Fatih, 2013;
Faith et al., 2013). The quality of data responds to different sources of errors and uncertainties, and these determine their usability. Typically, information in datasets is spatially and taxonomically biased and differs in the amount of sampling effort (Boakes et al., 2010) so researches have focused on addressing which roles play these limitations on data quality (Sastre & Lobo, 2009;Otegui et al., 2013;Beck et al., 2014). All of this has led to important research articles and guidelines about how to avoid and reduce data uncertainty (e.g.,Chapman, 2005).
Nevertheless, researchers have paid less attention to temporal bias. By definition, a PBR is always a piece of information about the past (where and when an organismwasrecorded). Thus, its usefulness for estimating current ecological phenomena (like distribution or niche preference) will be affected by its age. As time goes by and the PBR becomes older, uncertainty about its spatial information is expected to increase. Obviously, the population may have gone extinct locally and thus, we cannot assure that, at the present, the PBR is informative whether the population still spreads there or not. However, it is also worth noticing that the habitat present at the locality may have changed since the species was recorded and thus, any matching between specimen location and habitat conditions must assure the temporal synchrony of both aspects of the species’ ecology. Comparatively, while information about locations of individuals in the past is abundant, information about past conditions of the territory (e.g., land uses) is not as common. As this temporal gap grows, we cannot guarantee that the current environmental conditions resemble those when the observation or specie was recorded. We may thus expect this uncertainty to eventually reach some threshold value that would turn it into an outdated PBR, unsuitable for being used in models under current habitat conditions. In this way, we use the term obsolete to define a PBR whose temporal frame no longer supports the relationship between the referred specimen and the current habitat conditions. In many cases, the uncertainty of older records has led to include only recent ones in studies about distribution patterns or niche modelling (Moscoso, Albernaz & Salomão, 2013;Ficetola et al., 2014). However as far as we know, the expiration of the records has not been assessed in literature.
loss take place (Sala et al., 2000;Crowl et al., 2008), obsolescence could become even more of a crucial factor. Humans have a large trajectory of changing landscapes, being one of the most highlighted drivers of biodiversity loss (Ellis et al., 2010). Recent studies have shown the direct relation between the changes in the use of land and changes in bird (Rittenhouse et al., 2012;Dorresteijn et al., 2015), mammal (Sieber et al., 2015;Torre et al., 2015;Cisneros, Fagan & Willig, 2015), amphibian (Nori et al., 2015) and invertebrate communities (Ngai et al., 2008;Wagner, Krauss & Steffan-Dewenter, 2013). Therefore, when the dates of records in a biodiversity database coincide with, or precede, important changes in land use, neglecting obsolescence of the data could allow for a considerable amount of noise in the primary data used to estimate potential distribution areas or diversity patterns.
In this paper we investigate the effect of changes in land use on the obsolescence of data contained in biodiversity databases. For this purpose, we need long term biodiversity data from an area where changes in the territory have occurred, but also that this geographical information is accessible or even exists. These two requirements are met in the Vertebrate Collection of the Museum of Zoology of University of Navarra (hereafter MZNA) which holds mammal’s long term data from the state province of Navarra. Moreover, the geographic information system of Navarra (SITNA) gathers land uses information covering the temporal data frame of the MZNA dataset. Thus, this study extent together with the rich data from mammals in this area makes it a valuable testing ground for the target of this research.
MATERIALS AND METHODS
Study region
Navarra is a 10,391 km square region located in the north of Spain, wedged between the western end of the Pyrenean Range and the Ebro Basin (Fig. 1). Both Eurosiberian and Mediterranean bioregions occur in this territory. It gathers a high landscape diversity as a result of its wide variety of climatic and topographic conditions (Nogués-Bravo, 2006). The northern areas, with mean altitudes above 800 m (range 200 m–2,000 m), high precipitations (1,200–1,700 mm of mean annual rain and snowfall) and moderate temperatures, are covered by pastures and natural beech and oak forests as well as pine plantations. Agricultural and Mediterranean landscapes dominate the south of Navarra, with mean altitudes below 400 m and a combination of low precipitation (below 400 mm) and temperature that favour the presence of rich communities of xerophytic shrublands. All this variety of habitats determines the high diversity of the small mammals’ community in Navarra, which comprises 31 of the 34 species of native insectivorous and rodents cited in the Iberian Peninsula (Escala et al., 1997).
Biodiversity data
! ! ! !!! !! ! ! ! ! ! ! ! ! ! ! !! ! ! ! ! ! ! !! !!! ! !! ! ! ! ! ! ! !!! ! ! ! ! ! ! ! !! !! ! ! ! ! !! !! ! !! ! ! ! !! ! !! ! ! ! ! ! !!!! !! !! ! !!! !! ! ! ! !! ! ! ! !! ! ! ! ! ! ! ! !! !! !! !! !! !! !! ! !!! !!!!! ! ! ! ! ! !! ! ! ! ! ! ! !!!!!!!!!! !!! ! !! ! !!! ! !! ! !! ! ! !!! ! ! !!! !! ! ! ! ! !! ! ! ! ! !!!!! !!! ! ! ! ! ! !! ! ! !! ! ! !! !!! !! ! ! ! ! ! ! ! ! !! !! !!!! ! ! ! ! ! ! ! !! !
20
Km
¯
FRANCE
SPAIN
Navarra
Figure 1 Sampling sites for small mammals in the ‘Pellet sampling’ dataset in Navarra.Inset: location of Navarra within the Iberian Peninsula. Outset: Navarra in white line.
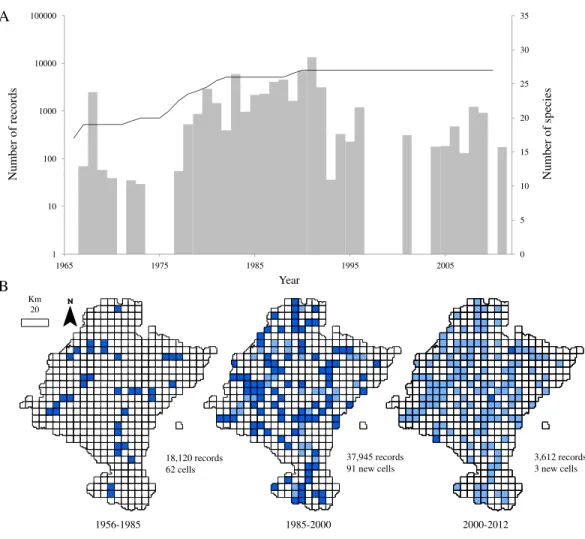
comprehensive, publicly accessible collection of small mammals in Spain (Figs. 1and2A). As pellets have proved to be very useful for assessing the small mammals’ community in a territory (Torre, Arrizabalaga & Flaquer, 2004;Avenant, 2005), this dataset is a valuable tool for analysing the changes in distribution patterns of diversity in the last four decades.
0 5 10 15 20 25 30 35
1 10 100 1000 10000 100000
1965 1975 1985 1995 2005
Num
ber
of
sp
ec
ies
Num
ber
of
record
s
Year
18,120 records 62 cells
37,945 records 91 new cells
3,612 records 3 new cells
1956-1985 1985-2000 2000-2012 A
B Km
20
Figure 2 Temporal and spatial distribution of records in ‘pellet sampling’ dataset.(A) Temporal dis-tribution of the records. Bars: historical registry of small mammals in Navarra (as number of records per year). Line: species accumulation curve. (B) Distribution of records according to the three time intervals. Dark blue: cells first sampled in the time interval considered. Light blue: cells already sampled before the interval.
Land use data
Land use data was obtained from the Geographic Information System of Navarra. For our purpose, we chose the land use maps for 1956, 1985, 2000 and 2012 covering the entire time span in our occurrence data. All maps are polygon-based layers that provide information about land cover types in Navarra.
Land use changes and biological data analysis
We used ArcGIS 10 software to perform spatial analyses (ESRI, 2015). We calculated the land uses changes for the three periods delimited by the reference maps (1956–1985, 1985–2000 and 2000–2012) by means of a spatial intersection of the corresponding maps. The three resultant maps of land use changes consisted on a series of polygons that either (1) had not suffered from changes in their land uses (there were no changes in their relative abundance matrices) or (2) had change from one land use to another (their relative abundance matrices were different). A 5×5 km grid was then superimposed to
the study area, summarizing the percentage of land use changes per cell by dissolving all their polygons (seeDocument S1). The spatial resolution of the study (25 km sq) was set according to the assumed home range of the barn owl as the mammals’ records come from pellets of this bird. A radius of 3 km from the nest/roosting site (and then an ideal circular area of about 28 km sq) is accepted to be suitable to characterize the habitat of this predator in a territory (Martínez & Zuberogoitia, 2004). The small mammals’ records were also collapsed to the same grid. Cells with no recorded occurrences as well as those with an effective size below 12.5 km sq (mostly located in the border of the study area) were discarded.
In order to evaluate the records’ obsolescence, cells with more of the 25% of their surface affected by land use modifications were labelled as highly modified cell (HMC). The threshold was empirically established based on those cells with sampling series long enough to perform comparative analyses of community and territorial changes (see Document S1 for further details). Then, following the reasoning presented previously, samples collected before or during periods of land use changes were labelled as obsolete.
RESULTS
Temporal variation in data sources
Our analysis of the net changes in the land uses of Navarra showed that 27% of its surface has changed during the entire dataset’s timeframe (1956–2012). Overall, forestry land uses increased by 11% while meadows and shrublands decreased by 12%. Herbaceous and woody crops suffered a small decrease, and unproductive areas increased slightly. Relative to HMC, we found that they were greater in the periods 1956–1985 and 1985–2000, representing more than the 60% of cells. On the contrary, between 2000 and 2012 the number of HMCs decreased and there were only 14 HMC.
<10 years 10-20 years >20 years Km
25
obsolete records non obsolete records
Figure 3 Distribution of cells holding small mammals’ records.White: cells with no data; brown: cells with obsolete data; blue: cells with non-obsolete data. Blue shades: length of time since the cell was last vis-ited (darker: more recent visit).
observe another period where records from pellets increased between 1980 and 1987. This inventorying was not large in terms of occurrences, but was remarkably uniform through time. After the publication of the atlas, addition of new records of small mammals decreased.
Regarding to the richness of the dataset, all the 27 species considered in this study were already present in the database by 1991 and richness had almost attained a plateau five years before (Fig. 2A). Even though samples collected after 1985 did not contribute significantly to the total richness of the group, the spatial representativeness of the dataset grew considerably (Fig. 2B). The sampled area duplicated from 1985 to 2000, adding 91 new cells, previously unsampled, and thus increasing the biogeographical information of most of the species.
Obsolescence analysis
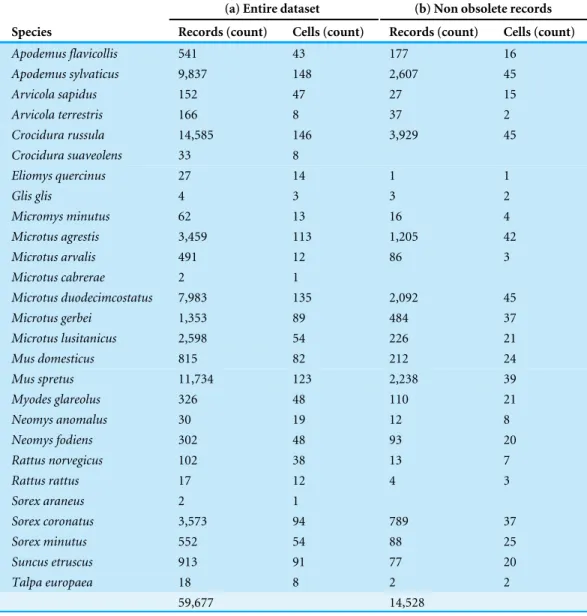
Table 1 Overview of information contained in the dataset.(a) All samples and (b) non obsolete records.
(a) Entire dataset (b) Non obsolete records
Species Records (count) Cells (count) Records (count) Cells (count)
Apodemus flavicollis 541 43 177 16
Apodemus sylvaticus 9,837 148 2,607 45
Arvicola sapidus 152 47 27 15
Arvicola terrestris 166 8 37 2
Crocidura russula 14,585 146 3,929 45
Crocidura suaveolens 33 8
Eliomys quercinus 27 14 1 1
Glis glis 4 3 3 2
Micromys minutus 62 13 16 4
Microtus agrestis 3,459 113 1,205 42
Microtus arvalis 491 12 86 3
Microtus cabrerae 2 1
Microtus duodecimcostatus 7,983 135 2,092 45
Microtus gerbei 1,353 89 484 37
Microtus lusitanicus 2,598 54 226 21
Mus domesticus 815 82 212 24
Mus spretus 11,734 123 2,238 39
Myodes glareolus 326 48 110 21
Neomys anomalus 30 19 12 8
Neomys fodiens 302 48 93 20
Rattus norvegicus 102 38 13 7
Rattus rattus 17 12 4 3
Sorex araneus 2 1
Sorex coronatus 3,573 94 789 37
Sorex minutus 552 54 88 25
Suncus etruscus 913 91 77 20
Talpa europaea 18 8 2 2
59,677 14,528
Species by species, the overall attrition rate (number of records filtered out by flagging them as obsolete) was generally high, over 70% in 74% of the species. The information loss was critical in species with very low representation in the original dataset, such asCrocidura
suaveolens Pallas, 1811,Microtus cabrerae (Thomas, 1906) andSorex araneusLinnaeus,
1758. Although an overall reduction in record numbers is expected to affect all species to a greater or lesser extent, these species actually disappeared from the dataset (Table 1).
DISCUSSION
Biodiversity records in a changing territory
seemed related to an increase in forest cover due mainly to two managerial practices: (1) steady repopulation on bare soils with tree species as an erosion-avoiding strategy, and (2) phasing out of fuel in favour of other energy sources, which occurred mainly between 1970 and 1990 (Gobierno de Navarra, 2000;Nogués-Bravo, 2006). However, our study does not aim to understand how Navarra has shifted its landscape, but to record the main land use changes at the sites where small mammals were recorded. These changes might therefore compromise the information that could be obtained from the biodiversity datasets.
We found that more than half the record-bearing territory area contained records compromised by such changes, and thus rendering these records as potentially obsolete. After applying our criterion of filtering out PBR collected before or during land use changes, we discarded approximately 75% of the small mammals’ records (Fig. 4). As reported in several studies, changes in the management of the territory have led to changes in communities and older records may not reflect the current communities. For example,
Torre et al. (2015)resampled historically sampling sites for barn owl pellets finding changes in the frequencies of small mammals and a decrease in the species richness from 14 to 10. Similarly, when we discarded data compromised by land use changes, richness in our ‘Pellet sampling’ dataset lost three of the rarest species. Furthermore, the number of cells in which each species was recorded was reduced in most cases by more than 70%. The loss of information was not concentrated at specific sites, but spread all over the studied territory.
Implications of data obsolescence
Obsolescence could become a critical factor for species whose distribution pattern remains unclear. For example, M. cabrerae is an endemism of the Iberian peninsula, but its distribution is still unclear as information about its presence is patchy (Garrido-García et al., 2013). This knowledge gap ushered this microtine into the UICN Red List as ‘Nearly Threatened’ (seeTable S1) and catalogued as ‘Vulnerable’ in Spain (Palomo, Gisbert & Blanco, 2007). However, if the data records of this species are old enough and come from a territory where land use changes have occurred afterwards, we cannot longer guarantee that those records are contributing to a reliable, current picture of its actual distribution. Similarly, other species whose distribution is unknown will suffer from the same lack of confidence.
Obsolescence could also affect the outcomes of SDMs when the habitat descriptors do not match the data frame of the biodiversity records used to calibrate the model, thus giving a biased result. The main challenge is then to find a way of estimating how much this ageing in relation to a desired timeframe, e.g., the ‘now,’ may affect the outcome of the model. As PBR are central to the construction of these models, it is important to considerate this limitation as well as other types of biases.
● ● ● ● ● ● ● ● ● ● ● ● ● ● ● ● ● ● ● ● ● ● ● ● ● ● ● Apodemus flavicollis Apodemus sylvaticus Arvicola sapidus Arvicola terrestris Crocidura russula Crocidura suaveolens Eliomys quercinus Glis glis Micromys minutus Microtus agrestis Microtus arvalis Microtus cabrerae Microtus duodecimcostatus Microtus gerbei Microtus lusitanicus Mus domesticus Mus spretus Myodes glareolus Neomys anomalus Neomys fodiens Rattus norvegicus Rattus rattus Sorex araneus Sorex coronatus
Sorex minutus Suncus etruscus
Talpa europaea
10 100 1000 10000
25 50 75 100
Loss of records (%)
Number of records in the original dataset
Figure 4 Effect of records loss per species.Relationship between the percentage of records loss by species and the number of records gathered in the entire dataset (log scale).
of biodiversity information. Our results showed that records from abundant species are prone to a lower decrease whereas records from rare species show a greater rate of attrition. Together, these two observations can help guide sampling efforts towards more efficient campaigns that may close knowledge gaps (Ariño, Chavan & Otegui, 2016). It might thus be preferable, and accrue more information, to sample those cells were rare species are distributed, where records are old, and where changes in land use have occurred since the locality was last sampled. This would improve survey designs and efficient monitoring of the wildlife, returning maximum information while spending minimum sampling efforts.
(De Palma et al., 2015) and, therefore, the biology of a species could likely be a factor affecting obsolescence.
In this study we have explore the obsolescence of biodiversity records related to the land uses changes. We have pointed out that these records can be outdated and might give us an out-of-time picture of species distribution. However, we have only scratched the surface and we still have to explore in depth the implications of obsolescence of data and whether the use of obsolete data can be misleading towards understanding current species distribution patterns.
CONCLUSION
As time goes by, we can expect to observe a steady increase in the availability and use of biological records but by definition, records taken at a fixed point in time will age: their validity or fitness-for-use may decrease as the gap between theirrecording time and their
application time increases. Continuing digitization and release of data from museums
or private collections, which may likely include old records, will increase the need to determine, and account for, obsolescence of those records as its age could compromise the knowledge and perception of current distributional patterns of biodiversity worldwide.
In geographical terms, we have tested a relatively local dataset. However, we believe that our observations could be generalized to other cases and other extents. Land uses changes have been recorded from regional to global scales (Feranec et al., 2010;Ellis et al., 2010) and databases seem to share the same limitations of spatial, taxonomical and temporal biases (Sastre & Lobo, 2009;Boakes et al., 2010;Isaac & Pocock, 2015). Although we could not find literature to compare our results to other similar analyses, we can expect that our findings within the MZNA database in Navarra can be reproduced in other databases as well.
ACKNOWLEDGEMENTS
We are very grateful to Dr Carmen Escala who started to document the small mammals’ community of Navarra in the department of Environmental Biology of University of Navarra, actively contributing to the creation of the ‘Pellet sampling’ dataset from the MZNA. Without her effort and dedication of inventorying the small mammals’ community, we could not have done this research. We also thank all researchers, technicians, and volunteers that contributed with information to the dataset. Finally, we would like to thank Eva Escribano for language comments and two anonymous reviewers for valuable comments that considerably improved the manuscript.
ADDITIONAL INFORMATION AND DECLARATIONS
Funding
Grant Disclosures
The following grant information was disclosed by the authors: NE is funded by Asociación de Amigos de la Universidad de Navarra.
Competing Interests
The authors declare there are no competing interests.
Author Contributions
• Nora Escribano conceived and designed the experiments, performed the experiments,
analyzed the data, wrote the paper, prepared figures and/or tables.
• Arturo H. Ariño conceived and designed the experiments, contributed
reagents/materi-als/analysis tools, reviewed drafts of the paper.
• David Galicia conceived and designed the experiments, performed the experiments,
analyzed the data, contributed reagents/materials/analysis tools, reviewed drafts of the paper.
Data Availability
The following information was supplied regarding data availability: GBIF
DOI:10.15470/qomfu6
http://www.gbif.org/dataset/95ed1fa5-2923-4459-836b-11ad8cc4bf42.
Supplemental Information
Supplemental information for this article can be found online athttp://dx.doi.org/10.7717/ peerj.2743#supplemental-information.
REFERENCES
Ariño AH, Chavan V, Otegui J. 2016.Best practice guide for data gap analysis for
biodiver-sity stakeholders. Copenhagen: GBIF Secretariat.
Ariño AH, Chavan VC, Fatih DP. 2013.Assessment of user needs of primary biodiversity data: analysis, concerns and challenges.Biodiversity Informatics8:59–93
DOI 10.17161/bi.v8i2.4094.
Ariño AH, Otegui J, Villarroya A, De Zabalza AP. 2012.Primary biodiversity data records in the pyrenees.Environmental Engineering and Management Journal
11:1059–1075.
Avenant NL. 2005.Barn owl pellets: a useful tool for monitoring small mammal communities?Belgian Journal of Zoology135:39–43.
Beck J, Böller M, Erhardt A, Schwanghart W. 2014.Spatial bias in the GBIF database and its effect on modeling species’ geographic distributions.Ecological Informatics
19:10–15DOI 10.1016/j.ecoinf.2013.11.002.
Boero F, Kraberg AC, Krause G, Wiltshire KH. 2015.Time is an affliction: why ecology cannot be as predictive as physics and why it needs time series.Journal of Sea
Research101:12–18DOI 10.1016/j.seares.2014.07.008.
Chapman AD. 2005.Principles of data quality.Report for the global biodiversity
informa-tion facility. version 1.0. Copenhagen: GBIF Secretariat.Available athttp:// www.gbif.
org/ resource/ 80509.
Cisneros LM, Fagan ME, Willig MR. 2015.Effects of human-modified landscapes on taxonomic, functional and phylogenetic dimensions of bat biodiversity.Diversity and
Distributions21:523–533DOI 10.1111/ddi.12277.
Convention on Biological Diversity (CBD). 2010.Plan Estratégico para la Diversidad Biológica 2011–2020 y las Metas de Aichi para la Diversidad Biológica. Secretariat of the CBD. Available athttps:// www.cbd.int/ sp/.
Crowl TA, Crist TO, Parmenter RR, Belovsky G, Lugo AE. 2008.The spread of invasive species and infectious disease as drivers of ecosystem change.Frontiers in Ecology and
the Environment 6:238–246DOI 10.1890/070151.
De Palma A, Kuhlmann M, Roberts SPM, Potts SG, Börger L, Hudson LN, Lysenko I, Newbold T, Purvis A. 2015.Ecological traits affect the sensitivity of bees to land-use pressures in European agricultural landscapes.Journal of Applied Ecology
52:1567–1577DOI 10.1111/1365-2664.12524.
Dorresteijn I, Teixeira L, Von Wehrden H, Loos J, Hanspach J, Stein JAR, Fischer J. 2015.Impact of land cover homogenization on the Corncrake (Crex crex) in tradi-tional farmland.Landscape Ecology30:1483–1495DOI 10.1007/s10980-015-0203-7. Ellis EC, Klein Goldewijk K, Siebert S, Lightman D, Ramankutty N. 2010.
Anthro-pogenic transformation of the biomes, 1700 to 2000.Global Ecology and Biogeography
19:589–606DOI 10.1111/j.1466-8238.2010.00540.x.
Escala C, Irurzun JC, Rueda A, Ariño AH. 1997.Atlas de los Insectívoros y Roedores
de Navarra. Análisis biogeográfico. Pamplona: Servicio de Publicaciones de la
Universidad de Navarra.
Escribano N, Galicia D, Ariño AH, Escala C. 2016.Long-term data set of small mammals from owl pellets in the Atlantic–Mediterranean transition area.Scientific Data
3:160085DOI 10.1038/sdata.2016.85.
ESRI. 2015.ArcGIS deskopt 10.0. Redlands: Environmental Systems Research Institute. Faith D, Collen B, Ariño A, Patricia Koleff PK, Guinotte J, Kerr J, Chavan V. 2013.
Bridging the biodiversity data gaps: recommendations to meet users’ data needs.
Biodiversity Informatics8:41–58DOI 10.17161/bi.v8i2.4126.
Feranec J, Jaffrain G, Soukup T, Hazeu G. 2010.Determining changes and flows in European landscapes 1990–2000 using CORINE land cover data.Applied Geography
30:19–35DOI 10.1016/j.apgeog.2009.07.003.
Ficetola GF, Rondinini C, Bonardi A, Katariya V, Padoa-Schioppa E, Angulo A. 2014.An evaluation of the robustness of global amphibian range maps.Journal of
Biogeography 41:211–221DOI 10.1111/jbi.12206.
Revisión a nivel ibérico de la distribución del topillo de Cabrera o iberón, Iberomys cabrerae (Thomas, 1906).Galemys25:35–49DOI 10.7325/Galemys.2013.A4. Gobierno de Navarra. 2000.Plan forestal de Navarra. Pamplona: Publicaciones del
Go-bierno de Navarra. Available athttp:// www.navarra.es/ NR/ rdonlyres/ ACCCD512-309A-4408-969C-A8972FB1F7E8/ 291939/ PlanForestal.pdf.
Hermoso V, Kennard MJ, Linke S. 2013.Data acquisition for conservation assessments: is the effort worth it?PLoS ONE8:e59662
DOI 10.1371/journal.pone.0059662.
Hill AW, Otegui J, Ariño AH, Guralnick RP. 2010.GBIF position paper on future directions and recommendations for enhancing fitness-for-use across the GBIF network,
version 1.0. Copenhagen: Global Biodiversity Information Facility. Available at
http:// www.gbif.org.
Isaac NJB, Pocock MJO. 2015.Bias and information in biological records.Biological
Journal of the Linnean Society115:522–531 DOI 10.1111/bij.12517/abstract.
Martínez JA, Zuberogoitia I. 2004.Habitat preferences and causes of population decline for Barn owls Tyto alba: a multi-scale approach.Ardeola51:303–317.
Moscoso V, Albernaz AL, Salomão RDP. 2013.Niche modelling for twelve plant species (six timber species and six palm trees) in the Amazon region, using collection and field survey data.Forest Ecology and Management 310:652–662 DOI 10.1016/j.foreco.2013.08.064.
Ngai JT, Kirby KR, Gilbert B, Starzomski BM, Pelletier AJD, Conner JCR. 2008.The impact of land-use change on larval insect communities: testing the role of habitat elements in conservation.Ecoscience15:160–168DOI 10.2980/15-2-3098.
Nogués-Bravo D. 2006.Assessing the effect of environmental and anthropogenic factors on land-cover diversity in a Mediterranean mountain environment.Area
38:432–444DOI 10.1111/j.1475-4762.2006.00709.x.
Nori J, Lemes P, Urbina-Cardona N, Baldo D, Lescano J, Loyola R. 2015.Amphibian conservation, land-use changes and protected areas: a global overview.Biological
Conservation191:367–374DOI 10.1016/j.biocon.2015.07.028.
Otegui J, Ariño AH, Chavan V, Gaiji S. 2013.On the dates of the GBIF mobilised primary biodiversity data records.Biodiversity Informatics8:173–184.
Palomo LJ, Gisbert J, Blanco JC. 2007.Atlas y libro rojo de los mamíferos terrestres de
España. Madrid: Dirección General para la Biodiversidad-SECEM-SECEMU.
Pimm SL. 1991.The balance of nature? Ecological issues in the conservation of species and
communities. London: The University of Chicago Press.
Powney GD, Isaac NJB. 2015.Beyond maps: a review of the applications of biological records.Biological Journal of the Linnean Society 115:532–542
DOI 10.1111/bij.12517.
Rittenhouse CD, Pidgeon AM, Albright TP, Culbert PD, Clayton MK, Flather CH, Masek JG, Radeloff VC. 2012.Land-cover change and avian diversity in the Conterminous United States.Conservation Biology26:821–829
Rocchini D, Hortal J, Lengyel S, Lobo JM, Jimenez-Valverde A, Ricotta C, Bacaro G, Chiarucci A. 2011.Accounting for uncertainty when mapping species distribu-tions: the need for maps of ignorance.Progress in Physical Geography35:211–226 DOI 10.1177/0309133311399491.
Sala OE, Chapin FS, Armesto JJ, Berlow E, Bloomfield J, Dirzo R, Huber-Sanwald E, Huenneje LF, Jackson RB, Kinzig A, Leemans R, Lodge DM, Mooney HA, Oesterheld M, LeRoy Poff N, Sykes MT, Walker BH, Walker M, Wall DH. 2000.Global biodiversity scenarios for the year 2100.Science287:1770–1774 DOI 10.1126/science.287.5459.1770.
Sánchez-Fernández D, Lobo JM, Abellán P, Millán A. 2011.How to identify future sampling areas when information is biased and scarce: An example using predictive models for species richness of Iberian water beetles.Journal for Nature Conservation
19:54–59DOI 10.1016/j.jnc.2010.05.003.
Sastre P, Lobo JM. 2009.Taxonomist survey biases and the unveiling of biodiversity patterns.Biological Conservation142:462–467DOI 10.1016/j.biocon.2008.11.002. Sieber A, Uvarov NV, Baskin LM, Radeloff VC, Bateman BL, Pankov AB, Kuemmerle
T. 2015.Post-Soviet land-use change effects on large mammals’ habitat in European Russia.Biological Conservation191:567–576DOI 10.1016/j.biocon.2015.07.041. Torre I, Arrizabalaga A, Flaquer C. 2004.Three methods for assessing richness and
composition of small mammal communities.Journal of Mammalogy85:524–530. Torre I, Gracia-Quintas L, Arrizabalaga A, Baucells J, Díaz M. 2015.Are recent changes
in the terrestrial small mammal communities related to land use change? A test using pellet analyses.Ecological Research30:813–819DOI 10.1007/s11284-015-1279-x. Wagner KD, Krauss J, Steffan-Dewenter I. 2013.Butterfly diversity and historical
land cover change along an altitudinal gradient.Journal of Insect Conservation
17:1039–1046DOI 10.1007/s10841-013-9587-3.
Willis KJ, Araujo MB, Bennett KD, Figueroa-Rangel B, Froyd CA, Myers N. 2007.How can a knowledge of the past help to conserve the future? Biodiversity conservation and the relevance of long-term ecological studies.Philosophical Transactions of the