BRAND REDEFINITION AND COMMUNICATION PLAN FOR GRÂNDOLA
Miguel Jesus Rito Calado
Project submitted as partial requirement for the conferral of Master in Marketing
Supervisor:
Hélia Gonçalves Pereira, Assistant Professor, ISCTE - Lisbon University Institute DMOGG - Marketing, Operations and General Management Department
I "The world is a book and those who do not travel read only one page."
III
I.
Abstract
I.I. In English
This project was elaborated with the intention to build a communication plan for Grândola, and its wide offer, in order to draw more tourists to the municipality. Grândola is located in South-west Portugal, being mostly known for an offer of Sun and Sea, with beaches that extend for 45 Km, but it also has rural tourism component, with green and calm landscapes, making it a close to nature destination. It also has the excitement of several events and a Casino.
By analyzing the market and the current communication strategy, some points needing improvement were found, not only regarding this operational marketing vertex , but also in what concerns brand identity. With this in mind, this project is a proposal for: the redefinition of the brand Grândola, with the creation of a new image allows its affirmation, in order to be better recognized in the market; a communication plan that follows the constructed identity, where multiple marketing communication tools are used, being all aligned.
This municipality has been able to grow in the tourist industry in the last few years, but still falls behind some other national offers that have more notoriety. However, it has the best performance in the region it is inserted, Alentejo Litoral. Knowing that, this project is based on the need to grow even more.
Keywords: Brand Management, Destination Branding, Place Marketing, Communication Strategy.
IV
I.II. In Portuguese
Este projeto foi elaborado com a intenção de criar um plano de comunicação para Grândola e a sua larga oferta, de modo a atrair mais turistas ao município. Grândola está localizada no Sudoeste de Portugal, sendo principalmente conhecida pela sua oferta em Sol e Mar, com praias que se estendem por 45 Km, mas também por uma componente de turismo rural, com planícies calmas e verdes, sendo assim um destino próximo da natureza. Também tem ainda a diversão de diversos eventos e um Casino.
Ao analisar o mercado e a atual estratégia de comunicação, foram descobertos alguns pontos que necessitam de melhoria, não apenas neste vértice do marketing operacional, mas também no que diz respeito à identidade da marca. Com isto em mente, este projeto apresenta uma proposta para: a redefinição da marca de Grândola, com a criação de uma nova imagem que permita a sua afirmação, de modo a ser mais facilmente reconhecida no mercado; um plano de comunicação que segue a identidade construída, onde múltiplas ferramentas de marketing são utilizadas de forma alinhada.
Este município tem conseguido crescer no sector do turismo nos últimos anos, mas continua atrás de outras ofertas nacionais que têm maior notoriedade. Contudo, tem o melhor desempenho da região do Litoral Alentejano. Sabendo isto, este projeto é baseado na necessidade de continuar a crescer.
Palavras-Chave: Gestão de Marca, Destination Branding, Marketing de Locais e Estratégia de Comunicação.
V
II. Acknowledgments
I would firstly like to thank my parents for the emotional and financial support in pursuing my degree of Master in Marketing, for their support and assistance in my decisions.
Thank you to my supervisor, Prof Doctor Hélia Gonçalves Pereira, for the availability to answer my questions and doubts, sympathy and guidance to achieve the best thesis possible.
I would also like to thank for the support of Dr. Pedro Beato and the Tourism Department of Grândola, and Mr. Carlos da Silva and Mrs. Raquel Zeferino from Costa Alentejana (respectively, Executive Vice-President and Assistant of Directing Management). Also, Dr. Elsa Dias (Directing Manager) and MSc. Francisco Dias from Barradas da Serra, Dr. Ana Paula Chainho (Directing Manager) from Hotel D. Jorge Lencastre and Dr. Miguel de Andrade (General Manager) from Tróia Design Hotel.
Finally I would like to thank my colleagues, especially João Santos and Ana Queirós for their support and good humor, and my friends that kept me cool under pressure and made me keep on going to achieve my objectives.
VII
III. Index
1. Executive Summary ... 1 2. Literature Review ... 3 2.1. Introduction ... 3 2.2. Place Marketing ... 3 2.2.1.Tourism Marketing ... 3 2.2.2.Place Branding... 4 2.3. What is a Brand?... 4 2.3.1.Destination Branding ... 52.3.2.Place Brand Management ... 5
2.3.3.Geographical Application ... 6
2.4. The importance of “selling” the Place ... 6
2.4.1.Place as a Product ... 6
2.4.2.Targeting the Consumer ... 7
2.5. Product (Place) Life Cycle ... 8
2.6. Communication Strategy ... 8
2.6.1.Communication Objectives ... 10
2.6.2.Communication Tools ... 11
2.6.3.Digital Communication ... 13
VIII
4. Contextualization ... 16
4.1. Tourism Industry – Macro to micro ... 16
4.1.1.Tourism in the World – general overview ... 16
4.1.2.Tourism in Europe ... 18
4.1.3.Tourism in Portugal ... 20
4.1.4.Tourism in Alentejo ... 24
4.1.5.Tourism in Alentejo Litoral - Costa Alentejana ... 26
4.1.6. Tourism in Grândola – a part of Costa Alentejana ... 28
4.2. Marketing Trends – What has Tourism to understand? ... 30
4.2.1.Demographic Trends ... 30
4.2.2.Environmental and Healthy trends ... 32
4.2.3.Economic Crisis – the Low Budget Trend ... 32
4.2.4.Technology – Every information, everywhere ... 33
4.2.5.Competition and Coopetition – United in Battle ... 34
4.3. The Product “Grândola” – current Product and Communication Strategy 35 4.3.1.Grândola’s Geography – Territory Definition ... 35
4.3.1.1. Accessibility ... 36
4.3.2.Characterization of the offer ... 37
4.3.2.1. Hospitality ... 37
IX
4.3.2.2. Events – Entertainment, Culture and Sports ... 40
4.3.2.3. Places to visit and enjoy ... 41
4.3.2.3.1. Beaches ... 41 4.3.2.3.2. Entertainment ... 42 4.3.2.3.3. Museums ... 42 4.3.2.3.4. Architectonic Patrimony ... 42 4.3.2.3.5. Archeological Patrimony ... 43 4.3.2.3.6. Tourism Posts ... 43
4.3.3.The Brand “Grândola” ... 43
4.3.4.Strategy ... 45
4.3.5.Communicating Grândola – current state ... 47
4.4. Market Perspective ... 49
4.4.1.Grândola’s Competition ... 49
4.4.2.Benchmarking... 50
4.4.2.1. Foz do Iguaçu ... 50
X
5. Implementation Proposition ... 54
5.1. Definition of the strategy ... 54
5.2. Brand Reformulation ... 57
5.2.1.Name and Symbol - Logotype ... 58
5.2.2.Color ... 59
5.2.3.Typography... 59
5.2.4.Slogan and Straplines ... 60
5.2.5.Tone of Voice (TOV) ... 60
5.2.6.Imagery ... 60
5.3. Communication Objectives ... 60
5.4. The Plan ... 62
6. Conclusions and Recommendations ... 72
7. Bibliography ... 74
8. Annexes ... 80
8.1. Annex 1 - Interview Guides... 80
8.2. Annex 2: Conception process of the new logotype ... 82
8.3. Annex 3 – Exceptions to the logotype usage rules ... 83
8.4. Annex 4 – Proposition of Facebook communication ... 84
8.5. Annex 4 – Detailed Investment Calculations ... 88
8.6. Annex 5 – Calendar summary ... 91
1
1. Executive Summary
Grândola is a small municipality with big characteristics and touristic offer, located in Alentejo Litoral, a coastal region that is part of Alentejo, in southern Portugal. It has been growing in the last few years, having had close to 60 thousand guests in 2011, 10 thousand more than in 2010 and the total of nights spent also grew by 26%. Yet, this growth has been slowing down since 2009. It is also important to mention that it is ahead of the other municipalities of Alentejo Litoral in what concerns income from accommodation, showing a result that is 40% of this region. These numbers only comprehend staying visitors, being that it should be added the number of visitors attending events and other determined experiences, that also get to see and feel Grândola, which also contribute to the municipality’s economy. As data showed, 90% of the current demand for Grândola is Portuguese. With this information, this proposal has this target as its main focus. For the foreign market, communication should be made through Turismo do Alentejo, which has more notoriety oversees. When and if these external markets start to better know this offer, Grândola can try to communicate more directly.
The whole tourism industry is on the rise, growing currently and with expectations to grow (at least) for the next 30 years. In the end of 2012, the number of tourist travelling around the globe hit the 1 billion mark and it is expected that (if predictions stay true) in the decade of 2030 it will be almost 2 billion. This industry is of great value to the economy and, if destinations are able to keep up with the demand, they will be able to accompany this promising growth. With this need to adapt and grow, this project has the intent to develop a communication plan proposition for the destination of Grândola.
This project has consideration for the remarks made by Dr. Pedro Beato from the Municipal Council of Grândola and Mr. Carlos Silva from Costa Alentejana, thus trying to also follow other needs and good strategic options that were observed already by these entities. Also, market players were listened to (Barradas da Serra, Hotel D. Jorge Lencastre and Tróia Design Hotel) to better understand the offer and how it can be aggregated in a neat package.
2 With the internal analysis of this destination and brand, there were made conclusions that pointed to a re-design and redefinition of the brand identity, has the existing had disperse values and attributes, and a diffuse way to present them, existing a point in time where the brand had two distinct images. Hence, this project is more than a communication proposal, having also a proposition of a new brand, with a new image that is more direct in translating what the offer is and with a set of brand elements that come together to form a consistent brand, “Grândola, Um Paraíso no Alentejo”.
The resulting communication plan follows the new brand identity (assuming that its presentation was prior to the beginning of the plan) and is a multi-means plan, ranging from the traditional brochures and transitioning to digital communication with the usage of a website and social media marketing platforms such as Facebook and YouTube. The investment in the short to medium term is of € 51.340, incrementing to € 83.340 in the long term (value influenced mainly due to the investment in the new website. Content like facebook posts, photography and short videos should be made in-house in order to not increase exponentially the value of the investment.
It is important to foment the destination of Grândola, unifying the brand strategy and the communication (aligned with the offer). It is important to start a more active plan like the presented to strive in this market when its growing, and to set an example for this region, being Grândola the main player of Alentejo Litoral and in the pole position of Alentejo.
3
2. Literature Review
2.1.
Introduction
As regions, cities and municipalities are recurring to techniques to get themselves on the map, a set of terms have risen, such as “Place Branding”, “Place Marketing”, “City Branding”, “City Marketing” and “Destination Branding”. These play a major role in the effectiveness and cohesiveness of a communication and are, therefore, important to understand.
2.2.
Place Marketing
Place Marketing (or Place Promotion) is a notion that exists since colonial times, when, without the notion of what marketing were, the governments who had “acquired” new territories would persuade people in order to move to those (Avraham, 2004), but its popularity in literature came in the 1980s. Defining the concept, Place Marketing is the “re-evaluation and re-presentation of place to create and market a new image for localities to enhance their competitive position in attracting or retaining resources” (Short, et al., 2004: 318 in Avrham, 2004: 472), which means that it portrays the efforts taken in order to set the place in the map and to draw attention to it. Another definition by the American Marketing Association (AMA, n.d.) is that it is a field that is used to “influence audiences to behave in some positive manner with respect to the products or services associated with a specific place” which conveys a meaning that it is not only the place, but everything that is associated with it. This is also indicative that place marketing is relatively close to “regular” products marketing, in a conceptual way.
Promoting and Marketing places is something that actively started in the 1990s and has been contributed ever since to the competitiveness and economic development of those places (Kotler, 2002). (Short, et al., p.318 in Avrham 2004, p. 472)
2.2.1. Tourism Marketing
As defined by the World Tourism Organization (WTO, 1995) in the ’91 WTO Ottawa Conference on Travel and Tourism Statistics, tourism comprehends “the activities of persons traveling to and staying in places outside their usual environment
4 (…) for leisure, business and other purposes”. So, tourism is more than traveling to a place, but all the things that you do during that are done during that journey (either if it is related to work or a vacation trip). If we are marketing the place in a touristic sense, there is a need to look up to Tourism Marketing, which is the need to attract visitors which translates in a creative and effective effort to transmit to travelers (and let them acknowledge) what is the existing offer (Kolb, 2006) go beyond what the destination is and means by showing all the possibilities that exist for the visitors to enjoy.
2.2.2. Place Branding
As stated by the European Institute for Brand Management (EURIB, n.d.), “(City) Branding refers to the application of branding techniques to geographical locations” which means that “regular” Branding is applied. In order to understand how this is applied, it is important to understand what a brand really is.
2.3.
What is a Brand?
According to the AMA (n.d.) a brand is a “name, term design, symbol, or any feature that identifies one seller’s good or service as distinct from those of other sellers” which means that it is an identifier of what the product is (and from where it comes) and in what ways it is seen as different from the competition.
Seth Godin goes a little further in his definition of brand, as it is a “set of expectations, memories, stories and relations that, taken together, account for a consumer’s decision to choose one product or service over another” (Godin, 2009) which is more complete in the sense that it is not only about the product but also the relation with it. In this sense, a brand is more than an identity, it is a full personality. Godin still adds that a brand only exists for a given consumer if he willing to pay a premium for it, if he makes a selection and if he is eager to spread the word on it.
In a Study made by de Chernatony and Segal-Horn (2003) the three most important aspects for successful (service) brand management are: Focused position, Brand Consistency and Values. Focused Position means that brands know what their position is and that they can clearly transmit with it. It is strongly linked with communication, in order to assure that said transmission is fully comprehended by the
5 consumer. Brand Consistency is the glue the keeps all the elements coherent for asserting common perceptions for all the stakeholders. Staff is an important part of this subject in the matter that they are the first who need to understand the nature of the brand through the organization. Finally, Values are part of the personality and these will create trust and commitment between the stakeholders, being that the organization will portray the core values in its behavior (i.e. it is not enough to say what the values are, being needed to show that the organization is committed to them). (Baker, 2007, p. 26)
2.3.1. Destination Branding
Destination Branding is the application of branding to places and it is translated in “the totality of perceptions, thoughts and feelings that customers hold about a place”, being that Destination Branding is “an organizing principle that involves orchestrating the messages and experiences associated with the place to ensure that they are distinctive, compelling, memorable, and rewarding as possible” (Baker, 2007: 26) meaning that it acts as a personality that should be well thought and consistent, that represents what we are known for, what makes it different (yet better) and the thoughts that are exposed to the remembrance of the place’s name. In a short way, destination branding is a way of improved tourism marketing, as a whole identity is created around a place instead of randomly promoting it with inconsistent messages. (de Chernatony & Segal-Horn, 2003)
2.3.2. Place Brand Management
The place, as a product, is managed by a “complex organization of public and private sector stakeholders, making it difficult to present a consistent brand proposition” (Hankinson, 2004 a: 112), therefore it is more a process of coordination than management. With this in mind, managing a region or municipality like Grândola is coordinating the entire offer, that may be presented by several dispersed entities but, at an ultimate level, are part of a representative whole of the brand identity. The same author still defends that the coordination of the place is usually on the hand of local authorities, like the city council, being subjective to political control, or other related authorities (which in this case can be the Tourism of Alentejo and Tourism of Portugal
6 entities). Also the budget may run low, meaning that the available capital for marketing, and following promotion, is indeed scarce, so everything needs an extra planning care.
There still lies a question: How different is working on a Place Brand from a regular product Brand? “We can think of the running of countries as being no different from the running of a large company and therefore apply brand thinking to countries” (Gilmore, 2002: 283) which makes it possible to use already known methodologies in the field of Branding and Brand management. This author refers to countries, but, as indicated in the next topic, Place Brands can exist for different types of places.(Hankinson G. , 2004 a)
2.3.3. Geographical Application
Place Branding is a concept that can be applied to a palette of geographic designations. It is applicable to cities, regions, countries, and even small scale ones like shopping destinations and leisure parks (Hankinson, 2005) which means that Grândola can be branded as a Municipality, Village, and also the inner areas like the beaches, for example. (Hankinson G. , 2005)(Gilmore, 2002, p. 283)
2.4.
The importance of “selling” the Place
Knowing the importance of this industry it is easier to understand why this type of brand is so important. “Branding [a Destination] can make an effective contribution to the economic development of places” (Hankinson, 2004 b: 6) meaning that by branding a place it is easier to “sell” it and further foment its evolution. Given that, it is obvious that destinations are taking an active step in marketing instead of relying passively on their attributes. (Hankinson G. , 2004 b, p. 6)
2.4.1. Place as a Product
Places are marketing themselves actively (they can be countries, regions and cities, meaning that it can be made in different scales) and the strategies are to achieve a certain degree of consideration and recognition through their own characteristics (showing and improving on the offer) and/or by being associated with major events (being the case of European Capital of Culture or host of the Olympic Games, for example) (Hankinson, 2007). So, the two main strategies are to promote what we have
7 and do, and refreshing the offer, and to “bring” events to the region that have, at least national, importance and that may be covered by the media. These two strategies are not mutually exclusive, as both can be procured. (Hankinson G. , 2007)
There could be the problem that branding a place could be different from a regular product or company. In that sense (Leissen, 2001) considers that the image rather than the product itself determines the consideration of that brand in the consumer's choice process, being a result of a set of external influencers (media, political, historical, etc.) that can go beyond the control of marketers. This is why the management of this product is more a process of coordination (as also mentioned in the Place Brand Management topic – 2.3.2.). The same author observed that destinations are perceived differently by different segments. Also “strategic image management is the ongoing process of researching a place’s image amongst its audiences, segmenting and targeting its specific audiences” and that the positioning helps to “support its desired image” and should be used to communicate “those attractions to target groups” (Gertner & Kotler, 2004: 51). We can even add that it should also be matched with lifestyle variables, experiences and usage occasions (Balakrishnan, 2009). As it is seen, places are marketed using the same basic marketing tools as classical product. (Gertner & Kotler, 2004, p. 51)
2.4.2. Targeting the Consumer
In order to successfully “persuade” our customer we need to understand to whom we are marketing it. There are four main target markets for place marketers which are the Visitors, Residents and Workers, Business and industry, and Export markets (Gertner & Kotler, 2004). The first group comprehends Business visitors (who the main visit purpose is business related like meetings, conventions, congresses, etc.) and the Non-business visitors (who are the tourists and travelers that have leisure as a visit reason). The second group can be divided in Professionals, Workers (skilled and unskilled), Wealthy Individuals, Investors and Entrepreneurs. The third group mainly consists of Heavy and “Clean” Industry and Entrepreneurs. As a final target market, the Export Markets are other possible localities in the domestic markets and international markets.
8 By using segmentation instead of a broad approach (having multiple offers vs. having a single undifferentiated offer) the destination marketer can “target these segments and further enhance their image, so that the destination becomes favorable over other areas at the point these people make their travel decisions” (Leissen, 2001). From this, there is a conclusion, that branding a place is not so different from a day-to-day product, in the matter that a Segmentation, Target and Positioning analysis is needed in both cases, if we are to create a clear and delightful image of what we are “selling” and to, in fact, “sell” it.
2.5.
Product (Place) Life Cycle
In the same way that some products dye out a little, the same happens in the tourism industry with destinations, becoming “fatally fatigued, having failed to maintain long-term marketing and advertising effort, or have been affected by external change” (Morgan, Pritchard and Pride, 2004: 68). The same author also defends that “no destination brand can ever remain static” as development and refreshment are needed, which would be one of the main concerns of the marketers as the brand is established in the market or else we are doomed to stagnation loss of brand power. If and when their image becomes fading away the strategies would pass by “repositioning, reinventing, or doing nothing and maintaining the status quo (and possibly the downward spiral)” because, not like consumer brands, it is not possible “sell the city or kill it off “ (Baker, 2007: 50). (Morgan, Pritchard, & Pride, 2004, p. 68) (Baker, 2007, p. 50)
2.6.
Communication Strategy
As this element of the Marketing-Mix is the main focus for this study there is also needed to understand the tools and underlying “rules” of the communication. It is important also to mention what Integrated Marketing Communication is, being the process of “planning, creation, integration, and implementation of diverse forms of marcom [marketing communication] (…) that are delivered over time to a brand’s targeting customers and prospects” (Schimp, 2010: 10), meaning that we no longer talk to the customers in a single platform and that the story is told through different means, having each other its own level of importance. The integration of all the elements will then provide a more efficient result, considering that the message remains consistent
9 through the different means, and that what is communicated is aligned with the overall strategy (thus accenting its positioning) (Argenti, Howell, & Beck, 2005).
In order to define the communication strategy there are some steps which should be taken into account to have a structured plan. Different authors point to an identical set of steps, having slight differences in the conceptualization of each steps (and sometimes in the occultation of others). A rough aggregation from different authors points to the following steps (Bennet & Strydom, 2001; Lindon, et al., 2008): (Shimp, 2010, p. 10)
1. Understand Positioning/Opportunity: how the organization stands on this
field, what is being done and how, and who is/should be the clients (or what the current opportunity that is relevant to communicate is);
2. Define/comprehend the global communication policy: the guiding
scheme of the image and the role of communication in the organization; 3. Creation of communication objectives: the goal(s) that should the new
communication campaign needs to (realistically) attain to;
4. Message definition: characterization of what needs to be communicated,
what is the tone of said communication (which should be aligned with the identity and tone of voice of the organization);
5. Conception of the communication-mix: the means that are used and how
they are connected to transmit a coherent message;
6. Budgeting: define how much can be invested in the plan and understand if
the investment worth making, i.e. will it help to generate profit? Given the current economy, cheaper (but still efficient) means ought to be pursued; 7. Implementation;(Bennet & Strydom, 2001) and (Lindon, Lendrevie, Lévy, Dionisio, & Rodrigues, 2008)
8. Results Analysis/measurement: verify the effectiveness and efficiency of
10
2.6.1. Communication Objectives
To understand and have an effective and efficient usage of the communication tools there is first the necessity of setting the objectives of the communication plan. These objectives need to be quantifiable, with an accurate deadline, precise, clear, attainable and measurable. These objectives will provide guidance for everybody allocated with the conception of the plan, giving decision criteria and, in a final step, evaluation of the communication results. There are three main types of objectives: Get Known, Create Likeness and Create Action, as seen in table 1 (Brochard, et al, 2010).
Table 1 Communication Objectives
Get Known • Notoriety • Inform • Promote
Experimentation • Spread the Product • Demonstrate • Stimulate Purchase • Positioning • Present to Audience Create Likeness • Promote Loyalty • Blur Seasonality • Create Credibility • Promote the Image • Sell
• Product Drain • Transmit Trust • Create Envolvement
Create Action • Visit the Website • Share Experiences • Mobilize • Invigorate • Generate Leads • Generate Web Conversion • Generate Buzz • Create Engagement Source: Publicitor (2010)
11
2.6.2. Communication Tools
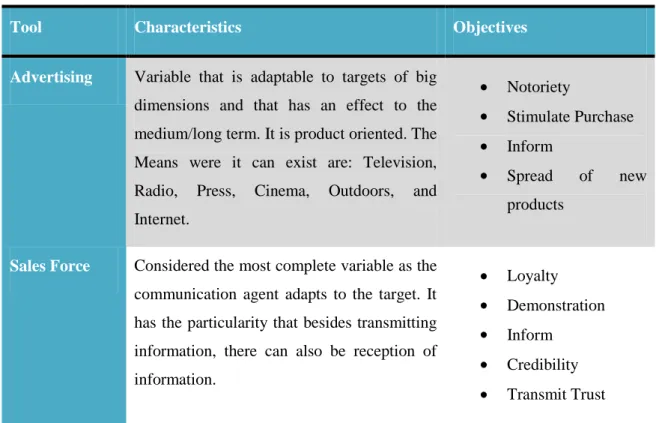
There are a number of communication tools that a marketer has at his disposal to create a communication plan. The tool that generally stands out the most is advertising, being that it is the tool by which most tourists get access to information. Also brochures have a big importance in tourism as they function as an informational piece to both show the destination and promote it (call to action). With the evolution of technology (see X[Contextualization part] Technology – Every Information, Everywhere), there have been created (and exploited) new means and ways to show/promote the touristic offer, such as 3d mapping and interactive animations, being readily accessible from the Smartphone in the pocket (Almeida, et al., 2012). In table 2, the main communication tools are characterized with also the indication of what communication objectives they suit best. (Almeida, Silva, Mendes, & Valle, 2012)
Table 2 Communication Tools and their Objectives
Tool Characteristics Objectives
Advertising Variable that is adaptable to targets of big
dimensions and that has an effect to the medium/long term. It is product oriented. The Means were it can exist are: Television, Radio, Press, Cinema, Outdoors, and Internet. Notoriety Stimulate Purchase Inform Spread of new products
Sales Force Considered the most complete variable as the
communication agent adapts to the target. It has the particularity that besides transmitting information, there can also be reception of information. Loyalty Demonstration Inform Credibility Transmit Trust
12
Direct Marketing
Similar to the Sales force as there exists bilateral communication. It is used for precise and well defined targets, having an effect of short/medium term. Loyalty Inform Spread of new products Stimulate client action Sponsorship and Patronage
Variables of short/medium term effect that, even though they can be used for product/brand communication, are more adequate to institutional communication. Sponsorship has commercial intent while Patronage is more directed to social valorization. The target is linked to the event or entity sponsored. In the case of patronage it is for a broader audience.
Notoriety Positioning Credibility Transmit Trust Public Relations
Adaptable to the generality of audiences. It is more used internally and specific social groups. Image Improvement Credibility Involvement Inform Present to audience Improve Notoriety
Promotions Exclusive for product communications, with
an impact in the short-term, happening in the specific moment of purchase.
Spread of new products Stimulate Purchase Promote Experimentation Blur Seasonality
13
Merchandising It is the collocation, in a persuading way, of
product in the “way of the clients”. It is the way the products are displayed to the audience, creating visibility.
Sell
Create Involvement
Source: Publicitor (2010) and Mercator XXI (2008) (adapted)
2.6.3.
Digital Communication
The internet has allowed a bidirectional transmission of information, an almost instantaneous interaction, between companies and their stakeholders (other companies/entities that cooperate with us, potential and current customers and local groups) with low costs and in any part of the world. This interaction is held mainly through web-sites and social media. The usage popularity of this mean has been rising in tourism (both for destinations and businesses).
Web-sites can be characterized as a storefront (and can also be developed in to a full store) of a company, being important to look sharp, easy to access and, as mentioned before for the digital means, to be interactive (as it is important to have someone to attend our needs/questions in a physical store, the same may be applied to a digital one). In the case of Greece, they created a completely functioning and informational web-site but have failed in the point of interaction by not offering the transition from information to reservation and to develop customer interfaces (Buhalis & Deimezi, 2004).
Besides the interaction, there are some important factors to take in account. The tourists need free information and so, the destination’s website should provide photos (and videos/animations), directions, lodging and activities to do. Also the design is very important, which should allow an easy perception of what’s being presented, by being user-friendly, graphically balanced, and having clearly organized information. The well organized content and structure is a must for the ease of use, but it is also important for the usage of search engines to get to the site – Search Engine Optimization. Also in this topic, usage of clear domain names, Meta descriptions and captions will help to fairly rank the web-site in the organic search results (not associated to cost). Finally, the
14 promotion of the website should be both online (social media marketing and web-display) and offline (brochures, print advertisements, etc.) (Rita, 2000; Google, 2010).
A study realized in the United States of America by Youcheng Wang (2008) pointed that the most popular web-sites applications are Information of Activities/attractions and Accommodation, the Events calendar, Restaurant information, Shopping information, links to regional pages, maps and travel guides/brochures (their availability of the capability to request them). In what concerns the promotion of the website, the preferred means are in the organization’s print materials, search engines and magazine ads. Finally, the most used measurement techniques are the number of hits, page views, and unique users. (Wang, 2008) (Rita, 2000). (Google, 2010)
Apart from the web-site there are a couple of ways to use the Digital platform as a mean of communication. Firstly, Web display (mostly known for banner ads) is a form of digital advertisement, which is a graphical element (static, dynamic and/or interactive) that allows bringing a prospect to the website in a single click. There are also sponsored links that are advertisements usually associated with search engines, having a cost associated to each keyword, but paying only per click. These are text links that will direct the user to the desired landing page. The costs of these are usually “cost-per-click”, depending from sizes and place of application. Finally, in the set of most used digital tools, there is social marketing that as a big importance, as it is a mean of interaction using platforms that are used in a social manner by many users like facebook, twitter, foursquare and other user-generated content websites.(Brochard, et al. 2010). (Brochard, Dionisio, Vicente, & De Baynast, 2010)
15
3. Methods and techniques of data collection and
analysis
The research methodology for data collection comprehends the qualitative method of semi-structured interviews with Dr. Pedro Beato, Chief of the Personal Support Office of the Presidency (representing the of the Municipality Council of Grândola) and the Executive Vice-President of Costa Alentejana (coordinating entity and brand of the littoral Alentejo Tourism) Mr. Carlos Silva in order to know the current touristic strategy for this destination and how these brands have been evolving. Also to better understand the hospitality offer it was decided also to realize semi-structured interviews to 3 different types of accommodation services: Herdade Barradas da Serra (Rural Tourism facility in the periphery of Grândola’s village), 3 star Hotel D. Jorge de Lencastre (average service hotel located in the middle of the village) and 5 star Blue&Green Tróia Design Hotel (high profile and quality hotel located in Tróia) (see interview guides in Annex 1).
As far as obtaining quantitative data, search was done upon documents, such as reports elaborated by tourism and statistics entities (e.g. Statistics Portugal, World Travel Organization and World Travel & Tourism Council), journals, magazines and websites, i.e. secondary research that allowed the development of literature review as well as contextualization.
16
4. Contextualization
4.1.
Tourism Industry – Macro to micro
4.1.1. Tourism in the World – general overview
The tourism industry is moving masses every year, and it has been growing every year. The total international arrivals have more than doubled in the last couple of decades, being that in 1990 there were 435 million arrivals and that in 2010 there were 940 million (United Nations World Travel Organization – UNWTO, 2012). The industry grew by 3% in 2011, with a (direct) contribution of 2,8% to the world GDP, and with total contribution of 9,1%, which means that the industry of tourism accounts for almost a tenth of the market value of the entire world’s production, therefore being a driver of economies and development. Estimations for 2012 look for a growth of 2.8% and, in long-term (to 2022) there is an expected annual growth of 4.2% which shows the still growing and future importance of this sector. Besides the high contribution to the GDP, this market represented 3,3% of the world’s employment in 2011, growing to 3,4% in 2012 (and speaking only in matter of direct contribution; total contribution results in 8,7% of employment) (World Travel and Tourism Council - WTTC, 2012 a; Central of Intelligence Agency - CIA, 2012). (WTTC, 2012 a) (CIA, 2012)(UNWTO, 2012)
In matter of arrivals, the UNWTO (2012) expects a growth that will lead to around 1.4 billion arrivals for 2020 and 1.8 billion for 2030, if the positive pace is to continue. The reality of these numbers can be real and close to achieve because as of the (13th) December 2012, the number of tourist travelling around the globe hit the 1 billion mark, incrementing the economic importance of this sector, despite times of socio-economical crisis (WTTC, 2012 b).
Even though this industry is in growth, seasonality plays a major role in the arrivals distribution during the whole year. From 2008 to 2011, the month of July has been the peak for this industry, with August taking the second. This seasonality may be hard to overcome, but it is easy to explain: The countries (regions) with the highest number of tourist arrivals are mainly in the northern hemisphere and the months of July
17 and August (plus June) are the hottest months in the mentioned hemisphere. This warmer weather is ideal for Leisure, recreation and holidays, being the major purpose of visit with 51% of all inbound tourism. Even though that in a whole world sense the seasonality is still rather strong, alternatives have been sought and developed in order for the industry to thrive during the lower season (Business tourism has been growing, achieving, in 2011, 15% of the purpose of visit) (UNWTO, 2012). It is in this season where competition is more notable, mainly based on price, but also in the creation of new solutions, thus diversifying the offer. But, independently of the season, and with the high economical value of the sector, competition is ranked strong through the whole year, fighting for the tourist’s shrinking wallet.
Apart from the seasonality there are factors that change drastically the industry, leaving regions drastically weakened, being unattractive such as:
Natural catastrophes: such as the 2004 Indian Ocean earthquake and tsunami (that left naturally beautiful countries like Thailand, Indonesia, the Maldives and Seychelles decimated, not prone for tourism due to the destruction of the landscape and fear of it happening again) and the 2010 eruptions of Eyjafjallajökull in Iceland (which caused a commotion in the air travel across northern and western Europe, closing 20 countries’ airspace, retaining hundreds of thousands on the ground (UNEP, 2011)); Diseases: the Severe Acute Respiratory Syndrome (SARS) (affected heavily the tourism in western Asia, concerning tourist arrivals dropping from 10% to 50% (Wilks & Moore, 2004)).
Terrorism: happenings such as the drastic attacks of 9/11 in the USA (which raised the fear of flying) and the 2011 Norway attacks (which were directed targeted at a summer camp).
Politics: the protests since 2010 in Greece took a quick turn of events, resulting in riots, transforming a destination found of culture into urban destruction and the 2011 Egyptian revolution created highly instability, thus creating the sense of insecurity.
18 Finally, trying to define the likes and preferences of the tourists, besides the likeness of warmth, they seek mainly Leisure (51%) as referred before, then visiting friends and relatives, health and religion (27%), then business (15%). The most visited region in 2011 was Europe (504M), followed by Asia and the Pacific (204,4M), Americas (156,6M) and at the bottom Middle East and Africa (55,4M and 50,2M, respectively). France is at the top of the worlds visit list, with almost 80 million visits in 2011) (UNWTO, 2012). On a final note, domestic spending is at 70.5%, which means a wide majority opts for discovering its own country/region, growing at a wider rate (4.6% to 2022) than foreign visitor spending (3.6%) (WTTC, 2012 c). On an important note about the tourist: they are increasingly more informed (information technology plays a major role in this part.
4.1.2. Tourism in Europe
Europe stretches from the cold northern climates to the warmth of the southern regions, stretching also in cultural levels as the diversity from region to region and country to country is immense, thus offering a wide variety of touristic products.
According to the Eurostat (2012), there was a total of 2.233 million nights spent in Europe in the year 2010, which means that very day, on average, there are at least 6 million tourists in Europe (only including the ones who spend the night in hotels, campsites and other accommodation facilities, thus excluding friends, family and others). Also, from these nights, 40,4% (902M) are of non-residents. (Eurostat, 2012)
As referred in the previous section, Europe is the region with the highest share of arrivals (504M). Fortunately, this continent has a great sense of culture and diversity and, in the same way that foreign visitors from other continents look up to Europe for such strength, so do the Europeans and visit various countries within the region, instead of going to visit some country in a different continent.
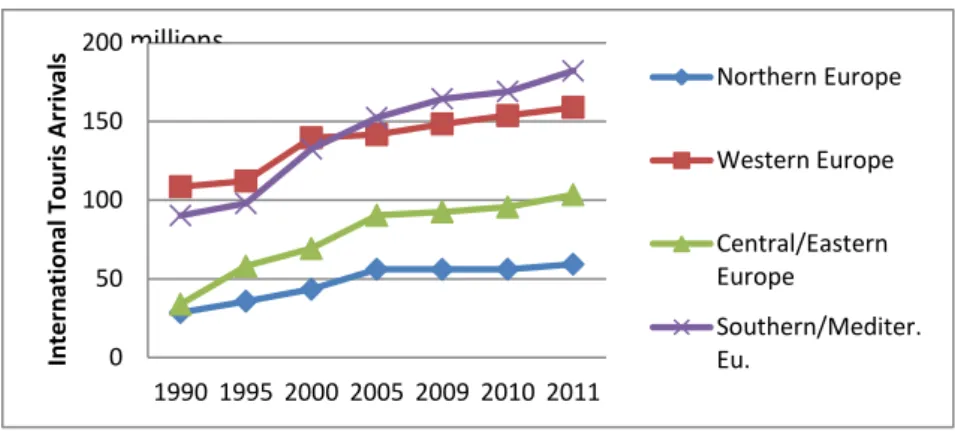
Europe itself is then divided in a set of regions that show different levels of international tourist arrivals and variations shown in the graphic 1.
19
Graphic 1 Evolution of International Tourist Arrivals to Europe.
Source: UNWTO Tourism highlights 2012 Edition
Between 2000 and 2005 the Southern/Mediterranean region took the leading in the group, with 10 million more arrivals then Western Europe (which was having a lagging growth), by 2005. Southern/Mediter.Europe has a tremendous market share of 18.5 %, being the sub-region more visited in the world. In 2011 the receipts in Europe were of 332.9 Billion Euros (with an increase of 5% comparing to 2010), achieving a share of 45%, and being also at the top of the world in this category, which translates in an average of 660 Euros per arrival, falling behind Asia and the Pacific (960 Euros per arrival) and the Americas (910 Euros per Arrival). By 2011 the region of Southern/Mediterranean Europe was also ranked at the top with 126.9 Billion Euros of receipts, with only other one European region above the 100 line, Western Europe (and only two other sub-regions in the world: North America and North East Asia). Comparing to 2010, the real growth was of 5% for this region. The most visited country in this sub-region is Spain, with almost 57 million arrivals. Here, in the neighborhood, Portugal is close to 50 million arrivals short, with a count of 7.4 million arrivals. Still there is yet France with almost 80 million arrivals, leading Europe and the World. But if we are to look at receipts, Portugal wins over Spain and France, with close to 1530 Euros per arrival (UNWTO, 2012).
0 50 100 150 200 1990 1995 2000 2005 2009 2010 2011 In te rn ati o n al To u ri s A rr iv al s Northern Europe Western Europe Central/Eastern Europe Southern/Mediter. Eu. millions
20
4.1.3. Tourism in Portugal
The Travel and Tourism Industry in Portugal as a direct contribution in 2011 to the GDP of 5.3% (9.2 Billion Euros) and the total (direct + indirect + induced) contribution to the national GDP is 15.2% (26.2 Billion Euros), showing the importance of the sector. Given the forecast of a growth of 1.7% of the direct GDP contribution till 2022 and a growth of 1.8% of the total contribution (surpassing the 30 Billion Euro mark), this is an industry suitable for investment (WTTC, 2012 d).
The year of 2012 was a record year for the industry in Portugal, as foreign arrivals achieved the biggest number yet recorded but also, with the economic crisis sinking in, less money was made by hotels (proportionally), as margins were reduced in an attempt to attract customers, which seemed to work (Khalip, 2013).
As mentioned before, Portugal is part of the most visited region of Europe and it can be found in the westernmost part of continental Europe, bathed by the Atlantic Ocean and the warmness of the Gulf Stream, “Europe’s Central Heating”, which renders an interesting mild climate for tourism. Besides the regular warmness, it heats up in the summer, contributing significantly to the effect of seasonality, being that, in 2011, 39.5% of total nights spent in Portugal were between July and September (and this effect has been growing since 2006) (Instituto Nacional de Estatística - INE, 2012 a). This season serves as an economic pillow for tourism, helping to support businesses from the cripple effects of the economical crisis. However, José Manuel Esteves, General Secretary of AHRESP (Associação de Hotelaria, Restaurantes e similares de Portugal) warned that this season is not continuing to be the salvation of touristic businesses, because this touristic audience is consuming and spending less. He even added that taxation, (VAT with Restaurants at a maximum of 23%) is pushing businesses down as consumption decreases and drawing tourists away (Económico, 2012). With the maintenance of this VAT through 2013, the volume of the restaurants sector will decrease € 1.750 millions (a contrary decision would create a benefit of € 854 millions), with a significant impact to the tourism sector (AHRESP, 2012). Mário Pereira, President of AHRESP, considers that this is destroying the offer of the touristic
21 sector (AHRESP, 2012). Even David Scowsill, President and CEO of WTTC, warned Portugal, in the annual (2012) conference of APAVT (Associação Portuguesa das Agências de Viagem e Turismo) in Coimbra, to “Stop taxing Tourism”, because even though taxation is “an easy way to raise funds”, it represents “measures that will damage tourism” (David Scowsill in Nicol, 2012). With this being referred, there is a need to rethink the taxation model and its implementation. (Nicol, 2012)
Despite the small size of the country and current economical fragility, it still offers huge variety of experiences and products that are based in the “raw materials” presented: weather conditions, natural and cultural resources. In an effort to synthesize this offer, 10 strategic tourism products were consolidated in the national touristic plan (PENT, 2007) and developed being: Sun and Sea, Cultural and Landscape Touring,
City Break, Business Tourism, Nature Tourism, Nautical Tourism, Health and Well-being, Golf, Resorts and Residential tourism, and Gastronomy and Wines.
This array of product is distributed throughout the whole country, being possible to have different experiences around the same product category.
In order to easily define strategies, there were also created 3 groups of markets, based on their potential and knowledge about Portugal, shown in table 3 on the next page. Strategic markets are the ones were Portugal is already a somewhat established destination, and where there the main share of revenue is coming from – potential revenue above the € 400M. These could be target to stimulate the low season, thus diminishing the effects of seasonality. Development markets are represented by the countries where there is intent of meaningful growth, showing good results – potential revenue between € 100M and € 250M. Diversification markets are the ones that, despite the minor share, are deemed as attractive (for their dimension and/or growth) – potential revenue below € 100M (Turismo de Portugal, ip, 2007).
22
Table 3 Groups of markets with potential for Portugal.
Source: PENT (2007)
In the matter of tourism numbers, international tourist arrivals have been growing. In two years time, from 2009 to 2011, the growth was of 1 million arrivals of foreign to our country, showing that the investment in the foreign markets is showing results (6.479M in 2009, 6.832 in 2010 and 7.432M in 2011). Unfortunately, Portugal is far away from the European market leaders, having a small market share of 3.4% (UNWTO, 2012).
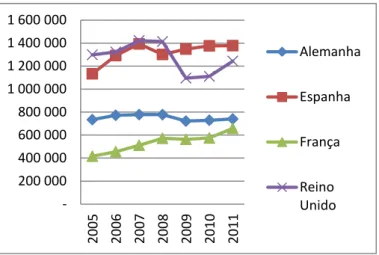
From the Strategic Markets groups, the U.K. is at the top in nights spent (recovering in 2011 from a downfall of 28% from 2007 to 2010, growing back 13% to 2011), with almost 5,5 million nights, followed by Spain taking over Germany in 2011 and then France, as seen in graphic 2. (Instituto Nacional de Estatística - INE, 2012 a)
Graphic 2 Number of nights spent by visitors from the strategic markets.
Strategic Markets • Portugal (Domesic Tourism) • United Kingdom • Spain • Germany • France Development Markets • Scandinavian Countries • Italy • U.S.A. • Japan • Brazil • Netherlands • Ireland • Belgium Diversification Markets • Austria • Switzerland • Russia • Canada • Poland • Czech Republic • Hungary • China - 2 000 000 4 000 000 6 000 000 8 000 000 10 000 000 2005 2006 2007 2008 2009 2010 2011 Alemanh a Espanha França Reino Unido
23 The biggest part of guests comes from Spain, despite being 2nd in the number of nights spent, with close to 1,4 million visitors, contrasting to almost 1.25M from the U.K.. Germany and France follow, being equally ranked as in terms of nights spent, 3rd and 4th place for the number of visitors, as seen on the next graphic 3. (Instituto Nacional de Estatística - INE, 2012 a)
Graphic 3 Number of visitors from the strategic markets.
Source Statistical Yearbook of Portugal 2011 p. 563
These numbers priory shown, adding up the remainder foreign visitors, are only 52 % of the total of hotel guests and comprehend 66% of the total nights spent (as they come from further away, the stay is longer). The remainder is constituted by the Domestic Tourism, i.e. the Portuguese tourists that roam inside Portugal. This shows the importance of Portugal being a strategic market for itself. Unfortunately, the domestic tourism was growing to 2010 but the number of nights spent declined by 2,5% in 2011 and guests also declined, by almost 2% (from 6.705.460 guests in 2010 to 6.580.537 in 2011) (Instituto Nacional de Estatística - INE, 2012 a).
Despite the growth shown priory, Revenues per Available Room (RevPAR) dropped from € 27,8 to € 26,8 from 2010 to 2012, as the prices are lowered to foment demand and also due to price competition (IMPACTUR Portugal, 2013).
- 200 000 400 000 600 000 800 000 1 000 000 1 200 000 1 400 000 1 600 000 2005 2006 2007 2008 2009 2010 2011 Alemanha Espanha França Reino Unido
24 Portugal is yet divided in several regions that are divided geographically and culturally, thus creating different regional offers: North, Center, Lisbon, Alentejo, Algarve and the Autonomous Regions of Madeira and Azores. The main touristic
regions are the Algarve (stays grew by 5.5% from 2010 to 2011, being almost 14
million), Lisbon (grew 4.7%, surpassing the 9 millions in 2011) and Autonomous
Region of Madeira (grew 11.5%, with over 5.6 million nights spent). Notably, in these
regions the foreign tourists have a much higher number of spent nights than the national tourists. The Algarve is an already established brand outside Portugal and looked mainly for its Sun and Sea (Beaches) and nightlife. Lisbon, being the capital of Portugal, and where the main Portuguese airport is, is a congregator of international arrivals. The regions with the lowest demand are Alentejo (even with a growth of 6% to 1.243.652 nights spent) and the A.R. of Azores (with a slight decrease of 0.15%) (Instituto Nacional de Estatística - INE, 2012 a).
4.1.4.
Tourism in Alentejo
Grândola is located in the Alentejo region (to be more specific, in the Alentejo Litoral, so it is important to understand the characteristics of this region. Alentejo has an extension that accounts for 30% of Continental Portugal, comprehending a variety of touristic offer over its extension.
As stated before, Alentejo is the Portuguese region with the second lowest level of demand in the matter of nights spent and guests but it is also the 2nd lowest in terms of lodging income - € 43M in 2011 (Instituto Nacional de Estatística - INE, 2012 a), but it is still
growing, as of 2011. Despite the huge area it represents there are several square kilometersfree of any kind of urbanization, thus having a low density of population. This is one of the aspects that tourists look for, the peacefulness and direct contact
with nature in contrast with the overcrowded urban areas.
Source: Wikipedia.pt Image 1 Alentejo's location (in red)
25 The RevPAR of the whole region of Alentejo is lower than the national indicator, being € 18.6 in 2012 (decreased from € 20.9 in 2011) (IMPACTUR Portugal, 2013).
Alentejo is itself divided in a smaller set of regions: Alentejo Litoral, Alto Alentejo, Alentejo Central, Baixo Alentejo and Leziria do Alentejo. Alentejo Litoral leads in growth the hospitality, being able to overcome Alentejo Central from 2010 to 2011 in a matter of the income from accommodation, still behind in the number of nights spent and number of guests (INE, 2012 b), as it is observed in the table 4.
Table 4 Data of number of nights spent, guests and lodging for the regions inside Alentejo.
Nights Spent
(number)
Guests (number)
Lodging Income (in thousand Euros) 2010 2011 Δ 2010 2011 Δ 2010 2011 Δ Alentejo Litoral 307195 376595 22,6% 137564 157569 14,5% 11276 14841 31,6% Alto Alentejo 183086 189742 3,6% 125729 132505 5,4% 5487 6305 14,9% Alentejo Central 403992 411336 1,8% 266401 270659 1,6% 13989 14070 0,6% Baixo Alentejo 179060 167212 -6,6% 104731 96961 -7,4% 4992 4766 -4,5% Lezíria do Alentejo 99225 98767 -0,5% 63070 60676 -3,8% 3338 3133 -6,1%
Source: Statistical Yearbook of Alentejo Region 2011 p. 423 and 425
In this region the proportion of foreign guests is smaller than the country’s average of 52%, being only 25%. As seen on the graphic 4, Alentejo Central is the region’s champion, both for the domestic market and foreign visitors, having more of the latter than the total number of guests of Baixo Alentejo and Lezíria do Tejo. (INE, 2012 b)
26
Graphic 4 Foreign guests vs. Portuguese Guests in Alentejo
Source: Statistical Yearbook of Alentejo Region 2011 (2012)
4.1.5. Tourism in Alentejo Litoral - Costa Alentejana
In a Touristic sense, Grândola does not have big notoriety on its own in Portugal, despite the quality of its offer (and is more hardly known from the other side of the frontier). Grândola is part of Litoral Alentejano which contains, apart from Grândola, Alcácer do Sal, Santiago
do Cacém, Sines and Odemira. All of this is promoted
through the entity and (more notorious) brand “Costa
Alentejana”, by showing these distinct offers in an
aggregated “package”, i.e. it promotes the offers of the region as a whole, in an attempt to have a greater effect than the sum of the individual promotion of each municipality.
The Executive Vice-President of this entity, Mr. Carlos Silva, considered that the best this region has to
offer is “its natural serenity, the sea (beach and landscape), good Gastronomy and Wine production, diversity in accommodation and the constant touristic animation”. Each
0 20 000 40 000 60 000 80 000 100 000 120 000 140 000 160 000 180 000 200 000 Total Foreign Portugal
Source: Own elaboration Image 2 Location of Costa Alentejana in Portugal.
27
municipality included here may have its own communication, but they are all aligned with the one of “Costa Alentejana” (as it was noted from the interviews).
Unfortunately, Costa Alentejana will seize to exist as an entity in a short period of time, being still unsure if it will still be kept as a brand, or if it will return to be “just another part” of Alentejo. This entity has been making a good job, improving notoriety of the region, with suiting branding and well coordinated communication. Mr. Carlos Silva opined that this region is sufficiently different from the rest of Alentejo (the coastal landscape confers a different set of offers from the interior plains) for the region to have its own definition and characterization.
In terms of demand, as seen before in Table 2, this region is the one that most
grew in Alentejo, showing the effectiveness of late promotion campaigns (which
translates in notoriety) and assertiveness of a quality offer. It is expected for demand to continue its growth as long as quality is promoted and offered.
In what concerns seasonality, in 2011, Alentejo Litoral is the region of Alentejo where it is more serious, being 49% of nights spent from July to September (was 50% in 2010), the high season (being a coastal region may have this effect, as beaches in the summer are most wanted). Seasonality is surely high, as almost 50% of the accommodation demand takes place in a quarter of the year. This indicates the need to counter seasonality, to smooth the yearly demand curve, thus having a more stable income of tourists. Also, Alentejo Litoral is the only region above Alentejo’s average of 38.5% (INE, 2012).
In a study ordered by this entity (Bloom Consulting, 2011), it was concluded that part of the brand strategy should focus on the attraction of winter tourists to reduce seasonality. In the 9 months that it is low season, when the temperature rounds the 11ºC, it can be considered as a warm destination for a tourist from the northern
Europe (where winters are severe with several degrees Celsius below zero). This study
comprehended surveys, where the main winter preference of the inquired was the warm climate (44%), showing that there is an opportunity for the “winter market”. In this matter, Mr. Carlos Silva still added that, another important market would be the seniors
28 because, as they are retired, they have the availability to travel (and stay) in the winter (and rest of the low season), in opposition to the students/workers that have, mainly, holidays in the summer. So, retired northern Europeans are an important market to bet on to ease seasonality. (Torres, 2011)
4.1.6. Tourism in Grândola – a part of Costa Alentejana
Data from the Statistics Portugal (INE, 2012) shows that, despite the low notoriety of Grândola by itself, it achieved more than 40% of the income brought by
accommodation, in 2011, in this region, making it a major player (making for only
30% in 2009). The number of guests increased in 2011 by 19% (achieving a total of 58.340 guests), and the total of nights spent grew by 26%, being 139.762 in 2011. This growth is smaller to the one that occurred from 2008 (after an inflection) to 2009 and 2009 to 2012. The capacity of accommodation in Grândola is 2.065 guests (at a given moment), as of 2011.
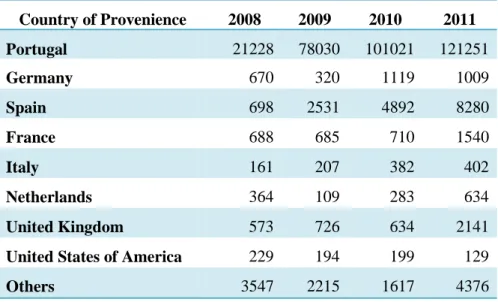
The biggest majority (90% in 2011) of the guests are Portuguese (portraying 87% of stays), which could be attributed to 2 main characteristics: Grândola has the biggest coastline, with fully accessible beaches, in Portugal, bringing tourists solely for the beach; the association with the Carnation Revolution of 1974, which brings many Portuguese to know where an important part of the Revolution began – the music “Grândola Vila Morena” is symbolic for freedom and it is known through the whole country. The remaining of stays are constituted by mainly by Spain (6%), United Kingdom (1.5%) and France (1.1%), being the rest countries of provenience below 1% each. The number of nights spent follows the same pattern, with Portugal being the main “client”, followed by Spain, the United Kingdom, France and Germany, as seen in table 5 (INE, 2012).
29
Table 5 Evolution of number of nights spent in Grândola according to the country of provenience.
Country of Provenience 2008 2009 2010 2011 Portugal 21228 78030 101021 121251 Germany 670 320 1119 1009 Spain 698 2531 4892 8280 France 688 685 710 1540 Italy 161 207 382 402 Netherlands 364 109 283 634 United Kingdom 573 726 634 2141
United States of America 229 194 199 129
Others 3547 2215 1617 4376
Source: Statistical Yearbook of Alentejo Region 2011 (2012)
Based in these numbers, the main strategic market is the Portuguese, without disdaining the foreign tourists. As Mr. Carlos Silva considers, we should still invest in the foreign markets, mainly Northern Europe (plus France). This group could be targeted for the lower season because the autumn and winter in Grândola (and Costa Alentejana) may still be warmer and more sunny than summer in those countries. The winter in this region isn’t so agitated concerning the national tourists, as the biggest hook of the region is the beach, in the mid-spring and summer.
Most of the numbers have been growing up because, as Dr. Pedro Beato said,
“the tourist that comes to Grândola once, comes back and brings a friend”,
showing that delight about the offer transforms into good word-of-mouth, “one of the most powerful promotion tools” as Dr. Pedro Beato indicated. Mr. Carlos Silva is also certain that the experience exceeds the expectations.
30
4.2.
Marketing Trends – What has Tourism to
understand?
4.2.1. Demographic Trends
Tourism is a growing market that, as any successful market, follows the main consumer trends about an array of products. It is (or should be) the consumer who dictates where something goes as a product, resulting of their needs in accordance to the evolution of the surrounding environment. Some trends, like next, have been redefining who the tourist is, how he behaves and what he seeks.
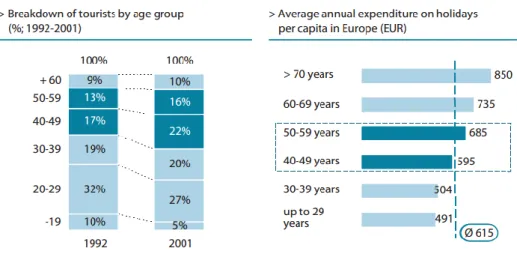
The National Strategic Plan for Tourism (mostly known by the acronym PENT in Portugal – Plano Estratégico Nacional para o Turismo) was based in tourist demographic data from 2001, which showed a big increase of the well-established segment (40 to 59), constituting 38% of tourists and a small increase in the senior segment (10% in 2001), in contrary to youth/young adults, which decreased. So, the number of tourists grows mainly in the middle/middle top of the age scale. Also data showed that older tourists have bigger expenditure, as seen in graphic 6. Nowadays, data points to different trends (Turismo de Portugal, ip, 2007).
Graphic 5 Breakdown of European tourists by age and expenditure.
Source: UNWTO (2013) in PENT (2007)
31 According to the World Tourism Organization (WTO) and European Travel Commission (ETC) report on “Demographic Change and Tourism” from 2010, has the world population increases (with almost 7.1 Billion now, it is expected to grow to 7.7 by 2020 and 8.3 by 2030 (Worldometers, 2012)) it is expected that tourism also grows. This growth is going to be more accentuated in the ends of the age spectrum (instead of the middle): Developed countries are more aged and developing countries keeps a more youthful population. Also, richness still accompanies age, being that senior tourists have more money to spent, contrary to the youth who have smaller wallets.
Nowadays the global age pyramid is wider at the top than it was several years ago (United States Census Bureau, 2006), in terms of developed countries. This is due mainly to the post-World War II baby boom and the evolution of general medical treatments that were able to extend the lives of the elderly (and general population), being able to live more and with better life quality. So the KaBoomers (Moutinho, 2012) represent a market opportunity of 60 year-olds that can be sometimes healthier than 35 year olds. Also this group has more travel availability as they’ve reached the years of retirement, meaning that with all this time in their hands, they search for new activities. All of this has been pushing the senior tourism market with offers targeted directly at this group. Furthermore, this age group is scaling up their technology knowledge, keeping up with some of the latest technologies, such as computers, video game consoles, tablets and smartphones. There is then a need to pay attention to what this age spectrum wants and what they use as information mean.(WTO and ETC, 2010)
In the developing countries, the tourists are younger (WTO and ETC, 2010) and have different sets of needs from the older tourists. This younger audience, may have lower incomes than the well established (40 to 59 years old), which translates in lower purchase power, which means that they look for cheaper options. Another implication for this age group is that they are studying or working, not having the freedom of traveling whenever they want as the retired have, thus being a more time-precise group, which further foments seasonality. As this group spends most of the year working and/or studying, they look mainly for relaxation.