BJRS
RADIATION SCIENCES
07-2A (2019) 01-09ISSN: 2319-0612 Accepted: 2018-10-27
Micro-homogeneity evaluation of a bovine kidney
can-didate reference material
L. Castro
a, E. G. Moreira
a; M. B. A. Vasconcellos
a aInstituto de Pesquisas Energéticas e Nucleares (IPEN - CNEN / SP), Av. Professor Lineu Prestes 2242, 05508-000, São Paulo, SP, Brazil
lcastroesnal@gmail.com
ABSTRACT
The minimum sample intake for which a reference material remains homogeneous is one of the parameters that must be estimated in the homogeneity assessment study of reference materials. In this work, Instrumental Neutron Activation Analysis was used to evaluate this quantity in a bovine kidney candidate reference material. The mass fractions of 9 inorganic constituents were determined in subsamples between 1 and 2 mg in order to estimate the relative homogeneity factor (HE) and the minimum sample mass to achieve 5% and 10% precision on a 95% confidence level. Results
ob-tained for HE in all the analyzed elements were satisfactory. The estimated minimum sample intake was between 2 mg
and 40 mg, depending on the element.
1. INTRODUCTION
Assessing the homogeneity is one of the critical steps in the process of preparing and certifying a reference material (RM). One of the parameters that must be estimated is the minimum sample in-take for which the material remains homogeneous, that is, that the concentration and uncertainty values present in the certificate continue to be valid.
In general, Certified Reference Materials (CRM) producers establish a minimum sample intake of 200 mg [1], estimated in a conservative way, and useful for classical analytical methods that use sample masses greater than this value. From the appearance of analytical techniques that use less sample quantities, such as Inductively Coupled Plasma, ICP, it became increasingly important to be able to clearly estimate which is the real minimum sample intake of the RMs.
The present work describes the micro-homogeneity study of a bovine kidney candidate reference material prepared as described in a previous work [2].
In order to obtain an estimate of the minimum sample intake amount, assays were performed to determine the relative homogeneity factor, or Kurfurst constant, (HE), a parameter used for this
pur-pose by several authors [3-5]. To quantify the homogeneity of an element in a given matrix, Kurfurst [3] defined a relative homogeneity factor (HE) based on a modification of the Ingamells
sampling constant [6]. The HE factor was found to be an appropriated estimator of the homogeneity
when small amounts of sample mass (up to 2 mg) were analyzed. Once the HE value is calculated, it
is possible to calculate the minimum quantity of sample to reach a certain precision value with a certain level of confidence [7].
Measurements should be carried out using a method that allows analyzing a low sample quantity, with good accuracy and low measurement uncertainty. In this work Instrumental Neutron Activa-tion Analysis, INAA, was used, a reference technique for the evaluaActiva-tion of the degree of homogene-ity of RM because its intrinsic characteristics such as high sensitivhomogene-ity, accuracy and precision [8]. On the other hand, INAA does not require the pre-treatment of the samples, and for this reason, contamination and sample losses are minimized and would not affect the total variability of the de-terminations.
2. MATERIALS AND METHODS
2.1. Experimental Design
One bottle of the bovine kidney candidate reference material was randomly chosen from the batch of 175 bottles. Ten sub-samples of approximately 1 mg were analyzed by Instrumental Neutron Activation Analysis to evaluate the HE for the elements Cl, K, Mn and Na, and ten sub-samples of approximately 2 mg to evaluate the HE for Co, Fe, Mg, Se and Zn. This difference in the analyzed sample quantity is related to the need to obtain quantifiable analytical peaks, with reasonable uncer-tainty (counting statistics). The height of the peak depends on the concentration of the analyte, the abundance of the isotope that undergoes the nuclear reaction and the magnitude of the reaction cross-section of the target element, which determines how favorable is the element for neutron acti-vation. In particular, the technique is less sensitive for the Fe and Mg [9], resulting in the need of greater masses for the determination of these elements. In the case of K, the low sensitivity of the technique was compensated by the high concentration of this element.
Samples were weighted using a Shimadzu Libror AEL 40SM analytical balance, calibrated by the Brazilian Calibration Network.
2.2. Preparation of Element Calibration Standards
Calibration standards were prepared from high purity standard solutions (SPEX Certiprep Inc., USA and LGC Standards, UK) or appropriate dilutions of these standard solutions using Milli-Q water (Millipore Corporation, USA). Appropriate aliquots of these solutions were pipetted onto Whatman 40 filter papers and dried inside a laminar flow hood. After drying, filter papers were transferred to polyethylene bags, previously cleaned with 10 % nitric acid and Milli-Q water.
2.3. Irradiation and Element Determination
All the measured test portions were weighed in polyethylene bags, previously cleaned with 10 % nitric acid and Milli-Q water. Test portions and element calibration standards were irradiated simul-taneously under a thermal neutron flux of approximately 5x10¹² n cm-2 s -1 at the nuclear research
reactor IEA-R1 of the Nuclear and Energy Research Institute, IPEN - CNEN/SP, São Paulo, Brazil.
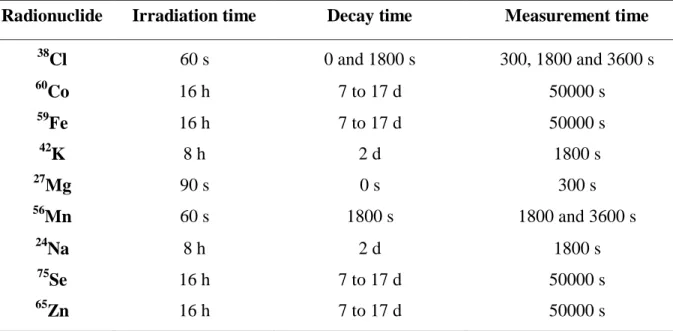
Studies were performed in order to optimize the irradiation and measurement conditions for such a low amount of sample. These conditions depended on the concentration of the element in the sam-ple and how much it activates under the neutron flux. Table 1 summarizes the conditions that were found to be the best for the analysis. The decay time is the time between the end of the irradiation period and the beginning of the measurement.
Gamma ray measurements were performed using a GC2018 CANBERRA HPGe detector coupled to a CANBERRA DSA-1000 digital spectral analyzer. Gamma ray spectra were collected and pro-cessed using a CANBERRA Genie 2000 version 3.1 spectroscopy software and all element content calculations were carried out using a Microsoft Excel spreadsheet.
Table 1: Conditions used in the micro-homogeneity study
Radionuclide Irradiation time Decay time Measurement time
38 Cl 60 s 0 and 1800 s 300, 1800 and 3600 s 60 Co 16 h 7 to 17 d 50000 s 59 Fe 16 h 7 to 17 d 50000 s 42 K 8 h 2 d 1800 s 27 Mg 90 s 0 s 300 s 56 Mn 60 s 1800 s 1800 and 3600 s 24 Na 8 h 2 d 1800 s 75 Se 16 h 7 to 17 d 50000 s 65 Zn 16 h 7 to 17 d 50000 s
3. RESULTS AND DISCUSSION
In Table 2 are presented the mean values obtained for the concentration of each element in the ana-lyzed subsamples, as well as the overall relative standard deviation, RSD, and the number of deter-minations performed. In some cases, as for Cl and Mn, it was possible to measure some subsamples more than once, and for this reason n > 10. The mass value shown in the table is an average from the 10 subsamples weighted.
Table 2: Mean concentration values, relative standard deviation and number of determinations in
the micro-homogeneity study
Radionuclide Mass, mg Mean value, g g-1 RSD, % n
38 Cl 0.96 9739 7.8 25 60 Co 1.78 2.03 11.3 10 59 Fe 1.78 298 8.0 10 42 K 0.96 12352 4.5 10 27 Mg 1.78 783 9.6 9 56 Mn 0.96 6.71 9.8 15 24 Na 0.96 8358 3.2 10 75 Se 1.78 6.07 9.2 10 65 Zn 1.78 88.9 4.9 10
To quantify the homogeneity of each element in the reference material, the relative homogeneity factor (HE) was calculated as follows [6]:
(1)
(2)
where RSD is the relative standard deviation of the n determinations as stated in Table 2 and the relative analytical uncertainty is the combined standard uncertainty of the measurements. When a direct method as INAA is used the number of uncertainties that influence the measurement results are minimized and have been well studied [8] [10]. In this work the analytical uncertainty was cal-culated combining the uncertainties due to the counting statics, the uncertainty of the weighted mass and the uncertainties of the calibration standards.
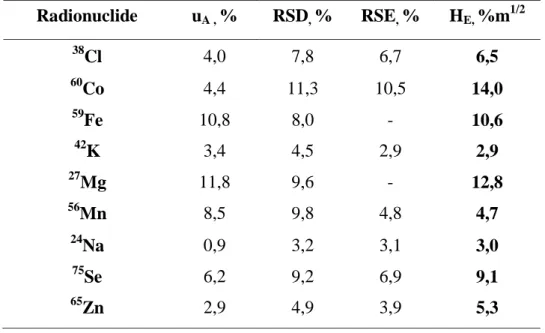
Table 3 shows the results obtained for the analytical uncertainties, RSD, RSE and the calculated relative homogeneity factor (HE).
Table 3: Standard uncertainties, RSE, RSD and relative homogeneity factors calculated for each
analyzed element Radionuclide uA , % RSD, % RSE, % HE, %m1/2 38 Cl 4,0 7,8 6,7 6,5 60 Co 4,4 11,3 10,5 14,0 59 Fe 10,8 8,0 - 10,6 42 K 3,4 4,5 2,9 2,9 27 Mg 11,8 9,6 - 12,8 56 Mn 8,5 9,8 4,8 4,7 24 Na 0,9 3,2 3,1 3,0 75 Se 6,2 9,2 6,9 9,1 65 Zn 2,9 4,9 3,9 5,3
As can be seen in Table 3 the uncertainty obtained for Fe and Mg was higher than the RSD, giving a negative value for RSE. This fact occurs because for these elements the analyzed peak was very small and so the counting statistics were elevated. For these elements the HE was estimated taking
into account the overall RSD, to have an indicative value, but it has to be considered that the result is an overestimation of the real value.
When a value of HE ≤ 10 is obtained, the material is considered to be very homogeneous [4].
Once the HE value was calculated, it was possible to calculate the minimum quantity of sample to
reach a certain precision value with a certain level of confidence [7] using the following equation:
(3)
where x% is the level of precision to be achieved, k2 is the factor for the bilateral tolerance limit of
the normal distribution and m is the mass used in the study of homogeneity.
For macro components like Cl, K and Na the minimum mass was estimated considering a target precision of 5%. For the rest of the elements the target precision was stated in 10% due to their low concentration level. Results are presented in Table 4.
Table 4: Minimum sample mass to achieve a 5% and 10% precision at a 95% confidence level
Radionuclide k2* M 5% (mg) M 10% (mg) 38 Cl 2.60 11.3 - 42 K 3.38 3.7 - 24 Na 3.38 4.0 - 60 Co 3.38 - 39.6 59 Fe 3.38 - 22.9 27 Mg 3.53 - 36.0 56 Mn 2.95 - 1.9 75 Se 3.38 - 17.0 65 Zn 3.38 - 5.6
*k2 is the factor for the bilateral tolerance limit of the normal distribution, at a 95% confidence level.
From the results presented it can be said that for the analytes Cl, K, Mn, Na, Se and Zn, the material presented a very high homogeneity, with minimum samples masses ranging from 2 mg for Mn to 17 mg for Se. For the analytes Co, Fe and Mg the homogeneity was moderate. As it was already
point-ed, for Fe and Mg the obtained HE value is an overestimation from the real one and so is the
mini-mum sample intake. The obtained variability for these two elements is more related with the analyt-ical capability than to sample heterogeneity. For Co the higher levels were obtained, however the obtained minimum sample intake for this element was 40 mg, a value that is adequate for most of the analytical techniques.
4. CONCLUSION
The micro-homogeneity study for a bovine kidney candidate reference material was conducted sat-isfactorily.
Results obtained for the relative homogeneity factors and the minimum sample intakes were con-sidered adequate. The suggested minimum sample intake for the reference material will depend on the intended use and the element to be determined. Results obtained were between 2 mg and 40 mg,
showing that for most of the studied elements the reference material will be useful for micro-analytical techniques.
Future works in this reference material should improve the analysis for Fe and Mg, maybe deter-mining better irradiation and measurement conditions to obtain more accurate results for these ele-ments.
5. ACKNOWLEDGMENT
The authors would like to acknowledge the financial support of CNPq (Brazilian National Council for Scientific and Technological Development), from Research fellowship 307093/2013-1. The au-thor L. Castro would also like to acknowledge the PhD fellowship from CAPES (Coordination for the Improvement of Higher Education Personnel).
REFERENCES
1. COMAR, The international database for certified reference materials. Available at: <http://www.comar.bam.de>. Last accessed: 20 mar. 2017.
2. CASTRO, L.; MOREIRA, E. G.; VASCONCELLOS, M. B. A. Use of INAA in the homogenei-ty evaluation of a bovine kidney candidate reference material. J. Radioanal. Nucl. Chem, v. 311, p. 1291–1298, 2017.
3. KURFURST, U.; PAUWELS, J.; GROBECKER, K. H.; STOEPPLER, M.; MUNTAU, H. Mi-cro-heterogeneity of trace elements in reference materials - Determination and statistical evalua-tion. Fresenius J. Anal. Chem, v. 345, p.112-120, 1993.
4. ROSSBACH, M.; GROBECKER, K. H. Homogeneity studies of reference materials by solid sampling – AAS and INAA. Accred. Qual. Assur, v. 4, p. 498-50, 1999.
5. SONNTAG, T. M.; ROSSBACH, M. Micro-homogeneity of candidate reference materials characterized by particle size and homogeneity factor determination. Analyst, v. 122, p. 27–31, 1997.
6. INGAMELLS, C.O.; SWITZER, P. Proposed sampling constant for use in geochemical analy-sis. Talanta, v. 20(6), p. 547-568, 1973.
7. PAUWELS, J.; VANDECASTEELE, C. Determination of the minimum sample mass of a solid CRM to be used in chemical analysis. Fresenius J. Anal. Chem, v. 345, p. 121-123, 1993. 8. GREENBERG, R.R., BODE, P, FERNANDES, E.A.N. Neutron activation analysis: A primary
method of measurement. Spectrochim Acta B, v. 66, p. 193–241, 2011.
9. ZEISLER, R.; VAJDA, N.; KENNEDY, G.; LAMAZE, G. MOLNÁR, G. Activation analysis. In: VÉRTES, A.; NAGY, S.; KLENCSÁR, Z.; LOVAS, R.; ROSCH, F. (Ed). Handbook of
Nuclear Chemistry, 2nd Ed, Dordrecht: Springer, 2011, p. 1553-1617.
10. MOREIRA, E. G.; VASCONCELLOS, M. B. A.; SAIKI, M. Uncertainty assessment in instru-mental neutron activation analysis of biological materials. J. Radioanal. Nucl. Chem, v. 269, p. 377-382, 2006.