ORIGINAL ARTICLE
Ester Gomes Silva • Jose da Silva Costa
Are voters rationally ignorant? An empirical
study of Portuguese local elections
Published online: 7 March 2006 © Springer Verlag 2006
Abstract The application of the rational choice postulate to a political context invariably leads to the conclusion that most voters are ill informed when making the decision on whom to vote for. In this paper, the authors conduct an empirical evaluation of the rational ignorance theory, based on the model developed by (Rogoff and Sibert Rev Econ Stud LV:1-16, (1988) and by considering that better informed voters reward political candidates who show better performances. The levels of performance are established through the construction of an empirical frontier using the Data Envelopment Analysis (DEA) methodology. According to our results, based on the 1997 Portuguese local elections, even though swing voters do not necessarily behave as rationally ignorant voters, a large majority of voters are rationally ignorant.
Keywords Voters' behaviour • DEA analysis • Local elections • Local govemments • Portugal
1 Introduction
Since Downs's seminal work. An Economic Theory of Democracy (Downs 1957), one ofthe most stimulating issues in the public choice theory is concerned with the fact that voters may have insufficient information and how this can be used by political representatives and lobbies to meet their own interests. By applying the rationality postulate to the characterization of the voter's behaviour. Downs concludes that the voter is insufficiently informed when deciding on whom to vote for. Confronting costs and benefits, the rational voter sees that it does not E. G. Silva (El)
Faculty of Arts ofthe University of Porto, Via Panoramica, 4150-564 Porto, Portugal Tel.: +351-22-607710, Fax: +351-22-6091610, E-mail: [email protected]
J. da Silva Costa
Faculty of Economics of the tjniversity of Porto, Rua Roberto Frias, 4200-464 Porto, Portugal Tel.: +351-22-5571100, Fax: +351-22-5505050, E-mail: [email protected]
compensate to invest much in obtaining information, since the only outcome is really making a better-informed decision when it comes to voting. Since most people feel that their vote will not influence the election results, they see no reason to pay greater attention during election campaigns.
Several studies have established the extremely negative implications this apparent indifference on the part of the voter has had on social well-being.' The major problems are linked to the possibility that public opinion is manipulated by the government and lobbies to meet their own interests. The government can use the voters' ignorance to avoid an excessively severe evaluation of its performance, carrying out policies that may harm the interests ofthe general population without being held accountable for them. At the same time, the voters' ignorance makes them particularly vuhierable to the influence brought to bear by lobbies. Lobbyists can mould public opinion to their advantage, by leaving out the negative aspects of their political proposals and building potentially false cause-effect relationships which are easily apprehended and seen as acceptable by the voters. Lobbies may even interfere in the definition of political programmes by gaining influence and a privileged status with those in office (e.g. Stratmann 1991). A natural consequence is the distortion of the political market in favour of measures that represent significant gains to some people and negative consequences for most ofthe others (Gwartney and Wagner 1988).
Other studies play down the relevance of rational ignorance as a potential source of political market failure, by considering that the Downsian theory confuses biased judgements with biased information or lack of information (e.g. Wittman 1989; Peltzman 1990; Becker 1983, 1985). The arguments presented in these studies rely mostly on the virtues of competition in the political market and on the gains of preserving the brand name and reputation of political parties and candidates. These could offset the potential opportunism of candidates and political parties.
Ultimately, the rationally ignorant/efficient voter controversy can only be resolved through empirical testing, although the former is apparently theoretically more appealing. The specific characteristics of the political market, namely the indivisibility of choices, the inability to change outcomes over a considerable period of time, and the inability to account for the intensity of voters' preferences, substantially reduce the incentives for voters to search for information. Moreover, political parties may follow a strategy of ambiguity and voters, insufficiently informed, may not be able to recognize deviations from the declared political programmes.^
Unfortunately, there has been a lack of empirical evidence regarding the voter's rational ignorance hypothesis although there is some evidence of rational voter behaviour (e.g. Mueller 2003).^ In this paper, we seek to fill this gap by indirectly evaluating the amount of information that voters actually possess. To this end, we have based our study on the model developed by Rogoffand Sibert (1988), which was later extended in Rogoff (1990).
' See McNutt (1996) for an interesting survey ofthe issue.
^See, for example, Alesina and Cukierman (1990), or Mueller and Strattmann (1994).
3 To our knowledge, only a few studies have analyzed empirically the voters' rational ignorance. Some of these studies can be found in Galles and Sexton (1995), Heyndels and Smolders (1994) and Peltzman (1990).
In Rogoff and Sibert's model, the rational voter compares his expected utility under each of the two candidates considered (the incumbent candidate and his opponent), and is primarily influenced by the competency of the candidates. Crucial to this model and to the empirical work developed here is the assumption that the expectations regarding the incumbent candidate are different from the expectations regarding his opponent. The former's most recent performance comprises a relevant indicator as to his future achievements, whereas no information is available on the opponent's current achievements, thus providing no predictions as to future performance. Therefore, for voters the choice is essentially between either re-electing the incumbent or selecting an agent from the population at large (Rogoff 1990, p. 24).
Following Rogoff and Sibert, we assume that better-informed voters reward political candidates who have had better performances. The information voters have is then determined by the proximity between electoral results and indicators of economic performance, controlling for the influence of other factors that decide the vote, such as the candidate's ideology or image, which could be included in the "looks" shock of Rogoff and Sibert's model. The rational voter anticipates the future value of each component based on the candidate's most recent term in oflFice, and chooses the candidate who ensures the best expected utility level. Therefore, the incumbent candidate will win the election if the combined expected competence, image, and ideology exceed that of the other candidate, identified with the average value of the distribution.
The paper is structured as follows. In the next section, we measure the candidates' performances through the construction of an empirical frontier using the Data Envelopment Analysis (DEA) methodology. The calculated efficiencies are included in the estimate of an electoral approval function in Section 3, considering the results of the 1997 Portuguese Local Elections. The concluding section summarizes our fmdings.
2 Measurement of the candidates' performance
The definition of competency in Rogoff and Sibert (1988) bears a close similarity to the notion of economic efficiency. In fact, it is assumed that the most competent candidate is the one who more efficiently manages the resources obtained from taxation, by producing more public goods and services.
In order to test the hypothesis according to which the performance of incumbents should be judged by rational and informed voters, the DEA method was used to construct an empirical production boundary for the municipalities under study. The use of a nonparametric method of efficiency estimation instead of a parametric one seemed to be preferable, since the latter would demand explicitly identifying the underlying functional form of the technology. This is a particularly difficult matter when dealing with public sector organizations, whereas the DEA, on the contrary, requires only minimal technical and behavioral assumptions."* We considered each municipality in each year of the term prior to the 1997 elections as a different Decision Making Unit (DMU), according to the procedure used, among others, by Boussofiane et al. (1991).
Table 1
Variable
Input and output Description
variables selected6
Source Current expenditure of municipality i, in 1.000.000 PTE INE Total population INE PUPILSi Number of pupils attending the first four grades of primary schools INE
in municipality i
ROADSi Number of kilometer of municipal roads in municipality i Marktest WASTEj Urban solid waste disposal in municipality i, in thousands of tons fNE WATERj Water consumption in municipality i, in thousand cubic meter INE SEWAGE; Population served by residual water drainage systems, in percentage INE
There were 275 municipalities in Continental Portugal in the period under study. The use ofthe entire sample, however, would be highly misleading, since it would mean comparing municipalities with widely differing eharacteristics and dissimilar technologies. In order to obtain a more homogeneous sample, we eliminated 114 observations relative to municipalities with over 100,000 inhabitants or less than 10,000. This decision was based on previous studies of Portuguese local governments (e.g. Costa 1997; Baleiras 1997; Osorio 1997), which revealed structural differences in the municipalities with very high or very low population levels. From this subset, we had to further discard 25 municipalities, because some key data were missing. The data set thus comprises information on 136 municipalities.
The efficiency indices were estimated using the Windows Warwick DFA software, from the perspective of minimizing inputs and variable returns to seale. Although the theoretical literature remains largely inconclusive with respect to the most appropriate model to describe the behaviour of mutiicipalities, a majority of the contributions focus on input efficiency measures.^ This seems to be an acceptable standard for the Portuguese case, assuming that local governments take output as exogenous and endeavour to fulfil citizens' demands. As to the nature of returns to scale, the use of variable retttms was based on the evidence put forward in Vanden Eeckaut et al. (1993). The authors conclude that there is an important phenomenon of decreasing rettims to scale in the production function of local governments, making the DEA methodology with constant returns to scale a highly inadequate procedure for its assessment.
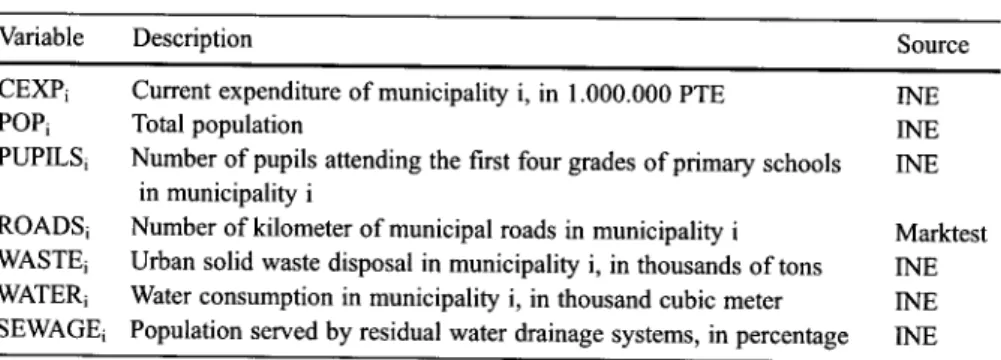
The input and output variables selected are given in Table 1.
In terms of inputs, we used the total value of current expenditure (CEXP), taking into account the mtinicipalities' operating expenditure. The use of an expenditure variable instead of real consumption was due to the impossibility of obtaining adequate proxies for the capital factor. Since the municipalities have access to the same capitals' market and pay their employees according to the same
5 See, for example, Hayes and Chang (1990), or Vanden Eeckaut et al. (1993).
'^ There was not enough information on the variable ROADS for the year 1997 and on the WASTE and WATER variables for the year 1994. To fill in the gap in the first variable we used the 1996 values. For WASTE and WATER, we obtained the total expenditure on these services for the year 1994, and divided it by an estimation of its unitary price, obtaining an estimation ofthe quantities supplied.
salary tables, it seems acceptable to consider that there is no spatial variation in prices and, consequently, that cost-efficiency is essentially the same as technical efficiency.^
The selection of outputs to include was based on an analysis of the responsibilities assigned to the Portuguese local authorities, followed by the definition of indicators that best describe their performance in the period under study. Although Portuguese legislation assigns a wide-ranging intervening role to local authorities, economic and social development comprising their ultimate goal, in practice, their role is apparently more restricted, resulting in an excessive concentration of expenditures in traditional areas. In fact, nearly two thirds of the available resources are spent on administrative costs, fixed costs (such as water supply and drainage), and urbanization. The output indicators chosen aim to capture those services: the PUPILS, ROADS, WASTE, WATER and SEWAGE variables reflect the municipalities' responsibilities in the fields of education, transportation, water supply and waste disposal. The POP variable captures the basic administrative services provided to the local populations. These variables are at best proxies of the services provided by the municipalities rather than direct output measures because, unfortunately, no other data are available for the Portuguese local municipalities. Furthermore, data similar to these have been used in a number of previous studies found in performance literature on the local public sector (e.g. Vanden Eeckaut et al. 1993; De Borger and Kerstens 1996).
To analyze the explanatory capacity of the chosen indicators on the amount spent by the selected municipalities, we have estimated the total cost function defined in Eq. 1 by ordinary least squares:
In CEXPi = ao + a 1 In PUPILSi + aj In ROADSi + a^ In WASTEi
(1) + a4 In WATERi + as In SEWAGEi + ae In POPi + e,
The variables are in logarithms, so that the coefficients Q:,(i= 1 , . . . , 6 ) represent the elasticities of expenditure with respect to each of the indicators. The results ofthe estimation for the years 1995 and 1996 are presented in Table 2. *
The results attest to the relevance and explanatory power of the chosen indicators, justifying their use in the assessment of the cost efficiency of the municipalities under study. The adjusted R^ is very high, revealing the overall significance of the regression. For all six variables the estimated coefficients have the expected sign. They are also all significant at the 10% level, except for the one relating to the extension of municipal roads.^ There remains, however, an important shortcoming in the outputs considered. Apart from being mere proxies for the services provided, rather than direct output measures, the chosen indicators
' In the municipalities that have contracted separate companies for water supply and sewage during the period under study the CEXP variable includes an estimate of the costs of providing water or water and drainage. The estimate is based on the operational expenditure of the companies contracted.
^ Since it was not possible to gather complete information on all the variables for the whole period under study, we have only considered the years of 1995 and 1996, thus ensuring more reliable estimations.
' However, we have decided to include this variable, due to the importance ofthe maintenance of local roads within the responsibilities of the Portuguese municipal authorities.
Table 1995 1996 2 Estimates C -0.707 (-1.077) -0.648 (-0.974)
of the parameters of a total cost In PUPILS 0.244 (1.754) 0.147 (1.606) In ROADS 0.031 (0.974) 0.050 (1.528) In WASTE 0.081 (2.076) 0.160 (3.358) function In WATER 0.145 (4.144) 0.150 (3.752) (n=136) In SEWAGE 0.135 (3.531) 0.123 (3.418) In POP 0.332 (1.964) 0.324 (1.891) Adjusted R^(%) 81.85 81.93 *(-statistics in parentheses
do not take into account the possible quality differences in the provision of serviees. Bearing this fact in mind, we obtained information relating to the quality ofthe WASTE, WATER and SEWAGE indicators, based on the condition ofthe equipment used to supply those services.'° Unfortunately, the introduction of quality considerations implied a sharp reduction in our sample, down to only 37 municipalities. Since the discriminating power of the DEA method could be threatened by such a drastic reduction in the data, we decided to maintain both samples in the study and assess the local governments' efficiency in the two situations.
Taking into consideration the described data, we applied the DEA method and obtained the results summarized in Table 3. "
In both samples the results identify a considerable ntimber of inefficient units that is particularly high when considering the entire sample. In this case, only 79 of the total 544 DMUs present a 100% index of relative efficiency, whereas in the smaller sample, the number of efficient units reaches 58 (39.2%). For the entire sample, the average efficiency level for the inefficient units is 72.8%, indicating the same results could be achieved with a cut of nearly 27% in costs.
3 Electoral results and the performance of candidates
Once the main argument for the voters' choice was defined - the competency factor - the next step consisted in estimate the general model:
= ao + ai COMPj, + aiCONTROLp + (2)
where Vu is the probability that individual «, voting in municipality j , will support the inctimbent party. COMPj, is the perfonnance indicator ofthe incumbent of municipality y during the last term in office, and CONTROLj, represents a set of control variables that may affect the voter's judgement and are assumed to be
'" In INE Estatfsticas do Ambiente, we found information concerning the condition of water collection sources, lift stations, water mains, water treatment reservoirs, residual water treatment stations, municipal septic tanks, urban solid waste dumps and solid waste processing and disposal sites.
" The values ofthe CEXP variable have been deflated by the public expenditure deflator for all municipalities, in order to compare their values in the different years.
Table 3 Summary statistics for efficiency measures '^ Mean All sample 76.747 37 municipalities 87.741 Standard deviation 16.790 14.802 Skewness Kurtosis -0.328 -1.088 -0.684 0.208 Minimum 30.74 44.94 Maximum 100 100 Number of efficient observations 79 (14.5%) 58 (39.2%)
uncorrelated with the competency factor. fXy is a zero mean error term, with constant variance o^ and not correlated among individuals.
Since the information needed to estimate the model is only available at an aggregated level, the estimated model is:
Ky = /3o + ^, COMPJ, + (32 CONTROLj, + iij (3)
where Vj is the proportion of individuals in municipality j who voted for the incumbent party and /xy is the average error for municipality j . In this case, the variance in the stochastic term is no longer constant, thus making it necessary to correct the OLS covariance matrix.'
The model was estimated by considering as a first measure of the competence factor the average of the efficiency indices calculated for each municipality according to the DEA method (DEA_AV). Since the use of this indicator could lead to the misconception that candidates from traditionally inefficient municipalities, but who had accompUshed good results during their terms in office would be penalized, we have also considered the annual average variation of the DEA indices in the period under study (ADEA).
The main control variables considered were the candidate's ideology and the well-known phenomenon of incumbency-bias. In order to proxy the ideological component, we took into consideration the results of the 1999 European Parliament elections for the selected municipalities (IDEO), to establish the local importance of the incumbent's party.
The advantages of public recognition associated with incumbency were considered by including a dummy variable (REC) that equals 1, in cases where the incumbent candidate was running for a second mandate in the 1997 elections. We also included the dummy variable ND, which took the value of one when the candidate had been previously elected for at least two mandates. This last variable was included to test whether the incumbency influence on the electoral results increased with time in office.
Finally, we included the dummy variable GOV that equals one when the incumbent's party was the same as the party of the national government (the Socialist Party). The main purpose of having included this variable was to control for the potential influence exerted by the government's image on the local elections. The expected sign of the coefficient in this variable is not clear. On the one hand, since the 1997 local elections were held in a setting of general
'2 For full results, see Appendices 1 and 2. '3 In this case, V A R ( M ; ) = ^ /
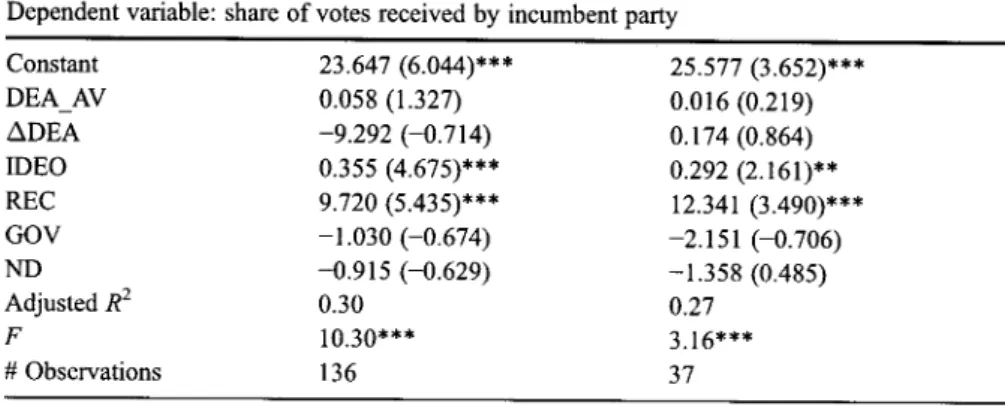
Table 4 Estimates of the parameters of the electoral approval function
Dependent variable: share of votes received by incumbent party Constant DEAAV ADEA IDEO REC GOV ND Adjusted R^ F # Observations 23.647 (6.044)*** 0.058 (1.327) -9.292 (-0.714) 0.355 (4.675)*** 9.720 (5.435)*** -1.030 (-0.674) -0.915 (-0.629) 0.30 10.30*** 136 25.577 (3.652)*** 0.016 (0.219) 0.174(0.864) 0.292 (2.161)** 12.341 (3.490)*** -2.151 (-0.706) -1.358(0.485) 0.27 3.16*** 37 ^statistics are in parentheses
Significance level at which the null hypothesis is rejected: ***, 1%; **, 5%; and *, 10% White heteroskedasticity consistent coefficient covariance
Models estimated by OLS
benevolence towards the Govemment, we would expect it to be positive. On the other hand, some studies have suggested that voters perceive mayors in the opposition as more active in demanding benefits from central govemments, which would imply a negative sign (e.g. Costa 1997).
The results ofthe OLS estimates are presented in Table 4. '"*
A first analysis of the results confirms the overall significant character of the regressions, as ascertained by the high significance ofthe F test statistics. The anal-ysis ofthe statistical significance ofthe individual coefficients shows that the voter is not particularly sensitive to the candidate's performance, at least not in terms ofthe way it was represented. None of the coefficients associated with the competence factor in both estimations is statistically significant.
Ideology and particularly the catididate's congetiial image apparently had some influence on the voters' decisions. Everything else equal, the fact that the incumbent candidate had decided to run for another mandate increased the vote for the party by about ten percentage points or more.'^ The fact that he had been in office for at least two mandates apparently had no decisive influence on the final result. The same applied to whether the candidate was from the same party as the government.
The results apparently sustain the rational ignorance hypothesis: the prevalence of ideological factors and ofthe incumbency-bias phenomenon can be interpreted as a sign that voters look to crude proxies when they decide to vote, rather than make a thorough assessment ofthe candidate's performance. In a context of costly information, ideologies can be seen as cost-saving devices: voters vote by means of
'''Although it is a common practice in the literature, the use of OLS in the estimation of electoral approval functions may produce estimated values for the dependent variable (proportion of votes) that fall outside its range of variation. In this case, the fitted values for the dependent variable all fell within the [0,1] interval.
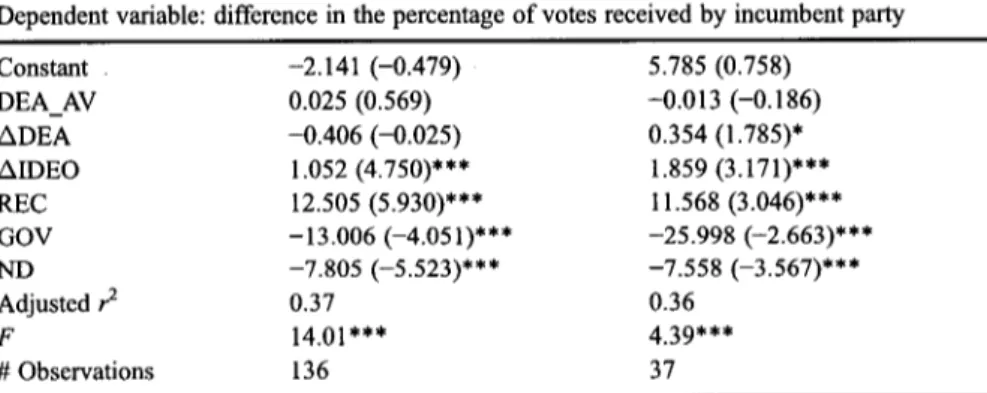
Table 5 Estimates of the parameters of the electoral approval function'^
Dependent variable: difference in the percentage of votes received by incumbent party Constant DEA AV ADEA AIDEO REC GOV ND Adjusted r^ F # Observations -2.141 (-0.479) 0.025 (0.569) -0.406 (-0.025) 1.052(4.750)*** 12.505 (5.930)*** -13.006 (-4.051)*** -7.805 (-5.523)*** 0.37 14.01*** 136 ^statistics are in parentheses
Significance level at which the null hypothesis is rejec
5.785 (0.758) -0.013 (-0.186) 0.354(1.785)* 1.859(3.171)*** 11.568(3.046)*** -25.998 (-2.663)*** -7.558 (-3.567)*** 0.36 439*** 37 ;ted: ***, 1%; **, 5%: and *, 10% White heteroskedasticity consistent coefficient covariance
Models estimated by OLS
ideologies in order to save the cost of obtaining information about specific issues (Downs 1957). At the same time, the public recognition of the incumbent candidate assumes more relevance precisely in a context of rational ignorance, representing a valuable asset against their opponents (Tullock 1965).
It can be argued, however, that the relevant issue when assessing voters' rational ignorance is not to explain the behaviour of the entire population of voters, but rather only that of swing voters.'* Since it is not possible to distinguish the type of voter that casts a particular vote, in a second approach, we estimated the regressions mentioned above by considering as the dependent variable the difference in the percentage of votes for the incumbent's party between 1993 and 1997 (Table 5).
As we can observe in Table 5, the overall significance of the regressions is higher when we adopt an incremental perspective. The explanatory power of the regressions is improved. In both regressions the estimated coefficients AIDEO, REC and ND are statistically different from zero and have the expected sign. The results indicate that belonging to the government party harms the electoral results and that incumbents have an advantage, although this advantage is smaller when the number of terms in office is equal or superior to two. When we consider a sample with 37 observations, the estimated coefficient of the annual variation of the DEA index has the expected sign and is statistically significant. This result is particularly important because it indicates that a majority of the voters are rationally ignorant whereas swing voters are able to perceive the variation in efficiency of local governments and to reward competency.
"Since a large part of voters always vote for the same party.
"The AIDEO variable is the difference in the percentage of votes of the incumbent's party between 1999 and 1994 European Parliament elections.
4 Some conclusions
According to our empirical evidence, electoral results are more highly influenced by variables used as proxies of the voters' rational ignorance than those that capture the efficiency of local governments. The predominant factor that explains electoral results seems to be the candidate's incumbency. Consequently, factors like the candidate's image and charisma may dominate a rigorous evaluation of his performance, giving well-known candidates a relative advantage over other candidates. The recognition and social visibility of those who have been in office represent valuable assets against their opponents.
Electoral results are strongly influenced by rationally ignorant voters, but this does not mean that informed voters are not decisive. When we include an incremental perspective in our analysis in order to capture the behaviour of swing voters we obtain a different result. According to our empirical evidence, swing voters reward local governments with a positive annual variation in the DEA index, although this result is only obtained when we consider the sample with 37 observations. Bearing in mind that our estimates suffer from certain shortcomings that may weaken the relevance of the DEA indexes, this is an important result. Firstly, it is not clear that all the relevant variables in the evaluation of the efficiency-cost variable have been considered. Despite the fact that the variables included help to explain most of the municipalities' current expenditure, some areas have not been covered in this study since there was not enough credible information available.'* Secondly, several difficulties in quantifying the selected variables forced us to make compromises so as to fill in the information gaps. The impact of those information gaps, although appropriately lessened, may have biased the results. All things considered, we admit that, with improvements in the empirical analysis, the value and significance of the estimated coefficients of the DEA indexes may increase. So, it seems reasonable to conclude from our empirical evidence that swing voters do not necessarily behave as rationally ignorant voters, even though a large majority of the voters are in fact rationally ignorant.
Appendix 1: DEA efficiency results (136 municipalities)
Municipality Albergaria a Velha Albufeira Alcacer do Sal Alcochete Alenquer Alijo Aljustrel Almeirim Amarante Amares Ansiao 1994 81.07 88 48.04 55.67 75.72 100 88.06 81.38 100 95.27 85.69 1995 75.68 100 49.96 50.56 79.81 76.96 87.86 81.98 85.83 78.98 82.28 1996 64.72 100 41.68 52.37 58.03 76.43 91.53 80.65 99.05 82.34 89.42 1997 47.2 100 43.58 52 68.91 76.82 100 77.54 87.33 89.27 82.61 Average 67.17 97.00 45.82 52.65 70.62 82.55 91.86 80.39 93.05 86.47 85.00 Std. Error 14.95 6.00 3.84 2.16 9.52 11.63 5.68 1.97 7.51 7.27 3.32 Winning party 1997 elections CDS-PP PS PCP/PEV PCP/PEV PS PS PCP/PEV PS PS PPD/PSD PPD/PSD '* We are referring particularly to the area of cultural intervention, for which it was impossible to determine the correct proxy.
Arcos de Valdevez Arganil Arouca Aveiro Azambuja Baiao Barreiro Batalha Beja Benavente Bombarral Braganga Cabeceiras de Basto Cadaval Caldas da Rainha Caminha Cantanhede Carregal do Sal Castelo Branco Castelo de Paiva Castro Daire Celodco de Basto Chamusca Chaves Cinfaes Condeixa a Nova Coruche Elvas Entroncament Espinho Estarreja Estremoz Evora Fafe Faro Felgueiras Figueira da Foz Fundao Gouveia Grandola Guarda Idanha a Nova Ilhavo Lagos Lamego Louie Lourinha Lousa Lousada Macedo de Cavaleiros Mangualde Marco de Canaveses Marinha Grande Mealhada Melgafo Mira Miranda do Corvo Mogadouro Moimenta da Beira 73.19 57.29 78.59 100 62.91 87.23 100 88.11 62.05 72.78 72.85 66.71 49.39 66.29 83.97 91.69 100 100 80.67 79.07 86.88 91.05 70.3 80.03 100 88.86 50.27 77.96 100 65.5 71.57 54.3 78.72 87.18 50.33 80.75 65.69 11,\1 81.69 38.04 100 100 100 38.69 81.66 74.15 100 73.64 100 60.09 70.63 100 80.69 76.54 84.66 83.31 83.29 59.97 74.44 67.7 56.02 83.06 100 76.41 61.24 100 75.91 64.96 67.53 75.99 63.91 76.73 70.27 81.58 96.68 82.26 100 81 78.18 86.19 87.68 65.97 80.41 98.27 82.65 51.46 77.86 100 64 59.83 58.08 64.16 80.91 57.25 67.15 76.09 76.59 84.38 46.15 100 100 78.67 45.88 81.27 87.93 97.28 66.26 91.69 53.16 69.29 100 73.49 71.03 80.24 86.57 82.77 59.4 76.06 69.58 55.79 74.25 95.54 54.75 85.46 100 72.65 60.15 63.24 68.48 64.7 14,01 72.92 89.67 93.37 81.54 100 81.38 69.91 73.73 75.54 67.12 78.9 99.66 84.98 48.77 86.42 100 62.26 60.54 61.23 70.58 86.66 67.9 67.22 100 71.13 81.61 41.02 98.43 100 81.01 42.7 79.85 100 100 63.37 95.09 52.71 69.29 95.18 72.35 71.17 73.92 87.06 76.89 59.66 75.57 79.25 53.92 75.17 100 63.18 91.04 100 79.63 100 64.51 66.73 63.69 90.1 69.59 87.07 94.09 76.81 100 74.14 52.34 71.62 73.6 62.36 86.54 95.89 91.33 49.24 77.91 100 74.07 59.83 55.74 66.73 89.07 81.83 75.08 70.68 87.04 76.54 36.18 100 100 88.67 42.78 75.67 100 100 59.63 87.25 47.5 74.22 100 67.16 75.31 67.43 85.55 81.94 61.67 85.35 72.43 55.76 11,11 98.89 64.31 81.24 100.00 79.08 71.79 67.02 71.01 64.75 72.57 69.77 85.57 93.96 85.15 100.00 79.30 69.88 79.61 81.97 66.44 81.47 98.46 86.96 49.94 80.04 100.00 66.46 62.94 57.34 70.05 85.96 64.33 72.55 78.12 77.98 81.06 40.35 99.61 100.00 87.09 42.51 79.61 90.52 99.32 65.73 93.51 53.37 70.86 98.80 73.42 73.51 76.56 85.62 81.22 60.18 77.86 5.09 1.39 3.99 2.23 8.96 13.54 0.00 6.66 18.91 4.24 4.20 1.38 16.97 2.73 3.54 2.07 10.19 0.00 3.45 12.40 8.05 8.69 3.28 3.44 1.87 3.88 1.19 4.26 0.00 5.24 5.76 3.03 6.36 3.52 13.72 6.61 15.20 6.62 3.27 4.35 0.79 0.00 9.61 2.95 2.74 12.31 1.36 5.93 5.39 5.17 2.33 2.41 5.57 2.83 7.52 1.67 2.94 1.02 5.04 PPD/PSD PS PS PS PS PPD/PSD PCP/PEV CDS-PP PCP/PEV PCP/PEV PPD/PSD PPD/PSD PS PS PPD/PSD PS PPD/PSD PPD/PSD PS PPD/PSD PPD/PSD PPD/PSD PCP/PEV PS PS PS PCP/PEV PS PS PS PS PCP/PEV PCP/PEV PS PS PS PPD/PSD PS PS PCP/PEV PS PPD/PSD PPD/PSD PPD/PSD PS PS PS PS PS PS PPD/PSD CDS-PP PS PS PS PS PS PS PPD/PSD
Moita Mon^ao Montalegre Montemor-o-Novo Montemor-o-Velho Mortagua Moura Nelas Obidos Odemira Olhao Oliveira de Azemeis Oliveira de Frades Oliveira do Bairro Oliveira do Hospital Ourem PaQOS de Ferreira Palmela Penacova Penafiel Peso da Regua Pinhel Pombal Ponte da Barca Ponte de Lima Porto de Mos Povoa de Lanhoso Povoa de Varzim Proenpa a Nova Reguengos de Monsaraz Resende S, Joao da Madeira S, Pedro do Sui Sabugal Salvaterra de Magos Santa Comba Dao Santiago do Cacem Satao Seia Serpa Serta Sesimbra Sever do Vouga Silves Sines Soure Tabua Tarouca Tavira Tondela Torres Novas Torres. Vedras. Trancoso Vagos
Vale' de- Cambra Valen^a ValbngO' Valpapos. 100 87,48 70,79 42.47 88,92 81,77 52,66 100 74,61 41,81 100 90,88 86.66 95,36 60,65 80,5 97,99 111 %(>.ll 100 82,19 76,64 89,61 70,4 89,29 61,44 99,62 100 90,52 70,86 100 95,4 57,38 64,12 70,92 ll.€l 49,95 91,93 79,48 62,23 46,96 46,3 100 57,78 64,95 71,96 80,53 100 46,58 93,41 67,5 73,93' 66,44 59;2' 64'88: 78:,29' lioo; 83,22 100 79,09 66,63 43,08 74,13 81,58 46,48 100 80,71 40,14 82,35 94,9 84,57 100 61,7 76,6 89,26 100 80,43 100 79,69 71,88 91.07 65,38 100 63,19 100 81,37 85,13 55,51 96,52 84,26 52,09 65,46 72,98 75,05 54,04 99,06 85,93 55,13 56,24 47,16 98,17 62,16 42,6 73,66 74,47 100' 50102 TOO-67,1'8 66,,1'5' 66iO3 74',02 69,i;9' 65,03". 98',37' 77,117' 100 81,06 64,65 42,41 71,65 78,62 49,21 98 79,79 38,8 80,02 89,37 75,41 100 59,34 69,52 83,42 100 80,24 86,43 86,92 72,32 82,36 64,1 96,5 71,05 96,79 96,62 79,01 34,16 85,18 81,37 51,27 62,77 67,51 70,19 53,06 71,11 85,66 47,34 47,14 51,67 95,1 57,12 42,33 82,09 68,57 92,56 50;9' 100 65,86' 72,93' 74', 19' 77,68' 70:18. 64', 86: HOO' 100' 92,5 86,88 63,53 39,51 72,97 100 96,54 96,56 82,42 35,43 83,64 94,64 75,46 95,68 77,55 77,55 94,56 100 77,95 95,79 84,41 72,52 81,6 65,57 88,94 70,39 100 100 82,92 56,35 80,32 91,5 54,65 59,99 69,55 84,69 58,61 76,45 74,45 48,69 48,83 58,39 98,33 56,61 30,74 66,52 60;81i l'OO 53,75' TOO 100 60:58 72189 69,73 66,991
si'.n
100 liOO' 98,13 83,63 66,40 41,87 76,92 85,49 61,22 98,64 79,38 39,05 86,50 92.45 80,53 97,76 64,81 76,04 91,31 94,30 81,22 95,56 83,30 73,34 86,16 66,36 93,68 66,52 99,10 94,50 84,40 54,22 90,51 88,13 53,85 63,09 70,24 75,65 53,92 84,64 81,38 53,35 49,79 50,88 97,90 58,42 45,16 73,56 71,10 98vM 50,31' 98,35' 15\U 68,40' 69,89-70:16 67,8li 66:33' 99; 59 90,10' 3,75 4,19 3,20 1,60 8,07 9,78 23,68 1,68 3,36 2,71 9,12 2,75 5,94 2,59 8,55 4,65 6,37 11,40 3,55 6,40 3,09 2,22 4,87 2,77 5,47 4,91 1,55 8,90 4,80 15,12 9,28 6,45 2,76 2,34 2,30 6,34 3,58 13,05 5,50 6,83 4,38 5,53 2,04 2,54 14,31 6,45 8,42 3:72 3,30 16:59' 6,25' 4:25i 7,99 2',36i 8:79' 0!82 1I1L70' PCP/PEV PS PS PCP/PEV PS PS PCP/PEV PS PS PS PS PPD/PSD PPD/PSD CDS-PP PPD/PSD PPD/PSD PPD/PSD PCP/PEV PPD/PSD PS PS PS PPD/PSD PPD/PSD CDS-PP PPD/PSD PS PPD/PSD PPD/PSD PS PPD/PSD CDS-PP PS PPD/PSD PCP/PEV PS PCP/PEV PPD/PSD PS PCP/PEV PPD/PSD PS CDS-PP PPD/PSD PCP/PEV PPD/PSD PS PS PPDTPSD' PPD/PSD PS' PS-PPD/PSD CDS-PP PPD/PSD PS PPD/PSD PPD/PSD'Vendas Novas Vieira do Minho Vila do Conde Vila Pouca de Aguiar Vila Real de Santo Ant6nio Vila Verde Vinhais Vouzela 77.84 96.36 100 64.44 61.13 87.13 63.55 97.41 88.25 98.41 100 60.65 53.19 86.66 62.6 89.79 84.08 88.98 97 59.86 47.02 84.91 61.18 86.59 77.22 100 100 60.01 50.09 73.84 59.46 82.23 81.85' 95.94 99.25 61.24 52.86 83.14 61.70 89:01-. 5.27 4.87 1.50 2.16 6.06' 6.27 1.78 6.40 PCP/PEV PS PS PS PS PPD/PSD PS PS
Appendix 2: DEA efficiency results (37 municipalities)'
Municipality Albergaria a Velha Alenqii'er Aljustrel Ansiao Arganil Arouca Aveiro' Beja Benavente Caldks da' Rainha Castelo Branco Chathusca Entroncamentb Estremoz Evora Faro Figueira da Foz Grandola Idanh'a-a-Nova Ilhavo Marinha Grande' ObiSos Odeinira Oliveira de Azerheis Penacova Sabugal Sahtiago do Cacem S. Joab da Madeira] S.Pedro do'Sul Seia Sever do Vouga-Tavira 1994 100 90.82 100 100 73.66-l'Ob' lOO' 86; l r 88'.6l' l''OO' 100 85.01' 100 71.59 100 76.34 86:05 48.08 100 100' 100 94.49 55.09' 100' 97.85 75.48 63.92 100 70.95 97.01 100 62.69' 1995 100 100 99.29 89.5 71.44-100' 100' 93'.6 84.55' 93.96 100 77.52' 100 81.6 95.79' 88.36 87.33 55.23'' 100' 99.34' 91.6 l'o'o 52.4'9' 100' 92.99' 76.4'6 66.98 95.88 61.28 100 l'OO' 69.69 1996 94.59 70.84' 100' 100 68.76 89.54 100 82.45' 76' l'OO 100 80.08 100 76.41 10b 93.1'2-100 50.47 100 100 92'.4l 95.9'6' 4'9:98' 94.52 92.76 71.99 63.93 91.07 60.39 100 98.06 70.89 1997 69.32 lOO' 100 93.5 67.9 91.47 loo 100' 78.36' 100 100 73.03' 100 66.19 96;37 l'OO 100 44.94 iOO' 100' 78.53' 99. IT 46:32' 100 89.54 72.48' 69.51' 100' 67.7(5 89;08 100 70.46 Average 90.98 90:42 99.82' 95.75 70.44-95.25 100.00 90:54' 81'.8'8' 98.4'9' 100.00 78.91 100.0b 73.95 98.04 89.46 93.35 49.68 l'OO.OO 99.84 90.64 9i,i9 50,91 98:63" 93.2'9 74.10 66.09 96;74 65.ro 9i5.52 99:52 68.43' Std. Error l'4.66 1'3'.75 0.36 5:17 2.62 5:5''4' o.bb 7.8'3' 5:7'6' 3.02
o:oo'
5.00 b.oO 6.59 228 9.96 7.70 4.34 0.00' 0:33' 8.91 2'.60' 3:74 2^74 3.43 2.20 2.70 4.2'5 5.10' 5:16 0.97 3'.86' Winhing party . 1997 election's CDS-PP PS PCP/PEV PPD/PSD P S PS PS pcpypEv PCP/PEV ppb'/psb PS PCP/PEV PS PCP/PEV PCP/PEV PS PPD/PSD PCP/PEV PPD/PSD PPD/PSD' PS PS' PS PPD/PSD PPD/PSD PPD/PSD PCP/PEV CDS-PP' PS PS CDS-PP PPD/PSD Winning party 1993;elections CDS-PP PS^ PCP/PEV PPD/PSD PPD/PSD P S CbS-PP PCP/PEV P'CP/P'EV PPD/PSb ppb/psb pcpypEv PS PCP/PEV PCP/PEV PS PS PCP/PEV PS PS PS-PS PCP/PEV PPD/PSD PPD/PSD PS PCP/PEV CDS-PP PS PS CDS-PP PSTorres Vedras Trancoso Vale de Cambra Valen9a Vendas Novas 100 75.87 100 100 95.81 84.42 73.06 100 83.37 100 94.96 86.94 100 83.04 99.34 84.27 85.42 100 73.35 89.05 90.91 80.32 100.00 84.94 96.05 7.86 6.89 0.00 11.06 5.02 PS PPD/PSD PPD/PSD PS PCP/PEV PS PPD/PSD PPD/PSD PPD/PSD PCP/PEV References
Alesina A, Cukierman A (1990) The politics of ambiguity. Q J Econ CV:829-85b
Baleiras RN (1997) Political economy in local governments. PhD Dissertation, Universidade Nova de Lisboa
Becker G (1983) A theory of competition among pressure groups for political influence. Q J Econ XCVIII(3):371-400
Becker G (1985) Public policies, pressure groups, and dead weight costs. J Public Econ 28:329-347 Boussofiane A, Dyson RG, Thanassoulis E (1991) Applied data envelopment analysis. Eur
JOper Res 52:1-15
Costa JS (1997) Performance of Local Governments and Electoral Results, Rome, 37th European Congress of the Regional Science Association
De Borger B, Kerstens K (1996) Cost Efficiency of Belgian Local Governments: A Comparative Analysis of FDH, DEA, and Econometric Approaches. Reg Sci Urban Econ 26:145-170 Downs A (1957) An economic theory of democracy. Harper & Row, New York
Galles GM, Sexton RL (1995) Rational ignorance, deceptive advertising, and the size of govemment. J Soc Polit Econ Stud 20:423-434
Ganley JA, Cubbin JS (1992) Public sector efficiency measurement: Applications of Data Envelopment Analysis. Amsterdam: North-Holland
Gwartney J, 'Wagner RE (eds.) (1988) Public choice and constitutional economics. JAI, Greenwich
Hayes K, Chang S (1990) The relative efficiency of city-manager and mayor-council forms of govemment. South Econ J 57:167-177
Heyndels B, Smolders C (1994) Fiscal illusion at the local level: Empirical evidence for the Flemish municipalities 80:325-338
McNutt PA (1996) The economics of public choice. Contemporary issues in the political economy of goveming. Edward Elgar, Cheltenham
Mueller DC (2003) Public Choice III, Cambridge University Press, Cambridge
Mueller DC, Strattmann T (1994) Informative and persuasive campaigning. Public Choice 81:55-77
Osorio JM (1997), Equidade e eficiencia da redistribuipao fmanceira pelas autarquias locais, Dissertapao de Mestrado, Faculdade de Economia do Porto
Peltzman S (1990) How efficient is the voting market? J Law Econ 33:27-64 Rogoff K (1990) Equilibrium political budget cycles. Am Econ Rev 80(l):21-36
Rogoff K, Sibert A (1988) Elections and macroeconomic policy cycles. Rev Econ Stud LV:1-I6 Stratmann T (1991) What do campaign contributions buy? Deciphering causal effects of money
and votes. South Econ J 57(3):606-620
Tullock G (1965) Entry Barriers in Politics. American Economic Review 458-466 Wittman D (1989) Why democracies produce efficient results. J Polit Econ 97:1395-1424 Vanden Eeckaut P, Tulkens H, Jamar M (1993) Cost Efficiency in Belgian Municipalities in The
Measurement of Productive Efficiency: Techniques and Applications, H. Fried et al (eds.): Oxford University Press 300-334