Revista Brasileira de
Engenharia Agrícola e Ambiental
Campina Grande, PB, UAEA/UFCG – http://www.agriambi.com.br
v.20, n.10, p.869-873, 2016
Performance of pressure-compensating emitters
using treated sewage effluent for irrigation
João A. Fischer Filho
1, Vinicius M. R. de Oliveira
2, Alexandre B. Dalri
1& José R. Zanini
1 DOI: http://dx.doi.org/10.1590/1807-1929/agriambi.v20n10p869-873A B S T R A C T
This study aimed to evaluate the flow variation of pressure-compensating emitters using treated sewage effluent (TSE). A drip irrigation system with four types of pressure-compensating emitters (G1 - Naan Dan Jain Model Top Drip, G2 - Naan Dan Jain Model Naan PC, G3 - Drip-Plan, G4 - Naan Dan Jain Model Naan Amnon) was installed with TSE from the sewage treatment station, filtered through a disc filter (120 mesh). Seven evaluations of flow rate of the drippers were performed (0, 100, 200, 300, 400, 500 and 600 h of operation) operating at 100 kPa. The experimental design was completely randomized in a 4 x 7 factorial arrangement (4 models and 7 times) with four replicates and Tukey test to compare the means. The relative flow rate (Qr), flow rate coefficient of variation (CVQ) and degree of clogging (DC) were determined. It was found that the models of emitters were not much susceptible to clogging during the operation of the system. The G4 model showed better performance compared with the others, presenting mean Qr of 99.92%, CVQ of 2.69% and DC of 1.19% at the end of the experiment. The results revealed that emitters are affected by the time of use of TSE.
Desempenho de gotejadores autocompensantes
com efluente de esgoto tratado usado para irrigação
R E S U M O
Objetivou-se, neste trabalho, avaliar a variação de vazão de gotejadores autocompensantes utilizando efluente de esgoto tratado (EET). Um sistema de irrigação por gotejamento com quatro modelos de gotejadores autocompensantes (G1 - Naan Dan Jain Modelo Top Drip, G2 - Naan Dan Jain Modelo Naan PC, G3 - Drip-Plan, G4 - Naan Dan Jain Modelo Naan Amnon) foi instalado com efluente originado da estação de tratamento de esgoto, filtrado por um filtro de disco (120 mesh). Foram realizadas sete avaliações da vazão dos emissores (0, 100, 200, 300, 400, 500 e 600 h de funcionamento), operando a 100 kPa. O delineamento experimental foi inteiramente casualizado com arranjo fatorial 4 x 7 (4 modelos e 7 tempos), com 4 repetições e teste de Tukey para comparação das médias. Foram determinados a vazão relativa (Qr), o coeficiente de variação de vazão (CVQ) e o grau de entupimento (GE). Verificou-se que, com o funcionamento do sistema, os modelos de gotejadores foram pouco suscetíveis ao entupimento. O modelo G4 se destacou perante os demais apresentando Qr média de 99,92%, CVQ de 2,69% e GE de 1,19% no final do experimento. Os resultados obtidos permitem afirmar que o tempo de uso do EET afeta a vazão dos gotejadores. Key words:
wastewater trickle irrigation clogging water saving
Palavras-chave: água residuária irrigação localizada grau de entupimento economia de água
1 Universidade Estadual Paulista/Faculdade de Ciências Agrárias e Veterinárias/Departamento de Engenharia Rural. Jaboticabal, SP. E-mail:
joaofischer16@gmail.com (Corresponding author); abdalri@gmail.com; jrzanini@fcav.unesp.br
2 Universidade Federal de Viçosa/Centro de Ciências Agrárias/Departamento de Engenharia Agrícola. Viçosa, MG. E-mail: viniciusmro91@gmail.com
Introduction
The use of wastewater for irrigation is a viable alternative to supply water and nutrients to plants, besides raising global awareness for a better use of this finite resource. Domestic sewage stands out for being rich in organic material and considered as sustainable for the application in agriculture, especially treated sewage due to its composition and nutritional values (Oliveira, 2012). Another point to be considered is that the utilization of treated sewage constitutes an effective measure to control pollution, because it avoids the disposal of sewage in water bodies (Lima et al., 2005).
Localized irrigation can be used for the application of wastewaters, given the high uniformity of application of the effluent and low risk of contamination (Batista et al., 2013), besides operating at low pressures and with high efficiency (Puig-Bargués et al., 2010). The maintenance of high uniformity of water application in irrigation systems becomes fundamental for an efficient irrigation regarding the use of water resources and reduction of costs (Ribeiro et al., 2012). However, due to the presence of physical, chemical and biological agents in the sewage effluent, the drippers are susceptible to alterations in the flow rate and reduction in the application uniformity.
Alterations in the flow rate coefficient of variation of emitters are related to the process of clogging, which is mainly caused by the quality of the water used in irrigation, since the problem does not affect all drippers equally (Ribeiro et al., 2010). Therefore, based on the hypothesis that the use of low-quality water compromises the performance of emitters, the study about the effect of the time of continuous use of wastewater on drippers installed under field conditions allows the determination of possible alterations that may occur in the drippers.
Thus, this study aimed to evaluate the effect of the time of use of treated sewage effluent (TSE) as irrigation water on the performance of pressure-compensating drippers.
Material and Methods
The experiment was carried out at an Experimental Farm at the geographic coordinates of 21° 14’ 41.9” S and 48° 16’ 25.2” W. The “Dr. Adelson Taroco” Sewage Treatment Station, where the treated sewage effluent was collected to be used in the experiment, is located about 1.5 km away from the experimental area.
Under appropriate conditions, similar to those of an operational unit of localized irrigation, a field experiment was installed in a flat area, with negligible pressure drop in the lateral lines. Four models of pressure-compensating drippers were used in 4 lateral lines (LL), each one spaced by 0.5 m with 32 drippers, in which treated sewage effluent (TSE) was used for irrigation.
Chemical and total coliforms analyses were performed in the tested effluent, which resulted in pH = 7.1, total nitrogen = 53.0 mg L-1, total iron = 0.52 mg L-1, sedimentable solids = 0.2
mg L-1, sodium = 58.3 mg L-1 and total coliforms = 47.433 MPN
(100 mL)-1. It should be pointed out that the solids present in
the wastewater were removed using a disc filter (130 micra = 120 mesh) (Azud®), which was cleaned every two days.
The pressure-compensating drippers used in the experiment and their main technical characteristics are presented in Table 1. The first evaluation was performed with clean water and occurred after the experiment was set. Six flow rate tests were performed in the same drippers, previously identified, every 100 h. Sixteen emitters were evaluated in each LL, and four emitters characterized the replicates; thus, there were four replicates per LL. During the flow rate test, the pressure at the beginning of the LL was maintained at 100 kPa using a pressure regulator and monitored through Bourdon manometers and a mercury manometer. The system was activated 6 h per day, from Monday to Friday, totaling a time of use of 600 h and 140 days at the end of the experiment. The ends of the lines were opened once a week.
In the evaluations, collectors were placed below the drippers to collect the TSE. Each dripper was isolated using a string for a proper collection of the TSE. The time of collection was equal to 4 min; then, the collected liquid was weighed on an electronic scale and, later, the mass was transformed to L h-1,
adopting a specific mass of 1 g cm-3 for the TSE.
The performance of the drippers was evaluated through the calculation of relative flow rate (Qr) using Eq. 1, flow rate coefficient of variation (CVQ) using Eq. 2 and the degree of clogging (DC) using Eq. 3, described below.
Dripper Manufacturer Model Spacing
(m)
Pipe diameter (mm)
Pressure range (kPa)
Flow rate (L h-1)
G1 NaanDanJain TopDrip 0.30 16 040 - 250 1.70 G2 NaanDanJain NaanPC 0.75 16 100 - 350 2.50 G3 Drip-Plan Vardit 0.50 18 100 - 300 2.10 G4 NaanDanJain NaanAmnon 0.50 17 050 - 350 1.60
Table 1. Main technical characteristics of the evaluated pressure-compensating dripper pipes Qa
Qr 100
Qi
= ⋅
where:
Qr - relative flow rate, %; Qa - actual flow rate, L h-1; and,
Qi - flow rate at the beginning of the experiment, L h-1.
m
S
CVQ 100
q
= ⋅
where:
CVQ - flow rate coefficient of variation, %; S - standard deviation of the sample, L h-1; and,
qm - mean flow rate of the sample, L h-1.
CVQ is a statistical index that informs the flow rate variation for certain sample of drippers. It results from the project of the dripper, material used in its manufacture, quality (1)
with which the dripper is manufactured and the conditions of use during the irrigation (Keller & Bliesner, 1990).
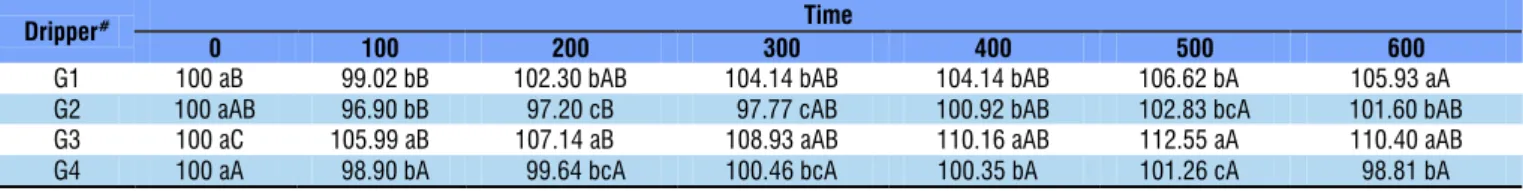
increase in Qr, reaching 101.60%. Among the studied drippers, the models G1 and G3 were characterized by greater flow rate variation along the operation time, showing higher increments in Qr values, respectively, of 105.93 and 110.40%, at the end of the experiment.
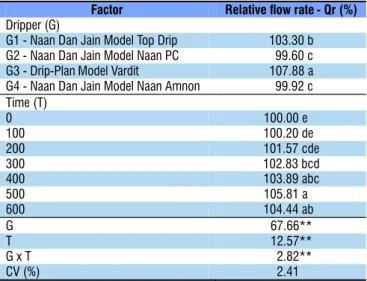
Analysis of variance and test of comparison of means (Tukey) were applied in order to quantify the effect of operation time on the studied drippers (Table 2). The comparison of means indicated that there were statistically significant differences between the models of pressure-compensating drippers evaluated at 600 h of operation. The best performances were obtained by the models G2 and G4, which did not differ and showed relative flow rates closer to 100%. The Qr of G3 was statistically different from those of the other drippers. This model showed the highest Qr of the four studied models, increasing its flow rate, on average, by 7.88%, thus characterizing inferiority in the distribution of TSE. The dripper G1 obtained increment of 3.30% in the flow rate and its Qr also differed statistically from the others.
As to the effect of time of use of the effluent on the drippers, there was a significant increase in the flow rate after 300 h of use of TSE, i.e., until that time the flow rate of the emitters remained statistically similar. The flow rates of the emitters were similar between 400 and 600 h, and the peak of highest flow rate occurred at 500 h and reduction at 600 h, similar to 300 h.
Corroborating these results, Carvalho et al. (2014) evaluated the susceptibility of different dripper pipes to clogging due to the application of soluble iron, organic load and solids in suspension, and observed that two models of drippers showed increase in relative flow rate because of an imbalance in the membrane of compensation. Such imbalance may have occurred through the deposition of physical particles between the membrane or even the amount of chemical elements in the effluent, which may damage the membrane.
Since there was significance, a follow-up analysis of the interaction dripper model x time was performed (Table 3).
G4 was the only model that did not show significant difference of its relative flow rate over time, which was always close to 100%. The dripper G3 showed the highest Qr variation
Qa
DC 1 100
Qi
= − ⋅
where:
DC - degree of clogging, %.
Since there is not a norm to characterize the susceptibility of the dripper to clogging, the criterion suggested by Barros et al. (2009) was adopted as the main analysis of the sensitivity of the emitters to clogging by the TSE, which is separated into three categories according to the sensitivity to clogging.
Since the literature does not have an index that expresses the severity of the degree of clogging of a dripper, the index suggested by Morata et al. (2014) was adopted in the analysis of the degree of clogging.
The experiment was set in a randomized design in a 4 x 7 factorial arrangement (four models and seven times) using Tukey test for the comparison of means, with four replicates for the comparison of means of the relative flow rates of the drippers. The analyses were performed using the computational program Assistat.
Results and Discussion
The variation in the relative flow rate (Qr) of the four models of pressure-compensating drippers over time shows that there was effect of the model of dripper on the relative flow rate, which varied differently for the studied drippers, as expected, i.e., there are drippers more susceptible to the alteration of the flow rate using TSE. It is worth noting that, in most of the operation time, Qr was higher than 100%, i.e., there was an increase in the flow rate of the drippers (Figure 1).
The dripper G4, in all tests, showed Qr closest to 100%, i.e., with smaller alteration of the flow rate; however, it was the only one with a slight reduction in the final flow rate at 600 h (Qr = 98.81%). G2 also showed Qr close to 100% during the studied period; however, at the end of the test, it showed
Figure 1. Relative flow rate (Qr) of four models of pressure-compensating drippers using treated sewage effluent as irrigation water as a function of the time of use
(G1 - Naan Dan Jain Model Top Drip; G2 - Naan Dan Jain Model Naan PC; G3 - Drip-Plan Model Vardit; G4 - Naan Dan Jain Model Naan Amnon)
90 100 110 120
0 100 200 300 400 500 600
Qr
(%
)
Time (hours) G1
G2 G3 G4
**Significant (p < 0.01); CV - Coefficient of variation
Factor Relative ow rate - Qr (%)
Dripper (G)
G1 - Naan Dan Jain Model Top Drip 103.30 b G2 - Naan Dan Jain Model Naan PC 099.60 c G3 - Drip-Plan Model Vardit 107.88 a G4 - Naan Dan Jain Model Naan Amnon 099.92 c Time (T)
0 100.00 eaa
100 100.20 dee
200 101.57 cde
300 102.83 bcd
400 103.89 abc
500 105.81 aee
600 104.44 aba
G 67.66**
T 12.57**
G x T 02.82**
CV (%) 02.41**
Table 2. Analysis of variance of the mean values of relative
flow rate (Qr) for the four pressure-compensating drippers studied using treated sewage effluent
at 600 h of operation. This increase in flow rate by the dripper G3 may cause poor distribution of wastewater in the line and also the application of wastewater rates higher than the planned ones, leading to problems such as contamination of the water table or even overdose of nitrogen and water application to the crop that can be irrigated with the TSE.
Based on these results, it can be inferred that the chemical elements present in the TSE do not cause clogging in the drippers and there is an increase in the flow rate; similar behavior was also reported by Teixeira (2006). Another factor to be discussed is the possibility of the occurrence of sludge deposition on the corners of the labyrinth of the dripper, altering its flow regime and increasing flow rate, which was also reported by Ravina et al. (1992).
According to Figure 2, there was an increase in CVQ in all studied models of drippers. Such variation occurred in different forms and intensities for each model and G1 showed the lowest CVQ variation at the end of the period of 600 h. At 600 h, G1 showed CVQ of 2.19%, followed by G4 with 4.86%, which had as characteristic two peaks of increment, at 400 and 600 h of operation; at the other periods, it always remained close to G1, around 2.00%.
At the end of the experiment, the drippers G2 and G3 showed CVQ of 6.05 and 6.12%, respectively. According to the norm NBR ISO 9261 (ABNT, 2006), it can be inferred that the four models of drippers evaluated in the present study can be considered as of optimal quality, from the manufacturing point of view.
Studying the effect of sewage effluent on six models of drippers, Li et al. (2009) observed that there are drippers more susceptible to clogging, especially those with smaller area of the opening and higher coefficient of variation of manufacture.
According to the criterion of sensitivity of the emitters to the reduction in flow rate proposed by Barros et al. (2009), the dripper G2 is characterized as sensitive from 500 h of operation on; G3, from 600 h of operation on, i.e., until 400 h, it did not show sensitivity to the reduction in flow rate. According to the same authors, only G3 showed Qr variation higher than 10% and CVQ above 5.50%, being characterized as sensitive to the reduction in flow rate. Although it does not have high Qr variation, G2 showed CVQ of 6.05% at the end of the experiment, i.e., also classified as sensitive. Differently, G1 and G4 are not considered as sensitive to flow rate reduction until the studied time, since they showed CVQ lower than 5.5% in all evaluations and equal to 2.19 and 4.86%, respectively, at the end of the experiment.
Similar results were obtained by Batista et al. (2012), who evaluated a drip irrigation system with three models of emitters applying treated pig farming wastewater and observed that there were no differences in two subunits (models) in relation to CVQ over time. However, these authors also concluded that the drippers of highest flow rates and lowest labyrinth length are less susceptible to clogging, which was not similar to the results of the present study, because drippers with the lowest flow rates showed the lowest CVQ.
Figure 3 shows the degree of clogging (DC) of the drippers in relation to the time of operation. There were reductions in the flow rate of the emitters for positive values and increases for negative values.
The use of TSE affects the flow rate of the emitters, with increments in three of them (G1, G2 and G3) and reduction in G4. Based on the index proposed by Morata et al. (2014), only G4 showed low severity of clogging, with value lower than 10%. Table 3. Follow-up analysis of the interaction dripper x time for the relative flow rate of the four models of drippers subjected to the use of treated sewage effluent as irrigation water
Dripper# Time
0 100 200 300 400 500 600
G1 100 aBa a99.02 bB 102.30 bAB 104.14 bAB 104.14 bAB 106.62 bAa 105.93 aAa
G2 100 aAB a96.90 bB 97.20 cB a97.77 cAB 100.92 bAB 102.83 bcA 101.60 bAB G3 100 aCa 105.99 aB 107.14 aBa 108.93 aAB 110.16 aAB 112.55 aAa 110.40 aAB G4 100 aAa a98.90 bA a99.64 bcA 100.46 bcA 100.35 bAa 101.26 cAa 98.81 bA
# G1 - Naan Dan Jain Model Top Drip; G2 - Naan Dan Jain Model Naan PC; G3 - Drip-Plan Model Vardit; G4 - Naan Dan Jain Model Naan Amnon
Same lowercase letters in the column and uppercase letters in the row do not differ by Tukey test at 0.01 probability level
Figure 2. Flow rate coefficient of variation (CVQ) of four
models of pressure-compensating drippers using treated
sewage effluent as irrigation water as a function of time
of use
(G1 - Naan Dan Jain Model Top Drip; G2 - Naan Dan Jain Model Naan PC; G3 - Drip-Plan Model Vardit; G4 - Naan Dan Jain Model Naan Amnon)
0.00 5.00 10.00
0 100 200 300 400 500 600
CVQ
(%
)
Time (hours) G1
G2 G3 G4
Figure 3. Degree of clogging (DC) of four models of pressure-compensating drippers using treated sewage effluent as irrigation water as a function of time of use
(G1 - Naan Dan Jain Model Top Drip; G2 - Naan Dan Jain Model Naan PC; G3 - Drip-Plan Model Vardit; G4 - Naan Dan Jain Model Naan Amnon)
-14.00 -12.00 -10.00 -8.00 -6.00 -4.00 -2.00 0.00 2.00 4.00
G1 G2 G3 G4
DC
(%
)
100 h
200 h
300 h
400 h
500 h
In the wastewater tanks, there is a great variety of phytoplankton and zooplankton, algae and bacteria that can agglomerate with solid particles suspended in the water and also with the mucilage (Capra & Scicolone, 2007), causing problems in the flow rate of the dripper pipes. It is probable that the presence of solids, chemical substances (such as iron and sodium) and microorganisms may have interfered with the membrane of compensation of the drippers, consequently leading to alteration in flow rate. According to Ravina et al. (1992), all drippers are vulnerable to clogging caused by biological growth, because they usually have narrow pathways and small openings that range from 0.5 to 1.5 mm.
Studying the performance of drippers subjected to critical conditions of water quality, Ribeiro et al. (2012) observed that the models of pressure-compensating drippers showed variable performance with respect to the susceptibility to clogging. Such operational variation of the emitters is correlated with the architecture of each dripper: length, shape and dimensions. Therefore, the effect of the characteristics of each model and the presence of chemical substances can justify the effects of the use of TSE in the studied drippers.
Conclusions
1. The time of use of treated sewage effluent (TSE) affects the coefficient of variation of pressure-compensating drippers in different forms and intensities.
2. The relative flow rate showed significant differences between the models of drippers; however, it is not much sensitive to clogging caused by the use of TSE.
3. Comparing the four studied models of drippers, G4 - Naan Dan Jain Model Naan Amnon stood out from the others, with relative flow rate of 99.92%, flow rate coefficient of variation of 2.69% and degree of clogging of 1.19%; thus, it was not sensitive to reduction and increase of flow rate over time and showed low degree of clogging.
Literature Cited
ABNT - Associação Brasileira de Normas Técnicas. NBR ISO 9261: Equipamentos de irrigação agrícola. Emissores e tubos emissores. Especificação e métodos de ensaio. São Paulo: ABNT, 2006. 16p. Barros, A. C.; Coelho, R. D.; Medeiros, P. R. F.; Melo, R. F.; Barboza Júnior, R. A.; Dias, C. T. S. Entupimento de gotejadores em função da aplicação de superfosfato simples e ácido nítrico. Engenharia Agrícola, v.29, p.62-71, 2009. http://dx.doi.org/10.1590/S0100-69162009000100007
Batista, R. O.; Oliveira, R. A.; Santos, D. B. dos; Oliveira, A. de F. M.; Azevedo, C. A. V. de; Medeiros, S. de S. Obstrução e uniformidade de aplicação em sistemas de irrigação por gotejamento aplicando-se efluente da suinocultura. Revista Brasileira de Engenharia Agrícola e Ambiental, v.17, p.698-705, 2013. http://dx.doi.org/10.1590/S1415-43662013000700002
Batista, R. O.; Silva, K. B.; Oliveira, R. A.; Barbosa Filho, S.; Dias, N. S. Desempenho hidráulico de sistema de irrigação por gotejamento aplicando água residuária de suinocultura. Agropecuária Científica no Semiárido, v.8, p.105-111, 2012.
Capra, A.; Scicolone, B. Recycling of poor quality urban wastewater by drip irrigation systems. Journal of Cleaner Production, v.15, p.1529-1534, 2007. http://dx.doi.org/10.1016/j.jclepro.2006.07.032 Carvalho, L. C. C.; Coelho, R. D.; Teixeira, M. B.; Cunha, F. N.; Silva,
N. F. Comportamento de gotejadores submetidos aplicação de ferro solúvel, sólidos em suspensão e fitoplâncton. Revista Brasileira de Agricultura Irrigada, v.8, p.538-547, 2014. http:// dx.doi.org/10.7127/rbai.v8n600265
Keller, J.; Bliesner, R. D. Sprinkle and trickle irrigation. New York: Van Nostrand Reinhold, 1990. 652p. http://dx.doi.org/10.1007/978-1-4757-1425-8
Li, J.; Chen, L.; Li, Y. Comparison of clogging in drip emitters during application of sewage effluent and ground water. Transactions of the ASABE, v.52, p.1203-1211, 2009. http://dx.doi. org/10.13031/2013.27797
Lima, S. M. S.; Henrique, I. N.; Ceballos, B. S. O.; Sousa, J. T.; Araújo, H. W. C. Qualidade sanitária e produção de alface irrigada com esgoto doméstico tratado. Revista Brasileira de Engenharia Agrícola e Ambiental, v.9 (sup.), p.21-25, 2005.
Morata, G. T.; Dantas, G. F.; Dalri, A. B.; Palaretti, L. F.; Faria, R. T.; Santos, G. O. Entupimento de gotejadores com uso de efluente de esgoto tratado sob dois sistemas de filtragem. Revista Brasileira de Agricultura Irrigada, v.8, p.86-97, 2014. http://dx.doi.org/10.7127/ rbai.v8n200227
Oliveira, E. L. (org.). Manual de utilização de águas residuárias em irrigação. Botucatu: FEPAF, 2012. 192p.
Puig-Bargués, J.; Arbat, G.; Elbana, M.; Duranros, M.; Barragán, J.; Cartagena, F. R.; Lamm, F. R. Effect of flushing frequency on emitter clogging in microirrigation with effluents. Agricultural Water Management, v.97, p.883-891, 2010. http://dx.doi. org/10.1016/j.agwat.2010.01.019
Ravina, I.; Paz, E.; Sofer, Z.; Marcu, A.; Schischa, A.; Sagi, G. Control of emitter clogging in drip irrigation with reclaimed wastewater. Irrigation Science, v.13, p.129-139, 1992. http://dx.doi. org/10.1007/BF00191055
Ribeiro, P. A. A.; Coelho, R. D.; Teixeira, M. B. Entupimento de tubos gotejadores convencionais com aplicação de cloreto de potássio (branco e vermelho) via duas qualidades de água. Engenharia Agrícola, v.30, p.279-287, 2010. http://dx.doi.org/10.1590/S0100-69162010000200010
Ribeiro, P. A. A.; Teixeira, M. B.; Coelho, R. D.; Franco, E. M.; Silva, N. F.; Carvalho, L. C. C.; Alves, M. E. B. Gotejadores submetidos a condições críticas de qualidade da água. Irriga, v.1, p.368-379, 2012. http://dx.doi.org/10.15809/irriga.2012v1n01p368 Teixeira, M. B. Efeito de dosagens extremas de cloro e pH na vazão de