___________________________________
1 Excerpt from the doctoral thesis of the first author, financed with funds by CNPq and FAPEMIG.
2 Engo Civil, Mestre em Engenharia Civil pela COPPE/UFRJ, Doutor em Eng. Agrícola pela UFV/DEA, Prof. Adjunto II do Depto
de Eng. Sanitária e Ambiental - ESA, Faculdade de Engenharia, UFJF, Juiz de Fora - MG, [email protected].
3 Engo Agrônomo, Mestre em Eng. Agrícola pela UFV/DEA, Doutor em Eng. Agrícola pela UFV/DEA, Prof. Associado III do
Depto. de Eng. Agrícola - DEA/UFV, Bolsista de Produtividade em Pesquisa do CNPq Nível 1A, Viçosa-MG, [email protected].
4 Engo Civil, Mestre em Eng. Civil pela COPPE/UFRJ, Doutor em Eng. Civil pela COPPE/UFRJ, Prof. Adjunto III do Depto de Eng.
Sanitária e Ambiental - ESA/UFJF, Juiz de Fora - MG, [email protected].
5 Engo Civil, Prof. Substituto, Doutorando em Recursos Hídricos e Ambientais, Depto. de Eng. Agrícola UFV/Viçosa - MG,
Recebido pelo Conselho Editorial em: 18-9-2009
DISPERSION OF SOLUBLE POLLUTANTS IN RIVERS1
CELSO B. DE M. RIBEIRO2, DEMÉTRIUS D. DA SILVA3, JOSÉ H. P. SOARES4, HUGO A. S. GUEDES5
ABSTRACT: Information about capacity of transport and dispersion of soluble pollutants in natural streams are important in the management of water resources, especially in planning preventive measures to minimize the problems caused by accidental or intentional waste, in public health and economic activities that depend on the use of water. Considering this importance, this study aimed to develop a warning system for rivers, based on experimental techniques using tracers and analytical equations of one-dimensional transport of soluble pollutants conservative, to subsidizing the decision-making in the management of water resources. The system was development in JAVA programming language and MySQL database can predict the travel time of pollutants clouds from a point of eviction and graphically displays the temporal distribution of concentrations of passage clouds, in a particular location, downstream from the point of its launch.
KEYWORDS:longitudinal dispersion, water pollution, computational modeling.
SISTEMA DE ALERTA COM BASE EM ESTUDO TEÓRICO-EXPERIMENTAL DE DISPERSÃO DE POLUENTES SOLÚVEIS EM RIOS
RESUMO: Informações sobre a capacidade de transporte e dispersão de poluentes solúveis em cursos de água naturais são importantes no gerenciamento dos recursos hídricos, principalmente no planejamento preventivo de medidas que visem a minimizar problemas à saúde pública e às atividades econômicas que dependem do uso da água, ocasionados por despejos acidentais ou intencionais. Considerando tal importância, este trabalho teve como objetivo desenvolver um sistema de alerta para rios, com base em resultados experimentais, utilizando técnicas de traçadores e equações analíticas de transporte unidimensional de poluentes solúveis conservativos, visando a subsidiar a tomada de decisão no gerenciamento dos recursos hídricos. O sistema desenvolvido em linguagem de programação JAVA e banco de dados MySQL permite prever o tempo de percurso da nuvem de poluentes a partir de um ponto de despejo de um poluente e apresenta, graficamente, a distribuição temporal de concentrações da passagem da nuvem, em um determinado local, à jusante do ponto do seu lançamento.
PALAVRAS-CHAVE: dispersão longitudinal, poluição hídrica, modelagem computacional.
INTRODUCTION
This critical situation required careful analysis during the implementation of new projects, when there is effluent disposal into rivers (MACHADO et al., 2008).
Thus, the quantification of parameters related to transport and dispersion of soluble pollutants into natural water streams is of great importance in the planning and management of water resources, especially in accidental or intentional cases, when it is necessary to warn the populations located downstream of the discharge site about the risks they are subjected when taking water from watercourses to meet their basic needs.
The warning system allows predicting the time course of the pollution cloud from an instantaneous or continuous discharge of an effluent and the graphical representation of the concentration distribution in time of the cloud passing a particular location downstream of the discharge site.
The complexity and diversity of natural water flows make a purely theoretical approach difficult to predict longitudinal dispersion parameters (DL). Experiments with tracers are an
appropriate approach to determine the longitudinal dispersion coefficient, as it allows to reliably simulate the movement and dispersion of the solute, implicitly taking into account all peculiarities and characteristics of transport and dispersion of the flow, according to studies reported by SOARES et al. (2010) and RIBEIRO (2007).
Another method used to predict DL is to employ empirical equations that allow estimation
based on flow-related parameters (RIBEIRO et al., 2010 and DEVENS et al., 2006).
It is known that there currently is a growing need of tools to assist in the planning and management of problems related to management of water resources (MACHADO et al., 2008). Thus, the main objective of this study was to develop a warning system for rivers, based on experimental results using tracer techniques and analytical equations of one-dimensional transport of conservative soluble pollutants.
MATERIAL AND METHODS
The study area where field studies were carried out to determine the coefficient of longitudinal dispersion comprises the Pomba River watershed, located in the Zona da Mata Mineira, an affluent of the Paraíba do Sul River (Figure 1).
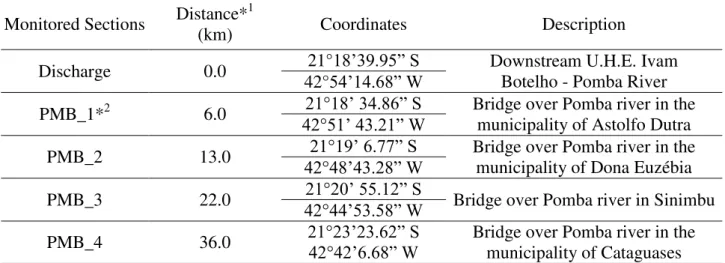
Four sections of the Pomba River watershed, comprising a 36-km stretch, were monitored. The monitored stretch includes the municipalities of Astolfo Dutra (PMB1), Dona Euzébia (PMB2), Sinimbú (PMB3) e Cataguases (PMB4), as shown in Figure 2. Two experiments were conducted to determine "on site" the characteristics of transport and dispersion of the Pomba River. The first experiment was performed in 27-28 May 2006, and the second one, in April 14-15, 2007, in order to characterize the behavior of the river at different times.
FIGURE 2. Monitoring sections of the Pomba River.
Table 1 shows the main features of the monitoring sections of the Pomba River.
TABLE 1. Characteristics of the monitoring sections of the Pomba River.
Monitored Sections Distance*1
(km) Coordinates Description
Discharge 0.0 42°21°54’14.68” W18’39.95” S Downstream U.H.E. Ivam Botelho - Pomba River
PMB_1*2 6.0 21°18’ 34.86” S Bridge over Pomba river in the
municipality of Astolfo Dutra
42°51’ 43.21” W
PMB_2 13.0 21°19’ 6.77” S Bridge over Pomba river in the
municipality of Dona Euzébia
42°48’43.28” W
PMB_3 22.0 21°20’ 55.12” S Bridge over Pomba river in Sinimbu
42°44’53.58” W
PMB_4 36.0 21°23’23.62” S42°42’6.68” W Bridge over Pomba river in the municipality of Cataguases *1 Distance in relation to the point where the tracer was discharged. *2 monitoring point in the Pomba River.
Field and laboratory work to determine the DL
It was chosen to perform an instantaneous tracer discharge, as shown in Figure 3.
FIGURE 3. Instantaneous discharge of tracers Amidorhodamine G Extra and Uranina in the Pomba River, downstream of the Ivan Botelho hydroelectric power plant.
Dislocation monitoring of the tracer cloud was conducted from fixed coordinates (monitoring sections), over bridges, featuring an Euler monitoring type. During the field experiments, a Turner fluorometer Model 10, given by the Tracer Laboratory at COPPE/UFRJ, was used to detect "on site" tracer concentrations in the range between 0.5 and 1.0 ppb, to evaluate the displacement of the tracer cloud. Approximately 400 water samples (approximate 100 mL volume each) were collected in each experiment, with approximately 100 samples in each section (PMB1, PMB2, and PMB3 PMB4) in regular time intervals, ranging from 10 to 30 minutes, according to the hydrodynamic development downstream of the tracer cloud.
The laboratory work consisted of preparing standard solution concentrations of 0.1; 0.2; 0.5; 1.0; 2.0; 5.0 and 10.0 μg L-1for calibration curves (water was used as diluting agent, being 1 μg L-1 equivalent to 1 ppb), using 20 liters of water collected from the Pomba river as solvent. Fluorimetry measurements of standard dilutions allowed the establishment of calibration curves to linearly correlate with the fluorescence patterns with their concentrations. From these curves, it was obtained concentration values for each sample collected in the field.
One-dimension mass transport equation for DL determination
The determination of the longitudinal dispersion coefficient (DL), from the tracer experiments
is based on the equation of one-dimensional mass transport (advection and dispersion) of conservative constituents (Equation 1):
2 2
L x
C D x C U t C
(1)
where,
C - average concentration of soluble substance, ML-3; t - time, T;
U - average flow speed, LT-1;
DL - longitudinal dispersion coefficient in the direction of flow, L2T-1;
x - distance traveled by the pollutant, L;
x C U
- advective transport, MT-1L-3, and
2 2
L
x C D
- dispersive transport of pollutant, MT-1L-3.
Considering the initial condition equivalent to an instantaneous discharge uniformly distributed over the cross section, i.e., an amount of mass M in a concentrated infinitely small space at time t = 0 and the origin of the x-axis, we have (Eq. 2 and 3):
C (0, t0) = M δ(x) (2) C (x ≠ 0, t0) = 0 (3) where, δ(x) equals to Dirac delta function and M is the constituent mass (kg).
And for the surrounding conditions, considering the equations (4) e (5):
C (-∞, t) = 0 (4)
C (+∞, t) = 0 (5)
The solution is a Fick’s model, also known as the Taylor’s model or method of adjustment, as
shown in Equation (6):
t 4D
Ut) (x exp t) D
π
(4 A
M t)
C(x,
L 2
L
(6)
where,
C - concentration of constituent or pollutant, ML-3; M - mass of constituent discharged, M;
A - area of cross-section, L2;
DL - longitudinal dispersion coefficient, L2T-1;
U - flow rate, LT-1, and
X e t - spatial (L) and temporal (T), variable, respectively.
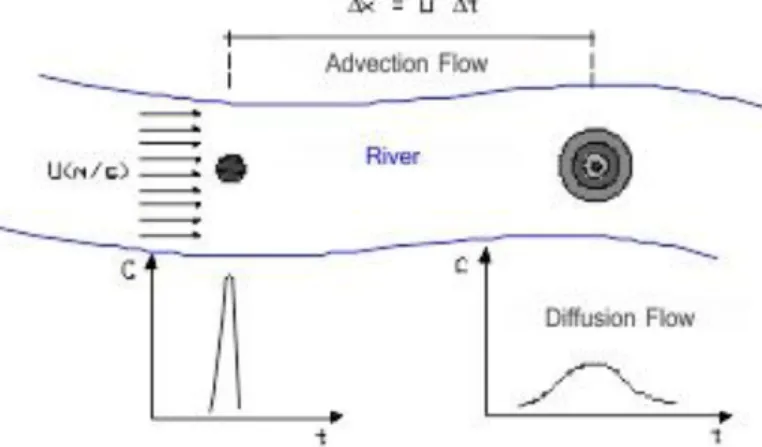
Figure 4 illustrates the effects of physical processes of diffusion and advection, where the advective flow is responsible for the displacement x and diffusive flow causes the dispersal of soluble substances in the flow.
FIGURE 4.Illustration of mass transport of a substance discharged instantaneously in a uniform and laminar flow by advection and diffusion mechanisms.
DEVENS et al. (2006) reported that the convolution method has the advantage of being independent of the form of discharge of the soluble constituent.
Development of the warning system
For the construction of the graphical interface, it was used JAVA programming language, and to store information on water samples collected in the Pomba River, as well as internally generated data in the model, it was used the MySQL database.
Methods of adjustment and convolution were respectively used to predict the transport and dispersion of pollutants from immediate and continuous pollutant source. In this case, DL is no
longer unknown and becomes an important input parameter to feed the predictive models of pollutant transport.
It is noteworthy that in the case of a continuous release, for example of an industry, one must provide flow values of the released effluent over time, and the concentration of the substance discharged in each time point, to allow calculating the concentration of the first occurrence or the mixture in the river, by using Equation (7).
E Q Q E Q E C Q R C M C
(7)
where,
CM - concentration of first occurrence or the mixture, ML-3;
CR - concentration of the substance in the river, ML-3;
Q - river flow rate, L3T-1;
CE - substance concentration in the effluent, ML-3, and
QE - effluent flow rate, L3T-1.
The convolution method (Equations 8 and 9) uses the principle of superposition of effects to generate, through a convolution integral of the distribution upstream, the concentration distribution in a section downstream.
dττ) -(t 4D τ) U(t Δx exp τ) -(t D π Q 2 U τ) , m(x t) , C(x L 2 τ
τ 2 L
1 2 f i
(8)where,
C(x2, t) - tracer (or contaminant) concentration in the downstream section at time t, composed
by the superposition of the responses of units discretization of instant mass, from the distribution curve concentrations upstream, ML-3;
m (x1, τ) - unit of tracer (or contaminant) mass measured upstream, by slicing of the area under the curve in a time τ, M;
τ - times corresponding to the passage of the concentration distribution curve of the upstream section, T;
τi - instant of time corresponding to the beginning of the concentration distribution curve of
the upstream section, T;
τf - instant of time corresponding to the end of the concentration distribution curve of the
upstream section, T;
t - instant of time corresponding to the passing of the concentration distribution curve of the upstream section, T;
Qi - flow rate of the river in the section considered, where i can be either 1 or 2. When i
equals to 1, it represents the upstream section; and when i equals 2, it represents the downstream section, L3T-1, and
x - distance between the upstream and downstream sections of the stream, L.
Q1 2 τ 1 τ τ , 1 x C 1 τ , 1 x C τ , 1 x m (9)
Figure 5 illustrates the mass transport of a soluble substance continuously discharged over time, using the convolution method for downstream discharge mass transfer.
The system also allows the automatic determination of the average speed and dispersal capacity of the river (DL) in the studied section, or interactively, from the adjustment of the Taylor’s
Fick model or the convolution of concentration values of the travel curve experimentally determined in the field with the use of tracer.
FIGURE 5. Illustration of mass transport of a soluble substance discharged continuously by advection and diffusion mechanisms.
In the alternative of automatic adjustment, the mean square error (RMSE) is used to automatically determine the best combination of speed values U and DL, so that the mean square
error between the experimentally measured values and the values adjusted by the models are the smallest possible.
N 1 i 2 i O i E N 1EMQ (10)
where,
Ei - estimated values for the ith event;
Oi - observed values for the ith event, and
N - number of events.
In the option of manual adjustment, the coefficient of dispersion and average travel speed of the section under study are provided interactively by the user until the adjustment of the model visually best fit the measured values.
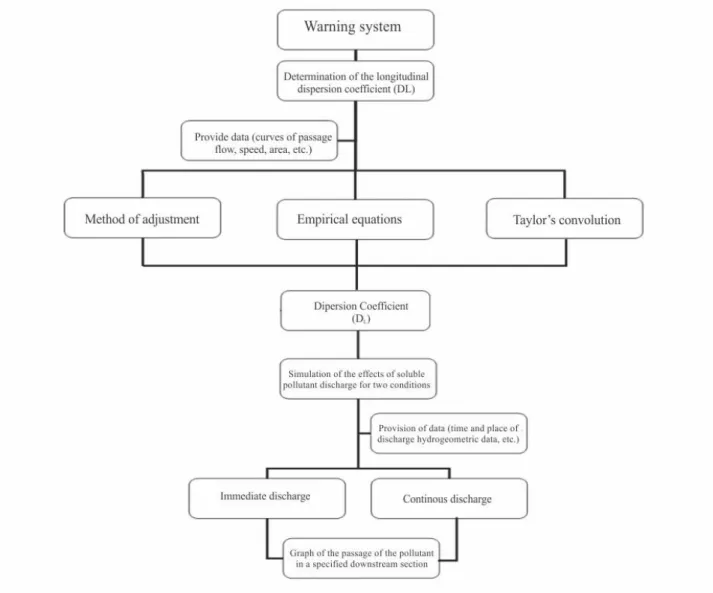
FIGURE 6. Flow chart of the system.
RESULTS AND DISCUSSION
The warning system developed herein enables working with two distinct modules. The first module refers to the calculation of the longitudinal dispersion coefficient from experimental field results or by means of empirical formulas, being particularly important for calibrating water quality models that use this parameter in its structure. The second module includes the warning system itself, which can simulate the effect of an accidental or intentional, instantaneous or continuous, discharge in a downstream section of interest, serving as an important mechanism to alert citizens that use water resources in situations of discharge of potentially toxic substances.
Module I system - calculating DL
FIGURE 7. Data registration (flow rate, mean speed, distance to the local discharge) relative to monitoring sections in a tracer experiment.
After filling in the information with data relative to a field experiment, the system allows to determine the parameters of longitudinal dispersion and average travel speed, for each monitoring section, automatically or interactively.
Figure 8 illustrates an automatic determination of the longitudinal dispersion coefficient and mean speed of the flow.
FIGURE 8. DL and U calculation: (a) considering an instantaneous pollutant discharge (Adjustment
Method); (b) considering a continuous pollutant discharge in the water flow (Convolution Method).
Still in the first module of the program it is possible to determine the longitudinal dispersion coefficient by means of empirical formulas, as presented in Figure 9.
FIGURE 9. DL calculation through empirical equations (RIBEIRO et al., 2010).
It is worth noting that 13 different empirical formulas can be chosen to calculate the value of DL by opening the box next to the "proposed formula". Once the formula is chosen, its image
appears on the right side of the screen of the system, as shown in Figure 9.
Module II of the system - warning system
The warning system module allows simulating the effects of an accidental or intentional discharge of a soluble substance in a downstream section (defined by their distance from the discharge site).
The user must first choose between two types of discharge, instantaneous or continuous. Once it is defined, the user should enter the hydrogeometric data of the river (flow rate, average speed of flow and the longitudinal dispersion coefficient) into the system as well as the discharge characteristics, including the mass instantaneously discharged, in the case of instant discharge, or the effluent distribution concentrations over time, in case of continuous discharge, and local information, such as: discharging site, substance, time and date of discharge, and the distance from the section of interest to the discharging site.
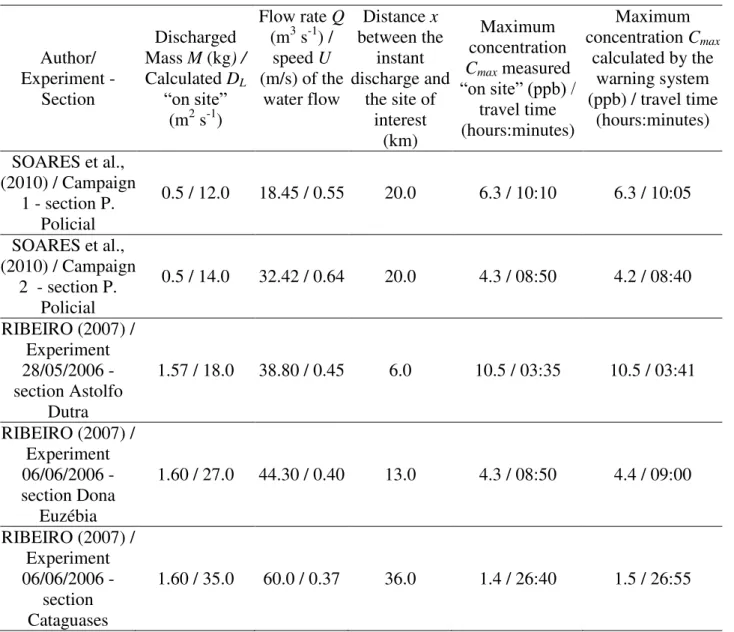
The system was tested based on data acquired from experiments performed by SOARES et al. (2010) and RIBEIRO (2007).
TABLE 2. Data used for comparison of system performance against experimental results from literature. Author/ Experiment - Section Discharged Mass M (kg) /
Calculated DL
“on site”
(m2 s-1)
Flow rate Q
(m3 s-1) / speed U
(m/s) of the water flow
Distance x
between the instant discharge and
the site of interest
(km)
Maximum concentration
Cmax measured
“on site” (ppb) /
travel time (hours:minutes)
Maximum concentration Cmax
calculated by the warning system (ppb) / travel time
(hours:minutes)
SOARES et al., (2010) / Campaign
1 - section P. Policial
0.5 / 12.0 18.45 / 0.55 20.0 6.3 / 10:10 6.3 / 10:05
SOARES et al., (2010) / Campaign
2 - section P. Policial
0.5 / 14.0 32.42 / 0.64 20.0 4.3 / 08:50 4.2 / 08:40
RIBEIRO (2007) / Experiment 28/05/2006 - section Astolfo
Dutra
1.57 / 18.0 38.80 / 0.45 6.0 10.5 / 03:35 10.5 / 03:41
RIBEIRO (2007) / Experiment 06/06/2006 - section Dona
Euzébia
1.60 / 27.0 44.30 / 0.40 13.0 4.3 / 08:50 4.4 / 09:00
RIBEIRO (2007) / Experiment 06/06/2006 -
section Cataguases
1.60 / 35.0 60.0 / 0.37 36.0 1.4 / 26:40 1.5 / 26:55
From the results presented in Table 2, it can be seen that the performance of the warning system is very satisfactory when comparing to the results measured experimentally and calculated with the system.
Figures 10 (a) and (b) show, respectively, input and warning system data for simulated results for the discharge conditions presented in Table 2, considering the experiment reported by SOARES et al. (2010), Campaign 1 - section P. Policial.
FIGURE 10. (a) Input data to simulate the effect of a continuous discharge of effluent in a section located 20.0 km downstream; and (b) Effect of instantaneous discharge of a soluble substance in a section distant 20.0 km from the discharge.
A difference between our system and Hydrus, is that the system developed in this work, called "Dispersion", also allows estimating the environmental impact by convolution techniques, of continuous discharge, with the possibility of simulations of instant discharge and to obtain the coefficient of dispersion from experimental results or empirical equations coupled to the system. It also allows the generation of a summary report that outlines the main information related to the discharge, allowing rapid decision-making in case of accidents with soluble pollutants (Figure 11).
FIGURE 11. Summary report generated by the system. (a)
CONCLUSIONS
The computer system developed herein allows determining the value of the longitudinal dispersion coefficient (DL), and from this, to assess the effects of instant or continuous discharges of
soluble effluents in a particular downstream section of a water stream.
The comparison made between the experimental results of campaigns carried out "on site" with tracers, with the results generated by the warning system showed an excellent performance in predicting the transport of a soluble pollutant, in the section of interest downstream of the discharge, from information of a few parameters of the flow.
The system allows generating a summary report containing information from the time of arrival and travel of the pollutant cloud in a particular section of interest, contributing significantly to the management of water resources, as it enables to proactively warn users of water from a river basin, especially in situations of accidental discharges of potentially toxic substances.
ACKNOWLEDGEMENTS
The authors acknowledge the financial support granted by CNPq and FAPEMIG, students and teachers at the Universidade Federal de Viçosa and Universidade Federal de Juiz de Fora that contributed to the field experiment in the Pomba River, the Companhia Força e Luz Cataguazes-Leopoldina for make hourly data flows available and the Tracer Laboratory of COPPE/UFRJ for providing materials, equipment and infrastructure needed for this study.
REFERENCES
DAGA, J.; CAMPOS, A.T.; FEIDEN, A.; KLOSOWSKI, E.S.; CÂMARA, R.J. Análise da adequação ambiental e manejo de dejetos de instalações para suinocultura em propriedades na região oeste do Paraná. Engenharia Agrícola, Jaboticabal, v.27, n.3, p.587-595, 2007.
DEVENS, J.A.; BARBOSA JR., A.R.; SILVA, G.Q. Modelo de quantificação do coeficiente de dispersão longitudinal de pequenos cursos de água naturais. Revista de Engenharia Sanitária e Ambiental, Rio de Janeiro, v.11, n.3, p.269-276, 2006.
GUEDES, H.A.S.; RIBEIRO, A.C.J.; SOARES, J.H. Hydrus - Sistema computacional para avaliação da capacidade de transporte e dispersão do rio Paraibuna utilizando a técnica da convolução. In: SIMPÓSIO BRASILEIRO DE RECURSOS HÍDRICOS, 17., 2007, São Paulo.
Anais...
MACHADO, M.B.; FURLAN, L.T.; FURLAN, M.L.; TOMAZ, E.; NUNHEZ, J.R. Software para modelagem de dispersão de efluentes em rios. Revista de Engenharia Sanitária e Ambiental, Rio de
Janeiro, v.13, n.3, p.291-297, 2008.
MORAES, L.M.; PAULA JÚNIOR, D.R. Avaliação da biodegradabilidade anaeróbia de resíduos da bovinocultura e da suinocultura. Engenharia Agrícola, Jaboticabal, v.24, n.2, p.445-454, 2004.
PRUSKI, F.F. Conservação de solo e água: práticas mecânicas para o controle da erosão hídrica.
Viçosa: UFV, 2006. 240 p.
RIBEIRO, C.B.M. Sistema de alerta ambiental fundamentado em estudo teórico-experimental de transporte e dispersão de poluentes solúveis em cursos d’água. 2007. 144 f. Tese (Doutorado) - Universidade Federal de Viçosa, Departamento de Engenharia Agrícola, Viçosa, 2007.
RIBEIRO, C.B.M.; SILVA, D.D.; SOARES, J.H.P.; GUEDES, H.A.S. Desenvolvimento e
validação de equação para determinação do coeficiente de dispersão longitudinal em rios de médio porte. Revista de Engenharia Sanitária e Ambiental, Rio de Janeiro, v.15, n.4, p.393-400, 2010.