three dimeNsioNal characterizatioN of soil
macroporosity by X-ray microtomography
sabrina passoni(1), luiz fernando pires(2)*, richard heck(3) and Jadir aparecido rosa(4)
(1) Centro de Ensino Superior dos Campos Gerais, Ponta Grossa, Paraná, Brasil.
(2) Universidade Estadual de Ponta Grossa, Departamento de Física, Ponta Grossa, Paraná, Brasil. (3) University of Guelph, School of Environmental Sciences, Guelph, Ontario, Canada.
(4) Instituto Agronômico do Paraná, Pólo Regional de Pesquisa de Ponta Grossa, Ponta Grossa, Paraná, Brasil.
* Corresponding author. E-mail: [email protected]
abstract
analysis of the soil pore system represents an important way of characterizing soil structure. properties such as the shape and number of pores can be determined through soil pore evaluations. this study presents a three-dimensional (3d) characterization of the shape and number of pores of a sub-tropical soil. to do so, a second generation X-ray microtomograph equipped with a plain type detector was employed. a voltage of 120 kV and current of 80 ma was applied to the X-ray tube. the soil samples analyzed were collected at three different depths (0-10, 10-20, and 20-30 cm). the results obtained allowed qualitative (images) and quantitative (3d) analyses of the soil structure, revealing the potential of the microtomographic technique, as well as the study of differences in soil macroporosity at different depths. macroporosity was 5.14 % in the 0-10 cm layer, 5.10 % in the 10-20 cm layer, and 6.64 % in the 20-30 cm layer. the
macroporosity of unclassified pores (UN) was 0.30 % (0-10 and 10-20 cm) and 0.40 % (20-30 cm),
while equant pores (eQ) had values of 0.01 % at the three depths under analysis.
Keywords: soil structure, pore size distribution, soil porosity, image analysis, soil microstructural components.
RESUMO: CARACTERIZAÇÃO TRIDIMENsIONAl DA MACROPOROsIDADE DO sOlO POR MICROTOMOGRAFIA DE RAIOs-X
A análise do sistema poroso do solo representa um importante passo para caracterizar a sua estrutura. Propriedades como formato e número de poros podem ser determinadas a partir de medidas do sistema
INtROdUctION
Soon after the development of the first computerized tomographic systems (CT) in the medical field in the
early 70s of the last century, researchers in the area of soil physics started to employ this technique to study different soil properties (Petrovic et al., 1982;
Crestana et al., 1992). Computerized tomographic analysis enables identification and characterization
of soil microstructural components, including the pore system (Jongerius et al., 1972).
More recently, research employing this technique for the study of soils have allowed researchers all over the world not only to investigate the physical properties of this heterogeneous medium (Pires et al., 2004, 2005; Papadopoulos et al., 2009; Tippkötter et al., 2009; Borges et al., 2012; Rab et al., 2014), but also to develop and evaluate the method applied to it (Oh and Lindquist, 1999; van Geet et al., 2003; Elliot and Heck, 2007a,b; Tarquis et al., 2009; Moreira et al., 2012; Tarquis et al., 2012). In this
context, the technique has proven to be efficient for characterization of the soil pore system.
Analysis which was previously limited to sections
or blocks could finally be extrapolated to 3D, and
in a non-invasive way (Taina et al., 2008, 2010).
The soil pore system is characterized by different pore sizes. Soil pores exist between and
within aggregates; macropores are large pores, usually found between aggregates. Macropores and biopores drain freely through gravity and allow easy movement of solutes and gases. These pores therefore also give rise to environmental concerns because of possible chemical transport
through the soil profile. Toxic substances can infiltrate very quickly and deeply through the
macropores, impairing groundwater quality (Marshall et al., 1999).
However, not only the size of macropores is
important, but also their number and shape. From the perspective of soil dynamics, the number of
macropores is a relevant parameter for inferring the degree of solute infiltration (Allaire-Leung et al., 2000), and the number of these macropores,
associated with size, shape, orientation, and
distribution, might influence solute flow and retention rates in the soil (Hillel, 1998; Rasiah and Aylmore, 1998). It should be noted that studies in the literature concerning the shape of macropores in 3D are scarce (Al-Raoush and Alshibli, 2006; Tippkötter et al., 2009; Luo et al., 2010; Rab et al., 2014), especially for soil samples from tropical regions.
In that context, the aim of this study was to
characterize the macropore system of a Brazilian
sub-tropical soil, considering three different
depths, through X-ray μCT. For that purpose, the distribution of the size and shape of macropores was analyzed.
material aNd methods
experimental area, sample collection and preparation
The study was carried out using samples collected from the experimental farm of the Instituto Agronômico do Paraná (Agricultural Research Institute of Parana) in the municipality
of Ponta Grossa, PR, Brazil (25° 06’ S, 50° 10’ W,
875 m above sea level). The soil under study was
characterized as a Rhodic Ferralsol with a clayey
texture (587 g kg-1 clay, 237 g kg-1 silt, and
176 g kg-1 sand).
The area selected for the experiment had been under a no-tillage management system for more than 25 years. Seasonal crop rotations were made in the area. They consisted of black oat or vetch in winters and corn or soybean in summers. The
area is usually subject to agricultural traffic during
planting (one pass), harvesting (one pass), and plant health treatments.
poroso do solo. Este estudo apresentou uma caracterização em três dimensões (3D) do formato e número de poros de um solo subtropical. Um microtomógrafo de raios-X de segunda geração equipado com detector do tipo plano foi utilizado neste trabalho. A voltagem e corrente de operação foram, respectivamente, 120 kV e 80 mA. As amostras de solo analisadas foram coletadas em três diferentes profundidades (0-10, 10-20 e 20-30 cm). Os resultados possibilitaram análises qualitativas (imagens) e quantitativas em 3D da estrutura do solo, revelando o potencial da técnica microtomográfica e também o estudo de diferenças na macroporosidade do solo em diferentes profundidades. A macroporosidade foi de 5,14 %, na camada de 0-10 cm; 5,10 %, em 10-20 cm; e 6,64 %, em 20-30 cm. A macroporosidade dos poros não classificados (NC) foi de 0,30 % (0-10 e 10-20 cm) e 0,40 % (20-30 cm), ao passo que os poros do tipo equante (EQ) apresentaram valores de 0,01 % para todas as profundidades analisadas.
For sample collection, trenches were opened and soil blocks of around 20 × 20 × 10 cm (length × width × height) were extracted from the 0-10, 10-20, and 20-30 cm layers. The procedures to obtain the blocks were: a) cutting off the remaining vegetation with a sharp scissors; b) manual digging of a rectangular trench around the prospective sample; c) subsequent carving of the undisturbed block with knife blades; and d) packing the soil core for transport. Sampling was carried out after harvest. These blocks were thoroughly broken up, dried in air, and then placed in acrylic tubes with 6.4 cm internal diameter and 15.0 cm height.
obtaining microtomographic images
S a m p l e s w e r e s c a n n e d w i t h t h e X - r a y
microtomograph, GE Medical μCT EVSMS-8. This
equipment is a second generation system, which
performs a 360° rotation, equipped with a 2D
geometry detector plate and conic X-ray beam. A
voltage of 120 kV and current of 80 mA was applied
to the X-ray tube.
An external copper filter was used between the
source and the sample, which enabled attenuation of the low frequency X-ray photons and the passage of a monoenergetic beam.
Due to the source-sample-detector distance, each acrylic cylinder containing soil samples was subjected to four scans. They were carried out vertically (+Z), from the bottom to the top of the cylinder. The exposure time for each complete scanning procedure
was 3,500 ms, with a 0.5° angular step, for a total
acquisition time of 3 h for each sample tube.
pre-processing of microtomographic images
sub-volume selection
Sub-volumes were selected by using the GEHC
Microview (GE Healthcare, 2006), beginning from the center of the image and excluding sample boundaries (Figure 1a). The sub-volumes selected
were 4.2 × 4.2 × 3.3 cm (58.2 cm3) for a 60 μm image
resolution (Figure 1b). Image reconstruction was
carried out through the filtered back-projection
method, followed by application of a local Gaussian
filter in order to reduce image noise (Buzug, 2008).
extraction of low variability voxels
The low variance voxels (in tomographic units - TU)
were classified according to Elliot and Heck (2007a,b)
using the Image J program (Rasband, 2007).
The objective was to obtain the variability of 124 neighboring voxels to a central one (window 5 × 5 × 5). The evaluation of voxels was carried out as follows: a) calculation of the average of the neighboring voxels; b) comparison of this average with the central voxel value; and c) calculation of the standard deviation
(σ). Voxels with values of σ < 0.1 in relation to the central voxel may be classified as low variability (LV),
representing a homogeneous region in the image resulting from elements of similar composition within
the sample. Voxels with values σ > 0.1 in relation to the central voxel may be classified as high variability (HV), also called pure voxels.
artifact correction
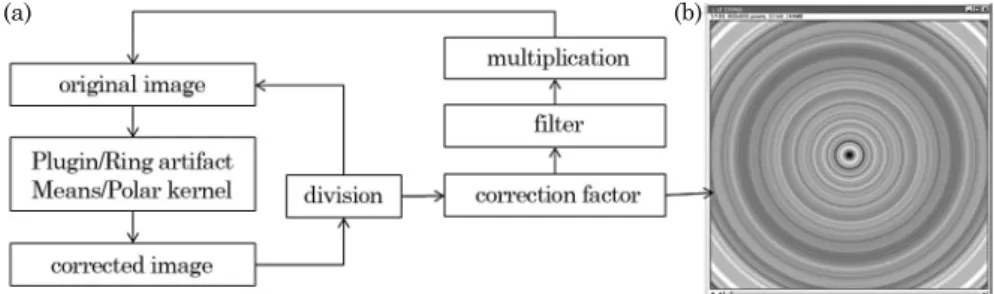
The images were subjected to a specific treatment (Figure 2) aiming to minimize ring-shaped artifacts
in the images using the program Image J.
segmentation
The two best threshold values that could represent the solid and gaseous phases of the soil were obtained through use of the programs
OriginPro (OriginLab Corporation, 2006) and
Image J, based on the histograms provided by the images. This procedure was divided into two phases (statistical and visual methods).
i) statistical method:The histogram generated by the distribution of values represents the different shades of gray corresponding to the sample constituents. Central arrows were added to the two main peaks, which certainly represent the gray
values corresponding to air and solid. With the aid of figure 1. (a) sub-volume (x=4.2 cm, y=4.2 cm and z=3.3 cm; V=58.2 cm3) selected for the reconstruction and (b) 16 bit image rebuilt with 60 µm image resolution. in this image, the less dense materials (pores) in the sample are represented in darker gray, and the denser ones (minerals) in lighter gray.
(a)
an auxiliary graph, whose function is to extend the curves, it was possible to see the secondary peaks around the two main ones, to which for four to eigth arrows were added (Figure 3). Each arrow, added both to the right and to the left of the main peak, has
a maximum center value (MC) and variance (VAR).
This procedure was carried out aiming to obtain the
highest possible number of MC and VAR values to
determine the limit value for the transition between the two phases. In the transition region, the exact value corresponding to air and solid within a sample is not known. In order to reduce the transition region, a variable (Zscore) was used to extend the curves (air and solid) together with the average data,
MC, VAR, and standard deviation.
ii) Visual method: This method consisted of the determination of two values of gray contained in the histogram which best represent the solid phase and the air in the samples. Therefore, the original image sequence was duplicated and placed side by side. In order to determine the value corresponding to the pores, the upper bar was placed totally to the left and the lower bar was adjusted, taking the original image replication (Figure 4) as reference. In order to determine the value corresponding to the soil, the same procedure was performed, but with the lower bar placed totally to the right. Threshold values were determined according to the best original image approximation, trying not to overestimate or underestimate the image porosity, seeking a threshold value that could best represent the original.
Threshold values corresponding to air and solid were compared to the values obtained through the statistical method and values below the air value
were defined as air, whereas values above the solid value were defined as solid. Values corresponding to the transition region were automatically defined by the program. The final result of this process is a
binary image, in which pores are represented by the color white and the solid phase by black.
microtomographic image processing
Regarding the characterization of soil macropores, these were classified according to the shape (Table 1 and Figure 5) and size interval (Table 2).
The pore volume, total pore volume, and macroporosity (MAP) were calculated according to equations (1, 2, and 3), where the volume was
multiplied by the voxel resolution (mm3). The
number of macropores (NMAP) was obtained directly from the software Image J.
Vpore = Vvoxel (0.063) Eq. 1
Vtotal = ∑Vpore Eq. 2
MAP (%) = (∑Vpore / Vsample) × 100 Eq. 3
RESUltS aNd dIScUSSION
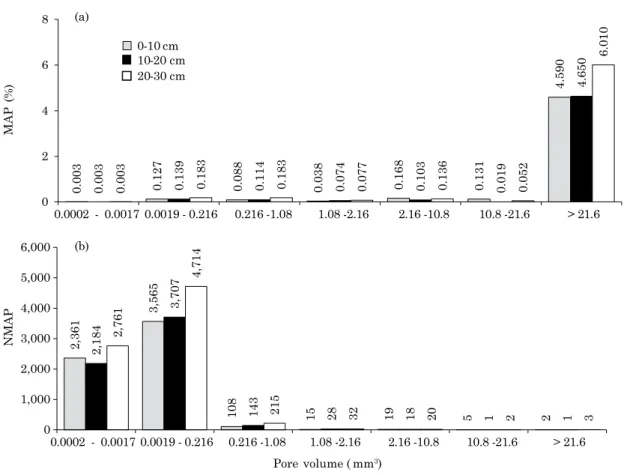
The analysis of results obtained revealed that macroporosity (MAP) was 5.14 % in the 0-10 cm, 5.10 % in the 10-20 cm, and 6.64 % in the 20-30 cm
100,000
air solid
80,000
60,000 40,000
20,000
0
?
32,000 32,500 33,000 33,500 34,000 34,500 35,000 figure 3. histogram representing the different
distribution of gray shades in the sample. the black arrows (main arrows) represent the gray values that certainly correspond to air and solid. each of the arrows (main and secondary) provides a maximum center value (mc) and variance (Var). the transition phase corresponds to the distribution of gray values in which there is doubt of what is solid and what is air within the sample.
figure 2. (a) flowchart of the image artifact extraction process. (b) image generated during the ring- shaped artifact extraction process. this is the correction factor that corresponds to the “noisy” part.
layers (Figure 6a). The number of macropores (NMAP) was 6,075 in the 0-10 cm, 6,082 in the 10-20 cm, and 7,747 in the 20-30 cm layers (Figure 6b). However, in this paper the image resolution evaluated refers
to pores with volume ≥ 216×103 μm3 (voxel size 60 × 60 × 60 μm). Therefore, the MAP analyzed here
is not similar to the values conventionally used to
separate micropores and macropores in soil physics
(equivalent pore diameter of around 50 μm - matric
potential of -6 kPa).
According to the work of Borkowski (2009), macroporosities obtained in the same area of study and management system were 9.71 % in the 0-10 cm, 8.81 % in the 10-20 cm, and 8.82 % in the 20-30 cm layers. The author used the matric potential of -6 kPa to separate micropores from macropores. However,
it is necessary to bear in mind the minimum size of pores (image resolution) that was analyzed by CT
in order to compare the results.
The low MAP value observed is due to the natural
rearrangement of the soil when it is not mobilized,
as in the case of the area under study (Stone and
Silveira, 2001). Non-mobilized soils are sometimes characterized by an increase in surface bulk density
and reduction in MAP, especially for soils of a clayey
texture (Raghavan et al., 1977; McVay et al., 2006;
Abu, 2013). It is always important to mention the dependence of MAP on soil texture and bulk density (Stolf et al., 2011).
Another explanation for low MAP values found among layers could be a possible effect of
agricultural traffic in the place randomly selected
for sampling. An analysis of soil macroporosity (matric potential of -6 kPa) variation for 150 soil samples collected at the same experimental area showed values with variation from 3.55 to 22.96 %
(CV = 34.2 %).
In that context, results revealed that the relative difference between the 0-10 cm and 20-30 cm layers was 29.2 % (Figure 6a). That means that there was MAP reduction in the surface layer when compared
figure 4. interface of the Image J program to
determine the threshold value to define the
limits of image pores. real image with contrast (right), pores represented by the color gray, aiming to evaluate the threshold value (left).
Oblate
a a
b
c c b
Equate
Triaxial Prolate
Figure 5. classification of pores based on shape
parameters. the terms a, b, and c represent the axes that intercept pores. adapted from bullock et al. (1985).
table 1. classification of pores regarding shape and conditions used to define parameters according
to the axes that intercept pores
shape(1) parameter
Oblate (OB) intermediate /major ≥ 2/3;
minor /intermediate < 2/3
Equant (EQ) intermediate /major ≥ 2/3;
minor /intermediate ≥ 2/3
Triaxial (TR) intermediate /major < 2/3;
minor /intermediate < 2/3
Prolate (PR) intermediate /major < 2/3;
minor /intermediate ≥ 2/3
Unclassified (UN)
-(1) According to Bullock et al. (1985).
table 2. classification of pores regarding size interval
size of pore size range of pore
voxel mm3
1-8 0.0002-0.0017
9-1,000 0.0019-0.216 1,001-5,000 0.216-1.08 5,001-10,000 1.08-2.16 10,001-50,000 2.16-10.8 50,001-100,000 10.8-21.6
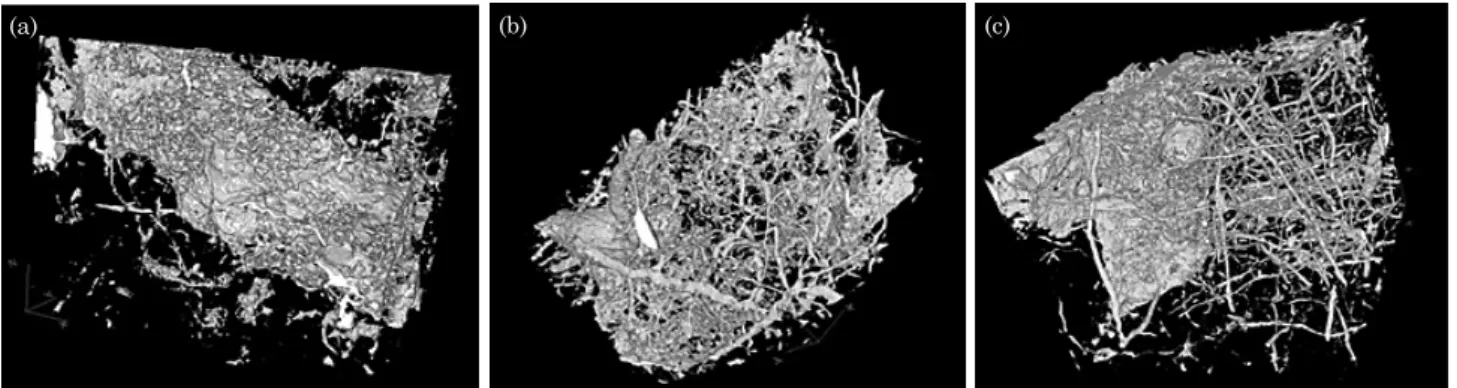
to the 20-30 cm layer (Figures 7a and 7c), indicating a slight degree of compaction, which can be seen in
figure 7a.
Although the contribution to MAP from pores
with intervals from 0.0002-0.0017 mm3 is lower in
all layers (Figure 6a), NMAP in this size interval is
the second highest when compared to the remaining intervals (Figure 6b). This indicates that macropores with larger volumes are present in smaller number in all layers, which implicates a structure which is
favorable to solute infiltration and air movement
through pores (Lal and Shukla, 2004).
However, it could be observed that higher MAP
alteration in the layers was due to pores with size interval >21.6 mm3 (Figure 6a). The same behavior
was observed in relation to the NMAP among layers (Figure 6b). On the other hand, MAP composed by
pores with size intervals from 0.0002-0.0017 mm3
was the same among layers.
Pores >21.6 mm3 are generally formed by
the presence of worms and termites and by root development within the soil. Soil surface layers usually contain biopores and root residues mainly in conservation tillage systems (Hillel, 1998; Lal and Shukla, 2004). And, if present, these big pores
are filled with solutes in the saturation, completely
dominating solute transportation (Dirksen, 1991). Thus, these biopores were observed in all layers, but in a greater number in the 20-30 cm layer (Figures 6b and 7c).
Recently, two studies were carried out at the same experimental area as this study and the authors observed changes in the air permeability and in the soil structural quality between soil layers (0-10 and 10-20 cm) (Giarola et al., 2010; Rodrigues et al., 2011). Rodrigues et al. (2011)
characterized differences in soil air permeability, air-filled porosity, and indices of pore continuity;
and they showed the existence of differences in the continuity of pores between layers, which are related to differences in the micropore and macropore volumes. Using the visual soil structure analysis, Giarola et al. (2010) demonstrated differences in the quality of the porous media, which is important for facilitating selection of mechanical or biological practices to improve the physical quality of the soil.
Figure 8 shows that the unclassified pore (UN) type with size interval >21.6 mm3 led to the highest
MAP values in the three layers.
The objective of the algorithm used to classify the pores is to count the voxels in the measurement of three axes (major, intermediary, and minor
(a)
(b)
0.003 0.127 0.088 0.03
8
0.16
8
0.13
1
4.590
0.003 0.139 0.114 0.074 0.103 0.019
4.650
0.003 0.18
3
0.18
3
0.077 0.136 0.052
6.010
0 2 4 6 8
0.0002 - 0.0017 0.0019 - 0.216 0.216 -1.08 1.08 -2.16 2.16 -10.8 10.8 -21.6 > 21.6
MA
P(
%)
2,361
3,56
5
10
8
15 19 5 2
2,18
4
3,70
7
14
3
28 18 1 1
2,76
1
4,714
21
5
32 20 2 3
0 1,000 2,000 3,000 4,000 5,000 6,000
0.0002 - 0.0017 0.0019 - 0.216 0.216 -1.08 1.08 -2.16 2.16 -10.8 10.8 -21.6 > 21.6
NMAP
Pore volume ( mm3) 0-10 cm
10-20 cm 20-30 cm
figure 7. microtomographic images of the soil macropore system (White): (a) 0-10 cm layer, (b) 10-20 cm
layer, and (c) 20-30 cm layer. the image resolution obtained was 60 μm. (b)
(a) (c)
0.00
3
0 0 0 0 0.010 0.02
4
0.012 0.042 0.04
1
0.00
2
0.004 0.004 0.019 0.058 0.00
2
0.00
5
0 0.012 0.019 0 0 0 0.048 0.120 0 0 0.035 0.023 0.073 0 0 0 0
4.590
0 2 4 6 8
EQ PR OB TR UN EQ PR OB TR UN EQ PR OB TR UN EQ PR OB TR UN EQ PR OB TR UN EQ PR OB TR UN EQ PR OB TR UN 0.0002 - 0.0017 0.0019 - 0.216 0.216 -1.08 1.08 -2.16 2.16 -10.8 10.8 -21.6 > 21.6
0-10 cm
10-20 cm
20-30 cm
0.00
3
0 0 0 0 0.007 0.032 0.01 0.04
4
0.04
6
0.00
5
0.00
8
0.00
5
0.026 0.06
9
0 0 0 0.02
2
0.05
2
0 0 0 0.013 0.09
1
0 0 0 0 0.01
9
0 0 0 0
4.650
0 2 4 6 8
EQ PR OB TR UN EQ PR OB TR UN EQ PR OB TR UN EQ PR OB TR UN EQ PR OB TR UN EQ PR OB TR UN EQ PR OB TR UN
0.0002 - 0.0017 0.0019 - 0.216 0.216 -1.08 1.08 -2.16 2.16 -10.8 10.8 -21.6 > 21.6
Macroporosity (%)
0.003 0 0 0 0 0.01 0.04
4
0.012 0.05
3
0.06
4
0.003 0.011 0.009 0.04
8
0.112 0 0.00
4
0.00
4
0.015 0.05
4
0 0 0 0.00
4
0.132 0 0 0 0 0.052 0 0 0 0
6.010
0 2 4 6 8
EQ PR OB TR UN EQ PR OB TR UN EQ PR OB TR UN EQ PR OB TR UN EQ PR OB TR UN EQ PR OB TR UN EQ PR OB TR UN
0.0002 - 0.0017 0.0019 - 0.216 0.216 -1.08 1.08 -2.16 2.16 -10.8 10.8 -21.6 > 21.6
Pore volume (mm3) /Shape
0-10 cm 10-20 cm 20-30 cm
(b)
(c) (a)
axes) that intercept the pores. For UN pores, the algorithm cannot count one of the axes due to pore arrangement. Therefore, lacking the measurement of a single axis within a pore, it is
automatically classified as a UN type. Thus, the
larger the pore, the more complex its shape is. In a 2D perspective, one can infer that these UN type pores are equivalent to the complex and/or irregular pores (Bouma et al., 1977; Cooper and
Vidal-Torrado, 2005).
In contrast, the contribution to MAP of UN pores
among the size intervals from 0.0002 to 21.6 mm3
was 0.3 % (0-10 and 10-20 cm layers) and 0.4 % (20-30 cm layer); whereas the MAP of EQ type pores was around 0.015 % for the three depths under analysis (Figures 8a, 8b, and 8c).
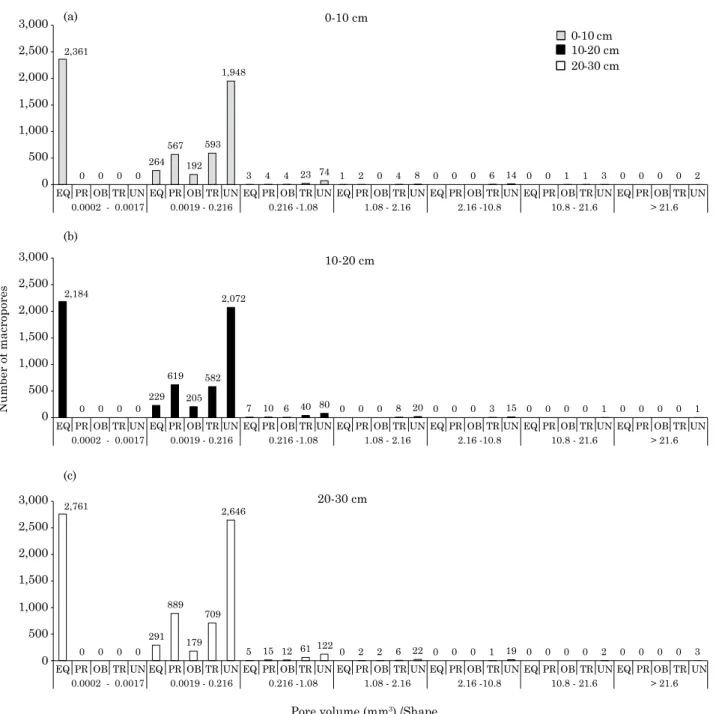
The NMAP of the UN type was 2,049 (0-10 cm), 2,189 (10-20 cm) and 2,814 (20-30 cm); while the NMAP of the EQ type was 2,629 (0-10 cm); 2,420 (10-20 cm) and 3,057 (20-30 cm), and the remaining classes (PR, OB, and TR) presented
values mainly in the size class from 0.0019 to
1.08 mm3 in relation to the MAP and NMAP
(Figures 9a, 9b, and 9c).
figure 9. Number of macropores for each kind of pore regarding size interval: (a) 0-10 cm layer, (b) 10-20 cm layer, and (c) 20-30 cm layer.
(b)
(c) (a)
2,361
0 0 0 0 264
567
192 593
1,948
3 4 4 23 74 1 2 0 4 8 0 0 0 6 14 0 0 1 1 3 0 0 0 0 2 0
500 1,000 1,500 2,000 2,500 3,000
EQ PR OB TR UN EQ PR OB TR UN EQ PR OB TR UN EQ PR OB TR UN EQ PR OB TR UN EQ PR OB TR UN EQ PR OB TR UN 0.0002 - 0.0017 0.0019 - 0.216 0.216 -1.08 1.08 - 2.16 2.16 -10.8 10.8 - 21.6 > 21.6
2,184
0 0 0 0
229 619
205 582
2,072
7 10 6 40 80 0 0 0 8 20 0 0 0 3 15 0 0 0 0 1 0 0 0 0 1
0 500 1,000 1,500 2,000 2,500 3,000
EQ PR OB TR UN EQ PR OB TR UN EQ PR OB TR UN EQ PR OB TR UN EQ PR OB TR UN EQ PR OB TR UN EQ PR OB TR UN
0.0002 - 0.0017 0.0019 - 0.216 0.216 -1.08 1.08 - 2.16 2.16 -10.8 10.8 - 21.6 > 21.6
Number of macropores
2,761
0 0 0 0
291 889
179 709
2,646
5 15 12 61 122 0 2 2 6 22 0 0 0 1 19 0 0 0 0 2 0 0 0 0 3
0 500 1,000 1,500 2,000 2,500 3,000
EQ PR OB TR UN EQ PR OB TR UN EQ PR OB TR UN EQ PR OB TR UN EQ PR OB TR UN EQ PR OB TR UN EQ PR OB TR UN
0.0002 - 0.0017 0.0019 - 0.216 0.216 -1.08 1.08 - 2.16 2.16 -10.8 10.8 - 21.6 > 21.6
Pore volume (mm3) /Shape 20-30 cm
10-20 cm 0-10 cm
In a 2D perspective, according to Souza et al.
(2006), round pores (EQ) mean low connectivity, while complex type pores (UN) indicate higher connectivity of the pore system. In this context, in a 3D perspective, it can be inferred that the soil samples under analysis exhibit a high connectivity pore system, as the major MAP was in the last layer, indicating that in deeper layers the pore system tends to be more connected (Figures 7a, 7b, and 7c). Some authors have observed a reduction in the continuity of macropores in soils under no-tillage in the 0-20 cm layer and an increase below this depth (Schjonning and Rasmussen, 2000).
Regarding the remaining classes, it was seen
that for some size intervals, they do not exist in
all layers, both in relation to MAP (Figures 8a, 8b, and 8c) and in relation to NMAP (Figures 9a, 9b, and 9c).
cONclUSIONS
The use of the X-ray microtomographic technique allowed a fast and detailed analysis of the soil macropore system. It was possible to evaluate the total number and shape of the soil macropores in 3D in a non-destructive way.
The soil investigated was characterized as having
between layer macroporosity of 5.14 % (0-10 cm), 5.10 % (10-20 cm), and 6.64 % (20-30 cm).
These results revealed that the 0 to 20 cm
depth shows the same effect for non-mobilized
soil structures. The highest macroporosity value is related to the unclassified pore class, which could be an indication of great connectivity among pores.
acKNoWledgmeNts
Many thanks are owed to the Brazilian Federal
Funding Agencies: CNPq (Grant No. 304310/2011-5) and
CNEN/CAPES for financial support and scholarships.
refereNces
Abu ST. Evaluating long-term impact of land use on selected soil physical quality indicators. Soil Res. 2013;51:471-6.
Al-Raoush R, Alshibli KA. Distribution of local void ratio in porous media systems from 3D X-ray microtomography images. Physica A. 2006;361:441-56.
Allaire-Leung SE, Gupta SC, Moncrief JF. Water and solute movement in soil as influenced by macropore characteristics 1.
Macropore continuity. J Contam Hydrol. 2000;41:283-301.
Borges JAR, Pires LF, Pereira AB. Computed tomography to estimate the representative elementary area for soil porosity
measurements. Sci World J. doi:10.1100/2012/526380
Borkowski AK. Análise de curvas de retenção e de distribuição de
poros de um latossolo vermelho distrófico submetido aos sistemas
de plantio convencional e direto [dissertação]. Ponta Grossa: Universidade Estadual de Ponta Grossa; 2009.
Bouma J, Jongerius A, Boersma O, Jager A, Schoonderbeek D. The Function of different types of macropores during saturated
flow through four swelling soil horizons. Soil Sci Soc Am J.
1977;41:945-50.
Bullock P, Fedoroff N, Jongerius A, Stoops G, Tursina T, Babel
U. Handbook for soil thin section description. Albrington: Waine
Research Publications; 1985.
Buzug TM. Computed tomography: From photon statistics to
modern cone-beam CT. New York: Springer; 2008.
Cooper M, Vidal-Torrado P. Caracterização morfológica,
micromorfológica e físico-hídrica de solos com horizonte B nítico.
R Bras Ci Solo. 2005;29:581-95.
Crestana S, Cruvinel PE, Vaz CMP, Cesareo R, Mascarenhas S, Reichardt K. Calibração e uso de um tomógrafo computadorizado
em ciência do solo. R Bras Ci Solo. 1992;16:161-7.
Dirksen C. Unsaturated hydraulic conductivity. In: Smith KA, Mullins CE, editors. Soil analysis: Physical methods. New York: Marcel Dekker; 1991. p.209-69.
Elliot TR, Heck RJ. A comparison of 2D vs. 3D thresholding of X-ray CT imagery. Can J Soil Sci. 2007a;87:405-12.
Elliot TR, Heck RJ. A comparison of optical and X-ray CT technique for void analysis in soil thin section. Geoderma. 2007b;141:60-70.
Ge Healthcare. GEHC MicroView: User guide. 2006.
van Geet M, Lagrou D, Swennen R. Porosity measurements of sedimentary rocks by means of microfocus X-ray computed tomography. In: Mees F, Swennen G, Geet U, van Jacobs P, editors. Applications of X-Ray computed tomography in the geosciences. London: Geological Society; 2003. p.51-61.
Giarola NFB, Silva AP, Tormena CA, Ball B, Rosa JA. Visual soil
structure quality assessment on Oxisols under no-tillage system. Sci Agric. 2010;67:479-82.
Hillel D. Environmental soil physics: Fundamentals, applications, and environmental considerations. London: Academic Press; 1998. Jongerius D, Schoonderbeek A, Jager A. The application of the Quantimet 720 in soil micromorphometry. Microscope. 1972;20:243-54.
Lal R, Shukla MK. Principles of soil physics. New York: Chemical Rubber Company Press; 2004.
Luo L, Lin H, Li S. Quantification of 3-D soil macropore networks
in different soil types and land uses using computed tomography. J. Hydrol. 2010;393:53-64.
Marshall TJ, Holmes JW, Rose CW. Soil physics. Cambridge:
Cambridge University Press; 1999.
McVay KA, Budde JA, Fabrizzi K, Mikha MM, Rice CW, Schlegel AJ, Peterson DE, Sweeney DW, Thompson C. Management effects
Moreira AC, Appoloni CR, Mantovani IF, Fernandes JS, Marques LC, Nagata R, Fernandes CP. Effects of manual threshold setting on image
analysis results of a sandstone sample structural characterization by
X-ray microtomography. Appl Radiat Isot. 2012;70:937-41.
Oh WOW, Lindquist B. Image thresholding by indicator kriging.
IEEE Trans Pattern Anal Machem Intell. 1999;21:590-602. OriginLab Corporation. OriginPro: User guide. 2006.
Papadopoulos A, Bird NRA, Whitmore AP, Mooney SJ.
Investigating the effects of organic and conventional management on soil aggregate stability using X-ray computed tomography. Eur J Soil Sci. 2009;60:360-8.
Petrovic AM, Siebert JE, Rieke PE. Soil bulk density analysis in three dimensions by computed tomographic scanning. Soil Sci Soc Am J. 1982;46:445-50.
Pires LF, Arthur RCJ, Brasil RPC, Correchel V, Bacchi OOS,
Reichardt K. The use of gamma ray computed tomography to
investigate soil compaction due to core sampling devices. Braz J
Phys. 2004;34:728-31.
Pires LF, Bacchi OOS, Reichardt K, Timm LC. Application of gamma-ray computed tomography to the analysis of soil structure before density evaluations. Appl Radiat Isot. 2005;63:505-11. Rab MA, Haling RE, Aarons SR, Hannah M, Young IM, Gibson D. Evaluation of X-ray computed tomography for quantifying macroporosity of loamy pasture soils. Geoderma. 2014;213:460-70.
Raghavan GSV, Mckyes E, Beaulieu B. Prediction of clay soil
compaction. J Terram. 1977;14:31-38. Rasband W. ImageJ: User guide. 2007.
Rasiah V, Aylmore LAG. Computed tomography data on soil
structural and hydraulic parameters assessed for spatial continuity by semivariance geostatistics. Aust J Soil Res. 1998;36:485-93.
Rodrigues S, Silva AP, Giarola NFB, Rosa JA. Permeabilidade
ao ar em Latossolo Vermelho sob diferentes sistemas de manejo.
R Bras Ci Solo. 2011;35:105-14.
Schjonning P, Rasmussen KJ. Soil strength and soil pore characteristics for direct drilled and ploughed soils. Soil Till Res. 2000;57:69-82.
Souza ZM, Marques Júnior J, Cooper M, Pereira GT.
Micromorfologia do solo e sua relação com atributos físicos e hídricos. Pesq Agropec Bras. 2006;41:487-92.
Stolf R, Thurler AM, Bacchi OOS, Reichardt K. Method to estimate soil macroporosity and microporosity based on sand content and bulk density. R Bras Ci Solo. 2011;35:447-59. Stone LF, Silveira PM. Efeitos do sistema de preparo e da rotação de culturas na porosidade e densidade do solo. R Bras Ci Solo. 2001;25:395-401.
Taina IA, Heck RJ, Elliot TR. Application of X-ray computed tomography to soil science: A literature review. Can J Soil Sci. 2008;88:1-20.
Taina IA, Heck RJ, Elliot TR, Scaiff N. Micromorphological and X-ray µCT study of Orthic Humic Gleysols under different management conditions. Geoderma. 2010;158:110-9.
Tarquis AM, Heck RJ, Andina D, Alvarez A, Antón JM. Pore
network complexity and thresholding of 3D soil images. Ecol Complex. 2009;6:230-9.
Tarquis AM, Sanchez ME, Anton JM, Jimenez J, Saa-Requejo A, Andina D, Crawford JW. Variation in spectral and mass
dimension on three-dimensional soil image processing. Soil Sci. 2012;177:88-97.
Tippkötter R, Eickhorst T, Taubner H, Gredner B, Rademaker G. Detection of soil water in macropores of undisturbed soil using
microfocus X-ray tube computerized tomography (μCT). Soil Till