(Annals of the Brazilian Academy of Sciences) ISSN 0001-3765
www.scielo.br/aabc
Chemical zoning of muscovite megacrystal from the Brazilian Pegmatite Province
RÚBIA R. VIANA1, HANNA J. EVANGELISTA2 and WILLEM B. STERN3
1Coordenação do Programa de Pós-Graduação em Geociências, Departamento de Recursos Minerais, ICET
Universidade Federal de Mato Grosso, Av. Fernando Correa da Costa, s/n, Coxipó Campus Universitário, 78068-900 Cuiabá, MT, Brasil
2Departamento de Geologia, Universidade Federal de Ouro Preto, Morro do Cruzeiro
35400-000 Ouro Preto, Minas Gerais, Brasil
3Mineralogisch-Petrographisches Institut, University of Basel, Basel, Switzerland
Manuscript received on May 16, 2005; accepted for publication on August 23, 2006; presented byALCIDESN. SIAL
ABSTRACT
Macroscopically homogenous muscovite plate from the Cruzeiro pegmatite, located in the Eastern Pegmatite Province in Minas Gerais, may show complex distribution patterns of some trace elements. In geochronological and petrological studies, as for example in the distinction of magmatic and post-magmatic mica, the cause of zoning could be taken into consideration. The complex chemical zoning in the studied mica plate can be best explained by growth in an evolving magma followed by alteration due to percolation of hydrothermal fluids. Enrichment of Rb towards the border is interpreted as resulting from the chemical evolution of the residual magma during crystal growth. The depletion in (IVAl+VIAl) as well as the increase in (Fe+Mg) and Si along a fracture could be due to the hydrothermal celadonitic substitution of muscovite. This alteration also caused depletion in the contents of Rb, Ga, Y, Nb, Sn, and Zn and residual concentration of Ti. Elements such as Ga, Y, Nb, Sn, and Zn, rarely considered in the discussion of differentiation or alteration processes in micas, have been shown to be as significant as the alkali-elements.
Key words: muscovite, chemical zoning, hydrothermal alteration, Cruzeiro pegmatite.
INTRODUCTION
Two kinds of zoning were found in micas from peg-matites from the gem-producing Eastern Brazilian Peg-matite Province (EBPP): discontinuous zoning, due to the overgrowth of muscovite on biotite as described by Viana et al. (2003), and chemical zoning of crystals of a single type of mica, investigated in the present paper.
The Cruzeiro pegmatite is located in Governador Valadares region, Minas Gerais State, Brazil (Fig. 1). This pegmatite is composed of three subvertical dikes reaching a thickness of 50 meters. The pegmatite is hosted by quartzite of the Serra da Safira Sequence (Federico et al. 1998). It shows well defined internal
Correspondence to: Profa. Dra. Rúbia Ribeiro Viana E-mail: [email protected]
zonation, being composed of quartz, feldspar, muscovite, gem-tourmaline and less commonly beryl (aquamarine variety), garnet, niobotantalate, spodumene, and rarely amblygonite (Bilal et al. 2000, Cassedane et al. 1980).
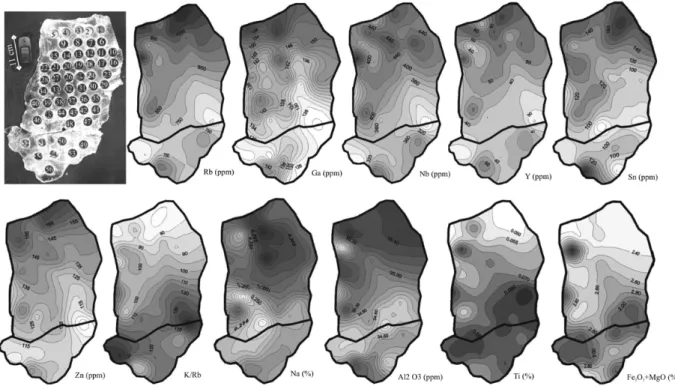
Muscovite of variable size is common in all peg-matites from the EBPP, mostly as pseudo-hexagonal or fishtail shaped books. The larger crystals are found in the intermediate zone of Cruzeiro Pegmatite, in some cases exceeding 30 cm. A large muscovite plate from this zone was submitted to detailed chemical analysis in order to examine it compositional zoning and to understand the growth patterns of giant crystals. A thin fracture line crosscutting the plate from one border to the other was the only heterogeneity observed.
degree of accuracy than by conventional electron micro-probe analysis.
GEOLOGICAL SETTING
A large quantity and variety of gemstones, particularly aquamarine and tourmaline, is produced in the Eastern Brazilian Pegmatite Province (EBPP), which comprises an area about 800 km long and 150 km wide. The peg-matites are spread over eastern Minas Gerais, western Espírito Santo and southern Bahia States (Fig. 1). The EBPP is characterized by a particular geotectonic set-ting in a Neoproterozoic-Cambrian orogenic belt gen-erated during the Brasiliano–Pan-African cycle, which consisted of a set of orogenies that lasted from about 850 to 550 Ma (e.g., Oliveira et al. 1997, Pinto and Pedrosa-Soares 2001). The majority of the pegmatites of the EBPP are related to granite intrusions into the Brasi-liano mobile belts generated during the consolidation of the Gondwana supercontinent. Biotite and its mus-covite overgrowth from the Ipê pegmatite, located near Governador Valadares (Fig. 1), have been dated by the K/Ar method enabling to establish a crystallization age of 575 Ma as well as a cooling rate of 3.3◦
C for the pegmatite (Viana et al. 2003).
SAMPLING AND EXPERIMENTAL METHODS
An 80×40 cm mica plate from the intermediate zone of the Cruzeiro pegmatite was selected for analysis. Mica discs were cut out on 56 points of the muscovite plate. An even, clean crystal surface of 30 mm diame-ter was analyzed in the Geochemical Laboratory Insti-tute of Mineralogy and Petrography of Basel University (Switzerland) by means of X-ray Fluorescence Analy-sis – XFA, (SRS-3400 spectrometer of Siemens-Bruker-AXS, Germany, Specplus software) without further pre-paration using the analytical routine discussed by Stern (2001). No grinding process took place, and hence no contamination (W, Co) induced by sample dressing. No elements were lost in this way due to volatilization (F, Cl) as is the case with certain conventional prepara-tion techniques such as vitrificaprepara-tion (glass beads). The specimen thickness was measured by means of a micro-meter and used for thickness correction, essential when high-energy spectral lines are used for analysis.
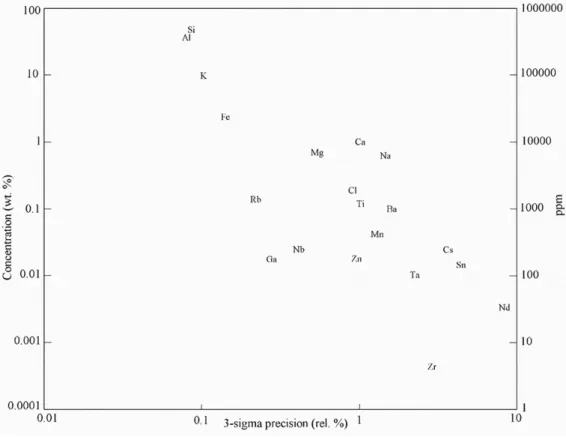
ing concentrations (Fig. 2), elements which are present mostly well above the detection limit were preferably selected for analysis in this study.
The results of the chemical analyses reported in Table I show that the main composition changes little, that is, the chemical variation of the major elements is within the analytical frame of detection. However, some trace elements vary with a factor 2 to 3, which reflects indeed the changing environment during crystal growth.
PETROLOGICAL CONSIDERATIONS TO ELEMENT DISTRIBUTION PATTERNS
The locations of the analyzed points and the distribution maps of the compositional contour lines for selected el-ements are presented in Figure 3. The distribution maps show very similar patterns, although the trends might be the opposite, as for example for Ti and Ga (Fig. 3). The similar distribution of the contour lines is an indica-tion that the chemical zoning is due to the operaindica-tion of some kind of geological process, i.e., it is not the result of imprecise analytical data that would certainly result in chaotic distribution patterns.
In order to evaluate the element distribution maps within the muscovite plate, the following geological pro-cesses are potential causes for the chemical variation in pegmatite minerals:
1 – The chemical evolution of residual magma during the crystallization of the pegmatite magma is re-sponsible for an increase of Rb and other alkali-elements and a decrease of the K/Rb-ratio during fractionation (e.g. Morteani et al. 1995). Conse-quently, there is an enrichment of Rb and depletion of K/Rb-ratio from center to border of pegmatite minerals such as mica during growth. In melts re-maining during fractionated crystallization there is an increase in Rb and decrease in Sr and Ba (Neiva et al. 1987).
2 – Zoning due to hydrothermal alteration and / or growth. In this case it is supposed that the pro-duce enrichment in the celadonitic component that leads to increase Si and (Fe + Mg) and diminish (IVAl +VIAl) when compared to magmatic
Fig. 1 – Simplified geological map of the Araçuaí and Governador Valadares regions with location of the Cruzeiro pegmatite. Outline of the Eastern Brazilian Pegmatite Province (EBPP) is also shown (modified after Oliveira et al. 1997 and Pedrosa-Soares and Wiedemann-Leonardos 2000).
Fig. 3 – Sketch of studied muscovite plate with location of the analyzed points and distribution maps of the compositional contour lines for selected elements.
TABLE I
Chemical analyzed of large muscovite from Cruzeiro Pegmatite (oxides in % Wt and ions in ppm).
1 2 3 4 5 6 7 8 9 10 11 12 13 14
SiO2 45.85 45.81 45.87 46.00 45.85 45.85 45.87 45.84 45.89 45.80 46.01 45.97 45.98 46.04
Al2O3 35.36 35.37 35.42 35.49 35.45 35.28 35.39 35.39 35.37 35.38 35.67 35.37 35.32 35.31
Fe2O3 2.12 2.08 2.06 2.04 2.00 2.05 2.15 2.03 2.01 2.03 1.98 1.98 2.00 2.02
MnO 0.05 0.05 0.04 0.04 0.04 0.04 0.05 0.04 0.04 0.05 0.04 0.04 0.04 0.03 MgO 0.30 0.28 0.29 0.30 0.33 0.32 0.29 0.35 0.38 0.27 0.31 0.39 0.41 0.44 CaO 0.01 0.00 0.00 0.00 0.00 0.04 0.00 0.00 0.00 0.00 0.00 0.00 0.00 0.00 Na2O 0.81 0.75 0.79 0.76 0.74 0.81 0.85 0.82 0.80 0.74 0.66 0.81 0.80 0.80
K2O 10.45 10.48 10.52 10.46 10.48 10.39 10.25 10.49 10.44 10.45 10.17 10.44 10.45 10.45
TiO2 0.12 0.11 0.11 0.11 0.14 0.16 0.11 0.13 0.13 0.11 0.12 0.13 0.14 0.14
P2O5 0.01 0.02 0.01 0.01 0.01 0.02 0.02 0.01 0.01 0.01 0.02 0.01 0.01 0.01
Sum 95.08 94.95 95.11 95.21 95.04 94.96 94.98 95.10 95.07 94.84 94.98 95.14 95.15 95.24
H2O* 4.5 4.5 4.5 4.5 4.5 4.5 4.5 4.5 4.5 4.5 4.5 4.5 4.5 4.5
F 0 4400 0 0 2800 3000 2800 0 2400 4000 3100 0 0 0
Cl 900 200 1600 600 500 0 0 1100 0 200 100 900 400 500
Ba 920 0 0 0 182 1182 545 607 263 1232 524 449 612 0
Cs 17 19 7 12 13 19 118 35 16 18 16 13 10 19
Nb 413 497 442 431 423 363 449 413 506 429 502 494 492 412
Rb 1098 1186 1094 1010 966 918 1161 933 1033 1120 1051 997 988 885
Sn 149 149 192 151 181 154 132 173 141 157 157 127 149 124
Zn 186 173 162 151 143 155 170 150 141 165 153 142 143 139
Ga 159 159 150 151 150 157 164 150 151 163 154 150 145 137
Pb 38 41 72 34 30 0 0 42 40 25 0 33 35 67
Sb 0 0 0 0 0 0 0 0 0 0 0 0 0 0
Sr 0 0 0 0 0 0 0 0 0 0 0 0 0 0
Y 56 73 57 56 48 38 67 42 62 64 68 58 62 47
K/Rb 79 73 80 86 90 94 73 93 84 77 80 87 88 98
Hydrothermal muscovite is also supposed to be po-orer in Nb and Ta (Neiva 1987).
3 – Coalescence of growing crystals by synneusis (Roy-croft 1991), which should generate independent zoning in each of the attached crystals surrounded by late stage zones joining the various parts (Shelley 1993). Corrosion followed by later growth of nor-mal euhedral faces is also possible (Roycroft 1989, 1991).
RESULTS AND DISCUSSION
The following discussion about the chemical variation within the studied mica plate takes into account the above mentioned possible causes of zoning in pegmatite min-erals.
Analyzing the selected bivariant diagrams (Fig. 4) it is possible to observe that there are a clear negative cor-relation between Ti, Mg and Fe and positive corcor-relation between Nb, Rb, Sn, Zn, Ga, Y and Mn, both versus the
Al content. In Figure 4, is also shown a positive correla-tion of Ti content in funccorrela-tion of the Mg content. On the other hand, the Fe content versus both Mg and Si present two different trends, negative for lower and positive for higher Mg and Si contents. This tendency can be related to presence of Fe2+and Fe3+in the samples. No
corre-lation was observed with K content, meaning that K/Rb ratio is controlled only by Rb.
Distribution patterns of indicator elements such as Rb and K/Rb in the studied megacrystal is unrelated to crystal center-border geometry (Fig. 3). Rb shows a gradual increase towards the upper border and a left to right-oriented low crosscutting the lower half of the crystal, which is more or less coincident with the frac-ture line. Elements showing similar trends to Rb are Ga, Y, Nb, Sn, Zn, Na, and (IVAl+VIAl). K/Rb ratio, on
15 16 17 18 19 20 21 22 23 24 25 26 27 28 SiO2 46.00 46.79 45.99 46.13 46.06 46.12 46.02 46.08 45.90 46.06 46.10 46.08 46.17 46.13
Al2O3 35.24 34.69 33.89 35.17 34.97 35.09 35.07 35.04 35.43 35.24 35.09 34.85 34.89 34.79
Fe2O3 2.02 2.04 2.65 2.03 2.17 2.06 2.04 2.03 2.02 2.01 2.04 2.19 2.11 2.15
MnO 0.03 0.04 0.04 0.04 0.04 0.03 0.03 0.03 0.04 0.03 0.03 0.03 0.03 0.03 MgO 0.45 0.28 0.93 0.44 0.52 0.50 0.52 0.54 0.36 0.46 0.53 0.60 0.60 0.65 CaO 0.00 0.00 0.00 0.00 0.00 0.00 0.00 0.00 0.00 0.00 0.00 0.00 0.00 0.00 Na2O 0.79 0.74 0.71 0.75 0.85 0.79 0.78 0.70 0.77 0.74 0.78 0.78 0.76 0.76
K2O 10.44 10.28 10.38 10.48 10.31 10.51 10.45 10.52 10.47 10.45 10.50 10.44 10.47 10.44
TiO2 0.14 0.10 0.19 0.15 0.16 0.15 0.15 0.15 0.12 0.14 0.15 0.16 0.17 0.20
P2O5 0.01 0.02 0.01 0.01 0.01 0.01 0.01 0.01 0.01 0.01 0.01 0.02 0.01 0.01
Sum 95.12 94.98 94.79 95.19 95.08 95.27 95.07 95.10 95.12 95.14 95.23 95.16 95.21 95.17
H2O* 4.5 4.5 4.5 4.5 4.5 4.5 4.5 4.5 4.5 4.5 4.5 4.5 4.5 4.5
F 0 3800 6700 0 2600 0 0 2600 0 2300 0 0 0 0
Cl 500 200 1200 300 200 300 1400 300 1000 100 600 600 700 0
Ba 1060 254 289 732 201 0 929 0 116 0 0 490 350 1217
Cs 11 15 14 15 9 8 12 12 23 10 13 29 14 13
Nb 445 392 357 382 454 398 398 397 573 371 436 409 342 340
Rb 912 1016 809 853 941 864 843 828 1151 817 883 846 743 736
Sn 127 162 105 127 114 122 92 89 154 149 116 92 105 92
Zn 140 162 168 149 152 145 129 136 151 142 138 125 121 118
Ga 138 152 149 141 156 135 136 146 150 135 141 145 127 137
Pb 0 55 50 47 39 29 0 49 69 91 46 47 29 0
Sb 0 0 0 0 0 0 166 186 0 0 0 215 0 214
Sr 0 0 0 0 0 0 0 0 0 0 0 0 0 0
Y 53 52 30 41 55 45 43 47 69 39 55 49 35 36
K/Rb 95 84 106 102 91 101 103 105 76 106 99 102 117 118
Figure 3, have erratic distribution patterns, while Ta and Sr, which are elements considered of petrological impor-tance, present contents lower than the limit of detection.
Considering the mentioned variation patterns, growth during evolution of residual magma could not be the only cause of zoning, because chemical variation of diagnostic elements such as Rb, which should grad-ually increase from center to border, shows distribution patterns unrelated to crystal geometric contour. How-ever, the much higher Rb-contents found along the up-per border (Fig. 3) suggest that the influence of growth during magmatic differentiation cannot be excluded.
Coalescence of several crystals by synneusis is im-probable because the various areas corresponding to the old crystals that should present similar concentric dis-tribution patterns cannot be recognized. The observed lower contents in Rb, Ga, Y, Nb, Ta, Sn, Zn, Na, and (IVAl+VIAl) as well as the higher values of K/Rb, Ti, Si,
and (Fe+Mg) along a more or less E-W oriented stripe
in the southern half of the plate seem to be related to the fracture line (see Fig. 3).
The impoverishment in (IVAl +VIAl) and the
in-crease in (Fe+Mg) and Si near to the fracture region could be due to the celadonitic substitution of muscovite as dis-cussed by Demster (1992) and Gomes and Neiva (2000):
K Al2Si3Al O10
O H 2+F e
3++Si4+ (muscovi t e)
=
K F e3+
Mg,F e2+
Si4O10
O H 2+3Al
3+ (celadoni t e)
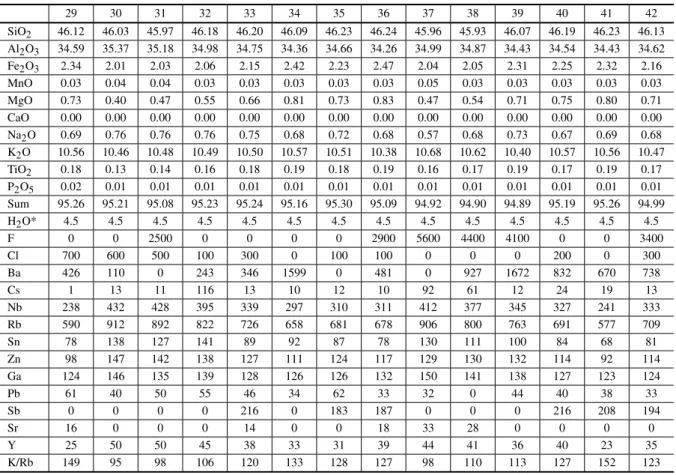
TABLE I (continuation)
29 30 31 32 33 34 35 36 37 38 39 40 41 42
SiO2 46.12 46.03 45.97 46.18 46.20 46.09 46.23 46.24 45.96 45.93 46.07 46.19 46.23 46.13
Al2O3 34.59 35.37 35.18 34.98 34.75 34.36 34.66 34.26 34.99 34.87 34.43 34.54 34.43 34.62
Fe2O3 2.34 2.01 2.03 2.06 2.15 2.42 2.23 2.47 2.04 2.05 2.31 2.25 2.32 2.16
MnO 0.03 0.04 0.04 0.03 0.03 0.03 0.03 0.03 0.05 0.03 0.03 0.03 0.03 0.03 MgO 0.73 0.40 0.47 0.55 0.66 0.81 0.73 0.83 0.47 0.54 0.71 0.75 0.80 0.71 CaO 0.00 0.00 0.00 0.00 0.00 0.00 0.00 0.00 0.00 0.00 0.00 0.00 0.00 0.00 Na2O 0.69 0.76 0.76 0.76 0.75 0.68 0.72 0.68 0.57 0.68 0.73 0.67 0.69 0.68
K2O 10.56 10.46 10.48 10.49 10.50 10.57 10.51 10.38 10.68 10.62 10.40 10.57 10.56 10.47
TiO2 0.18 0.13 0.14 0.16 0.18 0.19 0.18 0.19 0.16 0.17 0.19 0.17 0.19 0.17
P2O5 0.02 0.01 0.01 0.01 0.01 0.01 0.01 0.01 0.01 0.01 0.01 0.01 0.01 0.01
Sum 95.26 95.21 95.08 95.23 95.24 95.16 95.30 95.09 94.92 94.90 94.89 95.19 95.26 94.99
H2O* 4.5 4.5 4.5 4.5 4.5 4.5 4.5 4.5 4.5 4.5 4.5 4.5 4.5 4.5
F 0 0 2500 0 0 0 0 2900 5600 4400 4100 0 0 3400
Cl 700 600 500 100 300 0 100 100 0 0 0 200 0 300
Ba 426 110 0 243 346 1599 0 481 0 927 1672 832 670 738
Cs 1 13 11 116 13 10 12 10 92 61 12 24 19 13
Nb 238 432 428 395 339 297 310 311 412 377 345 327 241 333
Rb 590 912 892 822 726 658 681 678 906 800 763 691 577 709
Sn 78 138 127 141 89 92 87 78 130 111 100 84 68 81
Zn 98 147 142 138 127 111 124 117 129 130 132 114 92 114
Ga 124 146 135 139 128 126 126 132 150 141 138 127 123 124
Pb 61 40 50 55 46 34 62 33 32 0 44 40 38 33
Sb 0 0 0 0 216 0 183 187 0 0 0 216 208 194
Sr 16 0 0 0 14 0 0 18 33 28 0 0 0 0
Y 25 50 50 45 38 33 31 39 44 41 36 40 23 35
K/Rb 149 95 98 106 120 133 128 127 98 110 113 127 152 123
Ti-contents, on the other hand, may have been increased due to (i) residual concentration because of the immobile character of Ti or (ii) reaction/alteration of other phases, e.g. rutile needles included in muscovite.
The similarity of the trends of Ga, Y, Nb, Sn, and Zn to the trend of Rb, which is considered as being an important petrological indicator, demonstrates that in case of the studied mica these elements show the same geochemical behavior as Rb. Therefore elements such as Ga, that shows significant variation, can also be valu-able indicators for discrimination of different mica gen-erations in rocks.
ACKNOWLEDGMENTS
This work was partially supported by Coordenação de Aperfeiçoamento de Pessoal de Nível Superior (CAPES), Conselho Nacional de Desenvolvimento Científico e Tecnológico (CNPq) and Fundação de Am-paro a Pesquisas do Estado de Minas Gerais (FAPEMIG)
(Brazil) and by the Intra-muros funding by Geochemi-cal Laboratories/Basel University.
RESUMO
Um grande cristal de muscovita, macroscopicamente
homogê-neo, procedente do Pegmatito Cruzeiro, localizado na
Provín-cia Pegmatítica Oriental, em Minas Gerais, exibe padrão de
distribuição complexa para alguns elementos traços. Em es-tudos geocronológicos e petrológicos, como, por exemplo, na
separação entre micas magmáticas e pós-magmáticas, a causa
de zoneamento deve ser levada em consideração. O complexo
zoneamento químico no cristal de mica estudado é melhor
ex-plicado pelo crescimento em um magma evoluído, seguido pela
alteração, proveniente da percolação de fluidos hidrotermais. O enriquecimento de Rb nas bordas é interpretado como resultado
da evolução química do magma residual durante o crescimento
do cristal. A diminuição em (IVAl+VIAl), bem como o au-mento de (Fe+Mg) e Si ao longo da fratura é explicado pela
altera-43 44 45 46 47 48 49 50 51 52 53 54 55 56 SiO2 45.92 46.20 46.01 46.16 46.20 46.26 46.14 46.20 46.10 46.13 46.27 45.96 46.03 46.19
Al2O3 35.36 34.69 34.84 34.19 34.84 34.43 34.83 34.41 34.96 34.32 34.43 35.27 35.14 34.89
Fe2O3 2.01 2.07 2.04 2.43 2.12 2.39 2.00 2.38 2.09 2.43 2.30 1.98 2.00 2.10
MnO 0.04 0.03 0.04 0.03 0.03 0.03 0.03 0.03 0.03 0.03 0.03 0.04 0.04 0.03 MgO 0.37 0.65 0.53 0.81 0.60 0.77 0.57 0.75 0.57 0.73 0.79 0.43 0.47 0.61 CaO 0.00 0.00 0.00 0.00 0.00 0.00 0.00 0.00 0.00 0.00 0.00 0.00 0.00 0.00 Na2O 0.78 0.65 0.60 0.69 0.69 0.65 0.70 0.66 0.71 0.70 0.66 0.72 0.72 0.69
K2O 10.41 10.59 10.78 10.41 10.59 10.50 10.50 10.59 10.61 10.66 10.49 10.47 10.51 10.54
TiO2 0.12 0.16 0.16 0.19 0.16 0.18 0.17 0.18 0.16 0.18 0.18 0.15 0.15 0.16
P2O5 0.01 0.01 0.01 0.01 0.01 0.01 0.01 0.02 0.01 0.01 0.01 0.01 0.01 0.01
Sum 95.02 95.05 95.01 94.92 95.24 95.22 94.96 95.22 95.24 95.20 95.16 95.02 95.06 95.22
H2O* 4.5 4.5 4.5 4.5 4.5 4.5 4.5 4.5 4.5 4.5 4.5 4.5 4.5 4.5
F 3200 3600 4700 4800 0 0 4800 0 0 0 0 2900 2800 0
Cl 600 0 0 100 500 0 0 400 100 1300 0 0 0 700
Ba 0 350 0 634 0 531 535 378 585 0 1478 344 457 237
Cs 12 76 1 77 8 11 10 31 12 8 1 41 13 11
Nb 481 330 352 326 419 371 358 350 328 367 257 449 423 336
Rb 980 720 767 707 846 735 773 722 730 752 591 931 894 733
Sn 138 114 54 89 111 97 116 114 103 65 81 197 143 122
Zn 149 115 130 128 112 127 117 109 121 120 107 139 131 117
Ga 146 128 132 130 127 136 135 123 142 126 125 146 144 129
Pb 40 0 0 41 58 0 28 34 41 39 27 0 0 37
Sb 0 0 240 224 0 0 0 0 0 143 182 0 0 0
Sr 0 0 0 0 0 0 0 0 0 0 0 0 0 0
Y 59 34 38 34 51 37 42 42 34 42 27 54 50 36
K/Rb 88 122 117 122 104 119 113 122 121 118 147 93 98 119
* estimated value.
ção hidrotermal causou, também, a diminuição nos conteúdos
de Rb, Ga, Y, Nb, Sn e Zn ao longo desta fratura, além da
con-centração residual de Ti. Elementos tais como, Ga, Y, Nb, Sn, e Zn, pouco considerados em discussão de diferenciação ou
processos de alteração, mostraram significância tanto quanto
os elementos alcalinos.
Palavras-chave: muscovita, zoneamento químico, alteração
hidrotermal, pegmatito Cruzeiro.
REFERENCES
BILALE, CORREIA-NEVESJM, FUZIKAWAK, HORNAH, MARCIANOVRPRO, FERNANDES MLS, MOUTTE J, MELLO FM ANDNASRAOUI M. 2000. Pegmatites in southeastern Brazil. RBG 30: 234–237
CASSEDANE JP, CASSEDANEJO ANDSAUERDA. 1980. The Cruzeiro mine past and present. Mineral Rec 11: 363–370.
DEMSTERTJ. 1992. Zoning and recrystallization of pengitic micas: implications for metamorphic equilibration. Contr Min Petr 109: 526–537.
DEMSTERTJ, TANNER PWGAND AINSWORTH P. 1994. Chemical zoning of white micas. Am Mineral 79: 536– 544.
FEDERICO M, ANDREOZZI GB, LUCHESI S, GRAZIANI GANDCÉSAR-MENDES J. 1998. Compositional vari-ation of tourmaline in the granitic pegmatite dykes of the Cruzeiro mine, Minas Gerais, Brazil. Can Mineral 36: 415–431.
GOMESMEPANDNEIVAAMR. 2000. Chemical zoning of muscovite from the Ervedosa granite, northern Portugal. Mineral Mag 64: 347–358.
NEIVAAMR. 1987. Geochemistry of white micas from Por-tuguese tin and tungsten deposits. Chem Geol 63: 299– 317.
NEIVAAMR, NEIVAJMCANDPARRYSJ. 1987. Geochem-istry of the granitic rocks and their minerals from Serra da Estrela, Central Portugal. Geo Cosmo Acta 51: 439–454.
OLIVEIRAMJR, FÉBOLIWLANDPINTOCP. 1997. Geo-logia estrutural e tectônica. In: Projeto Leste. Província Pegmatítica Oriental. Programa de Levantamento Geo-lógico Básico do Brasil, CPRM. Belo Horizonte, MG, Brasil, p. 98–119.
PEDROSA- SOARES AC AND WIEDEMAN- LEONARDOS CM. 2000. Evolution of the Araçuaí Belt and its con-nection to the Ribeira Belt, Eastern Brazil. In: TEC -TONICEVOLUTION OFSOUTHAMERICA, 31st Interna-tional Geologic Congress, Rio de Janeiro, RJ, Brazil, p. 265–285.
PINTOCPANDPEDROSA-SOARESAC. 2001. Brazilian gem provinces. Aus Gem 21: 2–16.
ROYCROFT P. 1989. Zoned muscovite from the Leinster Granite, SE Ireland. Mineral Mag 53: 663–665.
ROYCROFTP. 1991. Magmatically zoned muscovite from the peraluminous two-mica granites of the Leinster batholith, southeast Ireland. Geology 19: 437–440.
SHELLEYD. 1993. Igneous and Metamorphic Rocks under the Microscope. Chapman & Hall, London, 445 p.
STERNWB. 2001. XRF-Analysis of Geological Standard Materials: Performance of “Standardless” Measuring Routines for Major and Minor Components. ICP Inf Newsl 27: 196–200.