Vibrational spectroscopy of the phosphate mineral lazulite –
(Mg, Fe)Al
2
(PO
4
)
2
(OH)
2
found in the Minas Gerais, Brazil
Ray L. Frost
a,⇑, Yunfei Xi
a, Martina Beganovic
b, Fernanda Maria Belotti
c, Ricardo Scholz
baSchool of Chemistry, Physics and Mechanical Engineering, Science and Engineering Faculty, Queensland University of Technology, GPO Box 2434, Brisbane, Queensland 4001, Australia bGeology Department, School of Mines, Federal University of Ouro Preto, Campus Morro do Cruzeiro, Ouro Preto, MG 35400-00, Brazil
cFederal University of Itajubá, Campus Itabira, Itabira, MG 35903-087, Brazil
h i g h l i g h t s
"In this work, we have studied the
structure of lazulite.
"Lazulite is pegmatite phosphate with
calculated formula
(Fe0.11)Al1.86(PO4)2.08(OH)2.04. "The structure of lazulite was
assessed using a combination of Raman and infrared spectroscopy.
g r a p h i c a l
a b s t r a c t
a r t i c l e
i n f o
Article history:
Received 20 September 2012
Received in revised form 6 November 2012 Accepted 23 January 2013
Available online 1 February 2013
Keywords:
Raman spectroscopy Lazulite
Infrared spectroscopy Phosphate
Pegmatite
a b s t r a c t
This research was done on lazulite samples from the Gentil mine, a lithium bearing pegmatite located in the municipality of Mendes Pimentel, Minas Gerais, Brazil. Chemical analysis was carried out by electron microprobe analysis and indicated a magnesium rich phase with partial substitution of iron. Traces of Ca and Mn, (which partially replaced Mg) were found. The calculated chemical formula of the studied sample is: (Mg0.88, Fe0.11)Al1.87(PO4)2.08(OH)2.02. The Raman spectrum of lazulite is dominated by an intense sharp
band at 1060 cm1assigned to PO stretching vibrations of of tetrahedral [PO4] clusters presents into the
HPO2
4 units. Two Raman bands at 1102 and 1137 cm1are attributed to both the HOP and PO
antisymmet-ric stretching vibrations. The two infrared bands at 997 and 1007 cm1are attributed to the
m1PO34
sym-metric stretching modes. The intense bands at 1035, 1054, 1081, 1118 and 1154 cm1are assigned to them 3
PO3
4 antisymmetric stretching modes from both the HOP and tetrahedral [PO4] clusters. A set of Raman
bands at 605, 613, 633 and 648 cm1are assigned to the
m4out of plane bending modes of the PO4, HPO4
and H2PO4units.Raman bands observed at 414, 425, 460, and 479 cm1are attributed to them2tetrahedral
PO4clusters, HPO4and H2PO4bending modes. The intense Raman band at 3402 and the infrared band at
3403 cm1are assigned to the stretching vibration of the OH units. A combination of Raman and infrared
spectroscopy enabled aspects of the molecular structure of the mineral lazulite to be understood. Ó2013 Elsevier B.V. All rights reserved.
Introduction
The minerals of lazulite group are basic hydro-phosphates and arsenates with the general chemical composition M2
1þM32þðXO4Þ2
ðOHÞ2, where M1can be occupied by Fe2+, Mg, Cu and Zn, and M2
can be occupied by Al and Fe3+. In the anionic group, X can be
occupied by P and As[1]. They crystallize in the monoclinic crystal system, space group P21/c, and unit cell parameters a= 7.1526 Å, b= 7.278 Å,c= 7.2334 Å,Z= 2 andb= 89.233°[2]. The name lazulite is used for a solid solution between the end-members lazulite – MgAl2
(PO4)2(OH)2and scorzalite – FeAl2(PO4)2(OH)2 [3]. The mineral is
1386-1425/$ - see front matterÓ2013 Elsevier B.V. All rights reserved.
http://dx.doi.org/10.1016/j.saa.2013.01.056
⇑ Corresponding author. Tel.: +61 7 3138 2407; fax: +61 7 3138 1804.
E-mail address:[email protected](R.L. Frost).
Contents lists available atSciVerse ScienceDirect
Spectrochimica Acta Part A: Molecular and
Biomolecular Spectroscopy
known since 18th century, and the name lazulite was first used by Klaproth[4]. The mineral is a bright blue color as shown in the Sup-plementary information as Fig. S1. The color of the mineral is related to the actual composition of the lazulite sample. Other phosphate members of lazulite group are Barbosalite Fe2þ
ðFe3þÞþ2ðPO4Þ2ðOHÞ2 [2]and Hentschelite – Cu2þðFe3þÞ
2þ ðPO4Þ2ðOHÞ2[5]. Wet chemical
analysis suggested for natural lazulite–scorzalite samples a com-plete solid-solution series between the end-members[3]. Contrast-ing results have exclusively been reported by Duggan et al.[6]who proposed a miscibility gap between 35 and 75 mol% scorzalite[7].
Cationic distribution in the lazulite type minerals according to the ideal formula M2þM3þ
2 ðPO4Þ2ðOHÞ2of lazulite group members
leads to the structure type that can be regarded as to be built up of infinite chains of face – sharing oxygen octahedra which are interconnected via PO4 tetrahedra and common hydroxyl ions. The symmetrically equivalent chains run into the [11 0] and [1 1 0] direction (space group P21/c). The cations occupy three
adjacent octahedra forming a trimer denoted as h-cluster [8,9]. Lazulite and scorzalite occur in many regions throughout the world. The main geological environments are related to metamor-phic rocks from green schist to amphibolite facies [10–16] and associated to granitic pegmatites[6,17–19]. The mineral is known from quite a wide variety of locations[6,16,17,19–24].
Nowadays Ca–Al and Mg–Al-phosphate minerals have gained recently growing interest in experimental mineralogy because of their stability properties and their potential as index minerals
[25]. In this investigation members of the lazulite–scorzalite so-lid-solution series are synthesized in compositional steps of 12.5 mol% atT= 485°C andP= 0.3 GPa under standard hydrother-mal conditions and controlled oxygen fugacities of the Ni/NiO-bufer[11]. However, in this work, samples of a lazulite mineral from the Minas Gerais, Brazil has been structurally characterized. Studies include chemistry via electron microprobe analysis in the wavelength dispersive X-ray spectroscopy (WDXS) elemental characterization and structural by means of infrared and Raman, spectroscopic characterization.
Geological setting, occurrence and samples description
The lazulite sample studied in this work was collected from the Gentil mine, a lithium bearing pegmatite located in the municipal-ity of Mendes Pimentel, Minas Gerais, Brazil. The pegmatite is lo-cated in the Conselheiro Pena pegmatite district, one of the subdivisions of the Eastern Brazilian Pegmatite province (EBP). The pegmatite district is inserted in the central domain of the Araçuaí mobile belt [26], formed during the Brasiliano orogeny (630–490 Ma) by accretion to the eastern margin of the São Fran-cisco craton. The Gentil pegmatite is mined out and in the past was mined for industrial feldspar and with minor importance of gemstones and samples for the collectors market. The pegmatite is heterogeneous with mineralogical and textural zoning well developed. It has asymmetric lens shape with the longer axis trending to NNE–SSW and body dips about 70°to SSE. The maxi-mum extension is of about 40 m and 12 m thickness. Detailed geology of the pegmatite was described by Chaves[13]. The pri-mary mineral association is represented by quartz, muscovite, microcline, beryl, schorl, almandine–spessartite, triplite and tri-phylite. The secondary association is mainly composed by albite, Ta and Nb oxides, siderite, elbaite, cassiterite, arsenopyrite, phar-macosiderite and a complex paragenesis of phosphates formed in the result of alteration of triphylite[13,18]. In addition to lazulite, others secondary phosphates, namely autunite, barbosalite, brazil-ianite, eosphorite, fluorapatite, frondelite, gormanite, heterosite, hureaulite, lithiophillite, matioliite, montebrasite, phosphosiderite, purpurite, roscherite group minerals, scorzalite, souzalite and
vivianite are common minerals in miarolitic cavities and in mas-sive blocks formed after the aggregates of primary triphylite up to 0.5 m length[13]. Lazulite nodules up to 3.0 cm long occur in miarolitic cavities, in association with muscovite, triphylite– lithiophilite, gormanite, brazilianite and albite.
Experimental
Samples and preparation
Deep blue and transparent fragments of lazulite were collected from the Gentil mine. The sample was incorporated in the collec-tion of the Geology Department of the Federal University of Ouro Preto, Minas Gerais, Brazil, with sample code SAA-081. The sample is from Gentil mine, a lithium bearing pegmatite with triphylite and spodumene. The mine is located in Mendes Pimentel, east of Minas Gerais. To remove contaminate phases, with the support of a Stereomicroscope Leica Model EZ4, lazulite fragments were handily selected from a sample in association with quartz and muscovite. Lazulite was phase analyzed by X-ray powder diffrac-tion and Scanning electron microscopy in the EDS mode (SEM/ EDS). An image of the lazulite sample used in this work is displayed in theSupplementary informationand is shown inFig. S1.
Electron micro probe analysis (EMP)
A quantitative chemical analysis was carried via EMP. Lazulite fragment selected for this study was analyzed with the perfor-mance of eight spots. The chemical analysis was carried out with a Jeol JXA8900R spectrometer from the Physics Department of the Federal University of Minas Gerais, Belo Horizonte. For each se-lected element was used the following standards: Fe–Magnetite, Mn–rodhonite, P and Ca–Ca2P2O7, Al–Al2O3 and Mg–MgO. The
epoxy embedded lazulite sample was polished in the sequence of 9
l
m, 6l
m and 1l
m diamond paste MetaDIÒII Diamond Paste–Buhler, using water as a lubricant, with a semi-automatic MiniMetÒ 1000 Grinder–Polisher–Buehler. Finally, the epoxy
embedded lazulite was coated with a thin layer of evaporated car-bon. The electron probe microanalysis in the WDS (wavelength dispersive spectrometer) mode was obtained at 15 kV accelerating voltage and beam current of 10 nA. Chemical formula was calcu-lated on the basis of ten oxygen atoms (O, OH).
Raman microprobe spectroscopy
Crystals of lazulite were placed on a polished metal surface on the stage of an Olympus BHSM microscope, which is equipped with 10, 20, and 50 objectives. The microscope is part of a
Reni-shaw 1000 Raman microscope system, which also includes a monochromator, a filter system and a CCD detector (1024 pixels). The Raman spectra were excited by a Spectra-Physics model 127 He–Ne laser producing highly polarised light at 633 nm and col-lected at a nominal resolution of 2 cm1 and a precision of
±1 cm1in the range between 200 and 4000 cm1. Repeated
acqui-sitions on the crystals using the highest magnification (50) were accumulated to improve the signal to noise ratio of the spectra. Ra-man Spectra were calibrated using the 520.5 cm1line of a silicon
wafer. The Raman spectrum of at least 10 crystals was collected to ensure the consistency of the spectra.
A Raman spectrum of lazulite is given in the RRUFF data base (http://rruff.info/Lazulite/R050110). The spectra are given in the
Supplementary information. This lazulite mineral sample origi-nated from Rapid Creek, Yukon Territory, Canada. The spectra are shown inFigs. S2–S4. The issue with the spectra as published in
the RRUFF data base is that the spectral range in the OH stretching region is not shown.
Infrared spectroscopy
Infrared spectra were obtained using a Nicolet Nexus 870 FTIR spectrometer with a smart endurance single bounce diamond ATR cell. Spectra over the 4000–525 cm1 range were obtained
by the co-addition of 128 scans with a resolution of 4 cm1and a
mirror velocity of 0.6329 cm/s. Spectra were co-added to improve the signal to noise ratio.
Spectral manipulation such as baseline correction/adjustment and smoothing were performed using the Spectracalc software package GRAMS (Galactic Industries Corporation, NH, USA). Band component analysis was undertaken using the Jandel ‘Peakfit’ soft-ware package that enabled the type of fitting function to be se-lected and allows specific parameters to be fixed or varied accordingly. Band fitting was done using a Lorentzian–Gaussian cross-product function with the minimum number of component bands used for the fitting process. The Gaussian–Lorentzian ratio was maintained at values greater than 0.7 and fitting was under-taken until reproducible results were obtained with squared corre-lations ofr2greater than 0.995.
Results and discussion
Chemical characterization
The quantitative chemical analysis of lazulite is presented in
Table 1. The composition was calculated as mean values in eight spots. The range of the chemical analysis is also presented, and shows no significant variance. H2O content was calculated by
stoi-chiometry considering Mg/(Mg + Fe) = 0.89. The chemical formula was calculated on the basis of 10 oxygen atoms (O, OH) in the structure. The chemical composition indicates a magnesium rich phase with partial substitution of magnesium. The results show traces of Ca and Mn, which partially replaces Mg in the tetrahedral site. The chemical formula of the studied sample can be expressed as: (Mg0.88, Fe0.11)Al1.87(PO4)2.08(OH)2.02.
Vibrational spectroscopy
In aqueous systems, the Raman spectra of phosphate oxyanions show a symmetric stretching mode (
m
1) at 938 cm1, anantisym-metric stretching mode (
m
3) at 1017 cm1, a symmetric bendingmode (
m
2) at 420 cm1and am
4bending mode at 567 cm1[27– 29]. Ross in Farmer (page 404) listed some well-known minerals containing phosphate which were either hydrated or hydroxylated or both[30]. The vibrational spectrum of the dihydrogen phos-phate anion has been reported in Farmer. The PO2 symmetricstretching mode occurs at 1072 cm1 and the POH symmetric
stretching mode at878 cm1. The POH antisymmetric stretching
mode was at 947 cm1and the P(OH)
2bending mode at 380 cm1.
The band at 1150 cm1 was assigned to the PO
2 antisymmetric
stretching mode. The position of these bands will shift according to the crystal structure of lazulite.
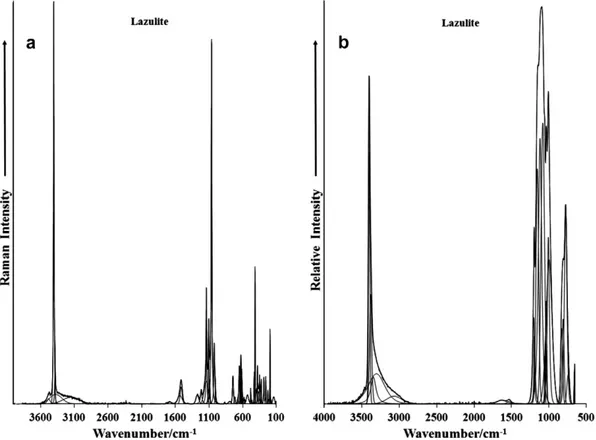
The Raman spectrum of lazulite in the 100–4000 cm1region
is displayed in Fig. 1a. This figure reports the position of the bands and their relative intensity. It is noted that there are re-gions in the spectrum where no intensity is observed. Therefore, the spectrum is subdivided into sections in subsequent figures so that more detailed assessment of the spectra can be made. In a similar way, the infrared spectrum of matioliite in the 500– 4000 cm1 region is reported in Fig. 1b. The spectrum is not
shown below 500 cm1. The reason is that we are using a
reflec-tance technique and the ATR cell absorbs all incident radiation below 500 cm1. In a similar fashion to the Raman spectrum,
the infrared spectrum is divided into sections depending upon the types of vibrations being observed. The Raman spectrum of matioliite in the 800–1400 cm1 region is reported in Fig. 2a.
The infrared spectrum of matioliite in the 500–1300 cm1region
is reported inFig. 2b.
The Raman spectrum is dominated by an intense sharp band at 1060 cm1. This band is assigned to PO stretching vibrations of
HPO2
4units. The Raman bands at 1019 cm1is attributed to the
PO3
4 stretching vibration. The two Raman bands at 1102 and
1137 cm1are attributed to both the HOP and PO antisymmetric
stretching vibrations. The Raman spectrum of lazulite from the RRUFF data base shown asFigs. S2–S4. A very intense band is ob-served at 1060 cm1in harmony with the results of this work. A
second intense band in the RRUFF spectrum is found at 1003 cm1 and is attributed to the PO3
4 symmetric stretching
vibration. The position of this band shows slight variance from the position of the band reported in this work. Other bands in the RRUFF spectrum are located at 1102, 1137, 1176 and 1219 cm1. The position and intensity of these bands are in good
agreement with the spectrum of this work.
Galy[31]first studied the polarized Raman spectra of the H2PO4
anion. Choi et al. reported the polarization spectra of NaH2PO4
crystals. Casciani and Condrate[32]published spectra on brushite and monetite together with synthetic anhydrous monocalcium phosphate (Ca(H2PO4)2), monocalcium dihydrogen phosphate
hy-drate (Ca(H2PO4)2H2O) and octacalcium phosphate (Ca8H2(PO4)
5H2O). These authors determined band assignments for
Ca(H2PO4) and reported bands at 1002 and 1011 cm1 as POH
and PO stretching vibrations, respectively. The two Raman bands at 1139 and 1165 cm1are attributed to both the HOP and PO
anti-symmetric stretching vibrations. Casciani and Condrate[32] tabu-lated Raman bands at 1132 and 1155 cm1 and assigned these
bands to P–O symmetric and the P–O antisymmetric stretching vibrations. Raman spectroscopy identifies the presence of phos-phate, hydrogen phosphate and dihydrogen phosphate units in the structure of lazulite.
The infrared spectrum of lazulite (Fig. 2b) shows a complex set of overlapping bands. The two infrared bands at 997 and
Table 1
Chemical composition of lazulite from Gentil pegmatite (mean of 10 electron microprobe analyses). H2O calculated by stoichiometry.
Constituent wt.% Range (wt.%) Number of atoms Probe standard/crystal
FeO 1.75 1.48–1.95 0.11 Magnetite/TAP
MgO 11.52 11.20–11.82 0.88 MgO/TAP
Al2O3 30.90 30.18–31.71 1.87 Al2O3/TAP
P2O5 48.30 48.06–48.51 2.08 Ca2P2O7/PETJ
MnO 0.01 0.00–0.05 0.00 Rodhonite/LIF
CaO 0.01 0.00–0.02 0.00 Ca2P2O7/PETJ
H2O 5.91 Calculated by stoichiometry 2.02
1007 cm1 are attributed to the
m
1 PO34 symmetric stretching
modes. The intense bands at 1035, 1054, 1081, 1118 and 1154 cm1are assigned to the
m
3 PO34 antisymmetric stretching
modes. The complex set of overlapping infrared bands are attrib-uted to infrared bands due to H2PO4, HPO24 and PO34 units. If
the protons of the hydroxyl units in lazulite are mobile as is likely, Fig. 1.(a) Raman spectrum of lazulite in the 100–4000 cm1spectral range, (b) infrared spectrum of lazulite in the 500–4000 cm1spectral range.
then the protons can be located with the phosphate units thus gen-erating dihydrogen and hydrogen phosphate units.
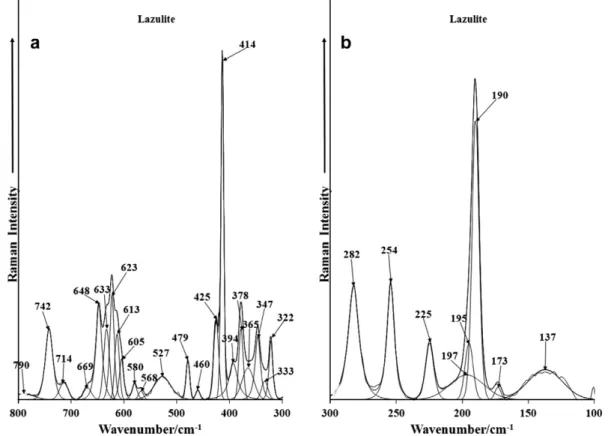
The Raman spectra of lazulite in the 300–800 cm1and in the
100–300 cm1 region are shown in Fig. 3a and b respectively.
The spectra show the complexity in harmony with the spectrum reported inFig. 2a and b. The Raman spectral region shown in
Fig. 3a represents the bending region of the phosphate units. A set of Raman bands at 605, 613, 633 and 648 cm1are assigned
to the
m
4 out of plane bending modes of the PO4, HPO4 andH2PO4units.The Raman spectrum of NaH2PO4shows Raman bands
at 526, 546 and 618 cm1(this work). The Raman spectrum of
laz-ulite from the RRUFF data base as shown inFig. S4. Raman bands are observed in the RRUFF spectrum at 613, 636 and 648 cm1.
The position of these bands is in excellent agreement with the data reported in this work. A very low intensity Raman band is observed at 865 cm1(Fig. 3a). The assignment of this band is open to
ques-tion but it is unlikely to be associated with the various phosphate units. One probable assignment is to the deformation modes of the hydroxyl units. The band is also observed in exactly this position in the RRUFF Raman spectrum.
The infrared spectrum (Fig. 2b) is in harmony with the Raman spectrum. Two infrared bands at 654 and 659 cm1are assigned
to this the
m
4out of plane bending modes of the PO4, HPO4units.In the infrared spectrum of dittmarite ((NH4)MgPO4H2O) bands
are observed at 635 and 656 cm1and are assigned to the PO3
4
m
4 bending mode. Raman bands are observed at 414, 425, 460and 479 cm1. These bands are attributed to the
m
2 PO4, HPO4
and H2PO4 bending modes. The Raman spectrum of NaH2PO4
shows Raman bands at 460 and 482 cm1which are also assigned
to this vibrational mode. The Raman spectrum of lazulite down-loaded from the RRUFF data base shows bands at 414, 428, 461 and 479 cm1. The position and intensity of these bands are in
har-mony with this work.
A set of Raman bands is observed at 322, 347, 365, 378, and 394 cm1. These bands are considered to be due to metal–oxygen
stretching vibrations. Strong Raman bands are observed in the far low wavenumber region at 190, 225, 254 and 282 cm1. These
bands are simply described as lattice vibrations. In the RRUFF spec-trum of lazulite, bands are observed at 191, 224, 254 and 283 cm1.
The position of these bands is in great agreement with this work. Some other bands of much lower intensity are observed in the RRUFF Raman spectrum which were not observed in this work.
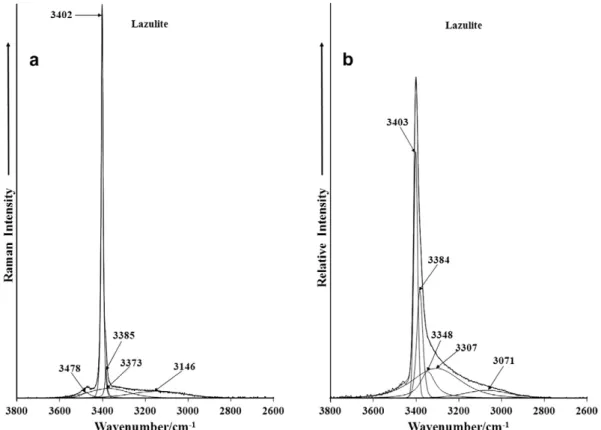
The Raman spectrum of lazulite and the infrared spectrum in the 2600–3800 cm1region are illustrated inFig. 4a and b. The
Ra-man spectrum is dominated by an intense sharp band at 3402 cm1, assigned to the stretching vibration of the OH units.
Other low intensity Raman bands are observed at 3385 and 3478 cm1. The equivalent infrared band is observed at
3403 cm1. The band is superimposed upon a spectral profile with
additional infrared bands at 3307, 3348 and 3384 cm1. These
bands may be attributed to water stretching vibrations. The Raman spectrum of lazulite in the 1400–1800 cm1and the infrared
spec-trum in the 1300–1800 cm1are reported inFig. 5a and b
respec-tively. These spectra are quite noisy; nevertheless a low intensity Raman band is found at 1684 cm1with two additional bands at
1509 and 1528 cm1. The first band is assigned to strongly bonded
water molecules. The latter two bands are thought to be overtone or combination bands. In the infrared spectrum, two bands are ob-served at 1530 and 1630 cm1.
Conclusions
The minerals of lazulite group are basic hydroxy-phosphates and arsenates with the general chemical composition M2þ
1 MÞ32þ
ðXO4Þ2ðOHÞ2, where M1can be occupied by Fe2+, Mg, Cu and Zn,
and M2can be occupied by Al and Fe3+. In the anionic group, X
can be occupied by P and As. The minerals crystallize in the monoclinic crystal system, space groupP21/c.In this work we have
studied a lazulite collected from the Gentil mine, a lithium bearing
pegmatite located in the municipality of Mendes Pimentel, Minas Gerais, Brazil. The pegmatite is located in the Conselheiro Pena pegmatite district, one of the subdivisions of the Eastern Brazilian Pegmatite province (EBP). Chemical analysis of the mineral was
undertaken using EDX techniques and the formula of the mineral was found to be (Mg0.88, Fe0.11)Al1.87(PO4)2.08(OH)2.02. Aspects of
the structure of lazulite using vibrational spectroscopy were as-sessed. Raman and infrared bands associated with dihydrogen Fig. 4.(a) Raman spectrum of lazulite in the 2600–3800 cm1spectral range, (b) infrared spectrum of lazulite in the 2600–3800 cm1spectral range.
phosphate, hydrogen phosphate and phosphate units were ob-served. It is apparent that all three anion types exist in the struc-ture of lazulite and these anionic types are enhanced by the basic nature of the mineral. The proton on the hydroxyl units is appar-ently very mobile and enables the formation of the monohydrogen and dihydrogen phosphate units. Only a single very intense band at around 3402 cm1in both the Raman and infrared spectra is
as-signed to the stretching of the OH units in the lazulite structure. Vibrational spectroscopy enabled an assessment of the molecular structure of lazulite to be made.
Acknowledgements
The financial and infra-structure support of the Discipline of Nanotechnology and Molecular Science, Science and Engineering Faculty of the Queensland University of Technology, is gratefully acknowledged. The Australian Research Council (ARC) is thanked for funding the instrumentation. R. Scholz thanks to FAPEMIG – Fundação de Amparo à Pesquisa do Estado de Minas Gerais (Grant No. CRA – APQ-03998-10). Martina Beganovic is grateful to CNPq for the master’s scholarship.
Appendix A. Supplementary material
Supplementary data associated with this article can be found, in the online version, athttp://dx.doi.org/10.1016/j.saa.2013.01.056.
References
[1] M.E. Back, J.A. Mandarino, Fleischer‘s glossary of mineral species, Mineral. Rec. (2008) 343.
[2] M.L. Lindberg, W.T. Pecora, Am. Mineral. 40 (1955) 952–966. [3] S.A. Abernathy, F.N. Blanchard, Am. Mineral. 67 (1982) 610–614.
[4] M.H. Klaproth, Beiträge zur chemischen Kenntniss der Mineralkörper, 1795. [5] N.H.W. Sieber, E. Tillmanns, O. Medenbach, Am. Mineral. 72 (1987) 404–408. [6] M.B. Duggan, M.T. Jones, D.N.G. Richards, J.L. Kamprad, Can. Mineral. 28 (1990)
125–131.
[7] P. Schmid-Beurmann, S. Knitter, L. Cemic, Mineral. Petrol. 70 (2000) 55–71. [8] P.B. Moore, Am. Mineral. 55 (1970) 135–169.
[9] R. Selke, P. Schmid-Beurmann, L. Cemic, Euro. J. Mineral. 15 (2003) 127–136. [10] G. Morteani, D. Ackermand, Mineral. Petrol. 80 (2004) 59–81.
[11] P. Schmid-Beurmann, S. Knitter, L. Cemic, Phys. Chem. Mineral. 26 (1999) 496– 505.
[12] G. Morteani, D. Ackermand, Neues Jahrb. Mineral. 182 (2006) 123–148. [13] M.L.S.C. Chaves, Aust. Gem. 21 (2003) 390–399.
[14] D. Ackermand, G. Morteani, T. Razakamanana, Proc. German-Malagasy Res. Cooperation in Life and Earth Sciences, 2006, pp. 5–18.
[15] I.A. Izbrodin, G.S. Ripp, N.S. Karmanov, Geol. Ore Dep. 51 (2009) 617–626. [16] P. Uher, T. Mikus, R. Milovsky, A. Biron, J. Spisiak, J. Lipka, J. Jahn, Lithos 112
(2009) 447–460.
[17] G.W. Robinson, J.v. Velthuizen, H.G. Ansell, B.D. Sturman, Mineral. Rec. 23 (1992) 1–47.
[18] D. Atencio, J.M.V. Coutinho, M.Y.P.J. Ellena, Am. Mineral. 91 (2006) 1932–1936. [19] H.G. Dill, F. Melcher, A. Gerdes, B. Weber, Can. Mineral. 46 (2008) 1131–1157. [20] S. Bajanik, Mineral. Slov. 11 (1979) 473–476.
[21] M.-Y. Chen, Xueyuan Xuebao (1979) 126–127.
[22] D.N. Litoshko, V.V. Bukanov, Zapiski Vses. Min. Obsh. 118 (1989) 35–41. [23] R. Simeone, Rivista Min. Ital. (1980) 52–56.
[24] Y. Yang, Y. Guo, J. Liu, Y. Zhang, Y. Li, N. Chou, C. Chen, Zhongguo Dizhi Kexueyuan Kuangchuang Dizhi Yanjiuso Sokan 15 (1985) 149–156. [25] L. Cemic, P. Schmid-Beurmann, Euro. J. Mineral. 7 (1995) 921–929. [26] F.F.M. Almeida, O. Craton do São Francisco, Revista Brasileira de Geociências
(in Portuguese) 7 (1977) 349–364.
[27] R.L. Frost, W. Martens, P.A. Williams, J.T. Kloprogge, Mineral. Mag. 66 (2002) 1063–1073.
[28] R.L. Frost, W.N. Martens, T. Kloprogge, P.A. Williams, Neues Jahrb. Mineral. (2002) 481–496.
[29] R.L. Frost, P.A. Williams, W. Martens, J.T. Kloprogge, P. Leverett, J. Raman Spectrosc. 33 (2002) 260–263.
[30] V.C. Farmer, Mineralogical Society Monograph 4: The Infrared Spectra of Minerals, The Mineralogical Society, London, 1974.
[31] A. Galy, J. Phys. Rad. 12 (1951) 827.