SED
5, 315–363, 2013Dynamics of laterally variable subductions
B. Guillaume et al.
Title Page
Abstract Introduction
Conclusions References
Tables Figures
◭ ◮
◭ ◮
Back Close
Full Screen / Esc
Printer-friendly Version Interactive Discussion
Discussion
P
a
per
|
Dis
cussion
P
a
per
|
Discussion
P
a
per
|
Discussio
n
P
a
per
|
Solid Earth Discuss., 5, 315–363, 2013 www.solid-earth-discuss.net/5/315/2013/ doi:10.5194/sed-5-315-2013
© Author(s) 2013. CC Attribution 3.0 License.
Geoscientiic Geoscientiic
Geoscientiic Geoscientiic
Open Access
Solid Earth
Discussions
This discussion paper is/has been under review for the journal Solid Earth (SE). Please refer to the corresponding final paper in SE if available.
The dynamics of laterally variable
subductions: laboratory models
applied to the Hellenides
B. Guillaume1,2,3,4, L. Husson1,2,3, F. Funiciello4, and C. Faccenna4
1
G ´eosciences Rennes, Universit ´e de Rennes 1, Rennes, France
2
G ´eosciences Rennes, CNRS UMR 6118, Rennes, France
3
Laboratoire de Plan ´etologie et G ´eodynamique de Nantes, UMR-CNRS 6112, Universit ´e de Nantes, Nantes, France
4
Laboratory of Experimental Tectonics, Dip. di Scienze, Universit `a Roma Tre, Rome, Italy
Received: 14 March 2013 – Accepted: 21 March 2013 – Published: 9 April 2013
Correspondence to: B. Guillaume ([email protected])
SED
5, 315–363, 2013Dynamics of laterally variable subductions
B. Guillaume et al.
Title Page
Abstract Introduction
Conclusions References
Tables Figures
◭ ◮
◭ ◮
Back Close
Full Screen / Esc
Printer-friendly Version Interactive Discussion
Discussion
P
a
per
|
Dis
cussion
P
a
per
|
Discussion
P
a
per
|
Discussio
n
P
a
per
Abstract
We design three-dimensional dynamically self-consistent laboratory models of subduc-tion to analyze the relasubduc-tionships between overriding plate deformasubduc-tion and subducsubduc-tion dynamics in the upper mantle. We investigate the effects of the subduction of a litho-sphere of laterally variable buoyancy on the temporal evolution of trench kinematics
5
and shape, horizontal flow at the top of the asthenosphere, dynamic topography and deformation of the overriding plate. The interface between the two units, analogue to a trench-perpendicular tear fault between a negatively buoyant oceanic plate and pos-itively buoyant continental one, is either fully-coupled or shear-stress free. Differential rates of trench retreat, in excess of 6 cm yr−1 between the two units, trigger a more
10
vigorous mantle flow above the oceanic slab unit than above the continental slab unit. The resulting asymmetrical sublithospheric flow shears the overriding plate in front of the tear fault, and deformation gradually switches from extension to transtension through time. The consistency between our models results and geological observa-tions suggests that the Late Cenozoic deformation of the Aegean domain, including
15
the formation of the North Aegean Trough and Central Hellenic Shear zone, results from the spatial variations in the buoyancy of the subducting lithosphere. In particular, the lateral changes of the subduction regime caused by the Early Pliocene subduc-tion of the old oceanic Ionian plate redesigned mantle flow and excited an increasingly vigorous dextral shear underneath the overriding plate. The models suggest that it is
20
SED
5, 315–363, 2013Dynamics of laterally variable subductions
B. Guillaume et al.
Title Page
Abstract Introduction
Conclusions References
Tables Figures
◭ ◮
◭ ◮
Back Close
Full Screen / Esc
Printer-friendly Version Interactive Discussion
Discussion
P
a
per
|
Dis
cussion
P
a
per
|
Discussion
P
a
per
|
Discussio
n
P
a
per
|
1 Introduction
At convergent margins, the negative buoyancy of the subducting lithosphere plays a first-order role in driving subduction (Forsyth and Uyeda, 1975; Chapple and Tullis, 1977). Variations in slab buoyancy occur both in time and space, for example during the subduction of oceanic plateaux that tend to decrease the average density of the
5
subducting lithosphere (e.g. Cloos, 1993). Not surprisingly, analogue (Bellahsen et al., 2005; Martinod et al., 2005; Espurt et al., 2008), semi-analytical (Royden and Hus-son, 2009), and numerical (van Hunen et al., 2002; De Franco et al., 2008; Magni et al., 2012) models show that temporal variations of slab buoyancy exert a primary control on slab dip and migration of the subduction hinge relative to the upper plate.
10
The downdip descent of positively buoyant material into the subduction zone initiates a transient mode during which the slab steepens and the subduction rate decreases. Similarly, mantle flows at lower rates about the slab, and the magnitude of dynamic de-flections adjusts within the same characteristic time frame. Less clear is the role of the lateral variations in slab buoyancy on trench migration rates, arc curvature, mantle flow
15
circulation, overriding plate deformation and topography along the subduction zone. Yet, they are common features on Earth, where seamounts, aseismic ridges, continen-tal fragments, stretched continencontinen-tal margins often correspond to lateral variations in the buoyancy of slabs. Their descent into the mantle is expected to transiently affect slab geometry and mantle flow and subsequently, dynamic topography, upper plate strain
20
and trench deformation.
Clearcut examples of such settings are the subduction of continental units adjacent to oceanic plates. The Australian continent in the Banda trench subducts underneath the Banda Sea; it is dragged along with the Indian oceanic plate that subducts in its western counterpart Sunda trench (e.g. Carter et al., 1976; Hamilton, 1979; Bowin
25
SED
5, 315–363, 2013Dynamics of laterally variable subductions
B. Guillaume et al.
Title Page
Abstract Introduction
Conclusions References
Tables Figures
◭ ◮
◭ ◮
Back Close
Full Screen / Esc
Printer-friendly Version Interactive Discussion
Discussion
P
a
per
|
Dis
cussion
P
a
per
|
Discussion
P
a
per
|
Discussio
n
P
a
per
is diagnostic of a continental fragment, less dense than the underlying mantle. Their respective buoyancies are thus extremely contrasted, and the subduction zone reacts accordingly (Royden and Husson, 2009). The lateral continuity of the subducting litho-sphere is not entirely resolved, and may vary from one subduction zone to another: tear faults may occasionally adjust the geometry of the slab to the differential motion
5
between the low and high buoyancy units (e.g. Govers and Wortel, 2005; Rosenbaum et al., 2008; Guillaume et al., 2010). Alternatively, the slab may not be disrupted by tear faults and instead distort, at least during the earlier stages, in order to accommodate the lateral variations in subducting rates.
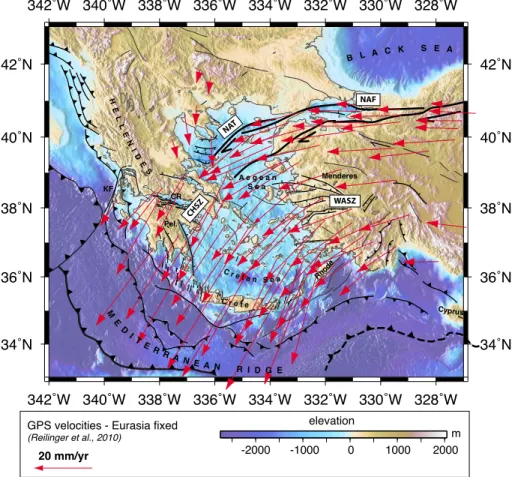
Similar setting prevails across the Adriatic Sea from the Apennines, along the
Hel-10
lenides (Fig. 1). South of the Kefalonia Fault, the oceanic Ionian plate subducts, whereas to the north, the continental, more positively buoyant unit enters the subduc-tion zone. In spite of a long lasting interest (see Jolivet et al., 2013, for a review), the dynamics of the Hellenic subduction and Aegean domain bear persisting questions: what are the mechanisms that trigger the late (≤5 Ma, Armijo et al., 1999)
propaga-15
tion of the North Anatolian Fault into the Aegean domain? What are the causes of the rapidly changing structural pattern during Neogene, in the Aegean in general and in particular in the Peloponnese and Mainland Greece, around the Corinth rift (Papaniko-laou and Royden, 2007)? How do these events relate to the disruption of the Hellenic arc by the Kefalonia Fault?
20
We thus perform a set of dynamically self-consistent 3-D laboratory models to test the influence of the arrival at trench of a laterally heterogeneous lithosphere, positively buoyant on half the width of the subduction zone (referred to ascontinental lithosphere
in the following) and negatively buoyant on the other half (oceanic lithosphere in the following), on the subduction dynamics. We further test the role of the shear stresses
25
SED
5, 315–363, 2013Dynamics of laterally variable subductions
B. Guillaume et al.
Title Page
Abstract Introduction
Conclusions References
Tables Figures
◭ ◮
◭ ◮
Back Close
Full Screen / Esc
Printer-friendly Version Interactive Discussion
Discussion
P
a
per
|
Dis
cussion
P
a
per
|
Discussion
P
a
per
|
Discussio
n
P
a
per
|
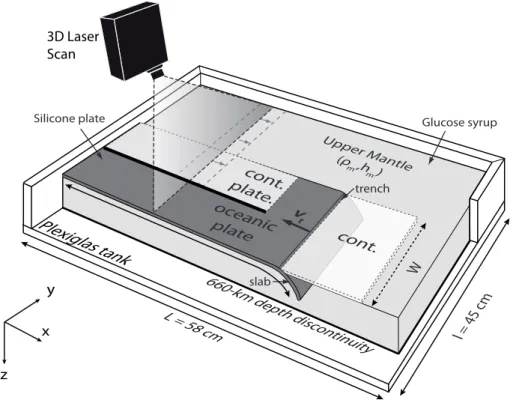
2 Models
Our simplified subduction system is designed to reproduce the force balance in natural subduction zones, which means that the slab drives the mantle flow and its motion is resisted by viscous dissipation in the mantle, in the slab and in the overriding plate. We performed a total of 11 models, following the experimental procedure proposed by
5
Funiciello et al. (2003) and Bellahsen et al. (2005) (Table 1). The set of models aims at exploring how the lateral variation in slab buoyancy affects the kinematics of the trench, mantle flow, dynamic topography and upper plate deformation. The modeled subducting lithosphere has been divided into a positively buoyant portion and a nega-tively buoyant portion (Fig. 2). Such approach has already been used to study how the
10
subduction of positively buoyant ridges and oceanic plateaux impact the subduction dynamics (Martinod et al., 2005; Espurt et al., 2008; Martinod et al., 2013). To com-pare the experimental results to the kinematics of the Hellenic subduction, we restrict the length of the subduction zone within the range 1200–2400 km and we fix the sub-ducting plate at its trailing edge, in analogy with the Hellenic subduction zone that is
15
embedded into the massive, slowly moving African plate.
2.1 Setup
We use silicone putty (Rhodrosil Gomme, PDMS+iron fillers) and glucose syrup to model the lithosphere and the upper mantle, respectively. Silicone putty is a viscoelastic material. However, it can be considered as a quasi-newtonian fluid since the elastic
20
component is negligible for the applied low experimental strain rates (Weijermars and Schmeling, 1986). Glucose syrup is a transparent newtonian low-viscosity fluid. These materials have been selected to achieve the standard scaling procedure for stresses scaled down for length, density and viscosity in a natural gravity field as described by Weijermars and Schmeling (1986) and Davy and Cobbold (1991).
25
SED
5, 315–363, 2013Dynamics of laterally variable subductions
B. Guillaume et al.
Title Page
Abstract Introduction
Conclusions References
Tables Figures
◭ ◮
◭ ◮
Back Close
Full Screen / Esc
Printer-friendly Version Interactive Discussion
Discussion
P
a
per
|
Dis
cussion
P
a
per
|
Discussion
P
a
per
|
Discussio
n
P
a
per
the individual layers and are considered to be averages of the actual values. Scaling for timetis given by
tnature=
(∆ρh)model.ηnature
(∆ρh)nature.ηmodel
×tmodel (1)
where ∆ρ is the density contrast between the subducting plate and upper mantle,
h is the slab thickness, and η the mantle viscosity. The density contrast ∆ρ
be-5
tween oceanic lithosphere and mantle ranges from 71 to 83 kg m−3 (corresponding to a 40 Myr-old oceanic lithosphere with a 80 % eclogitized crust; see Cloos, 1993) and that of the continental lithosphere between−35 and−43 kg m−3(corresponding to
a continental lithosphere with a crust thickness of ∼16 km) (Table 1). When present, the overriding lithosphere is positively buoyant with ∆ρ=−35 kg m−3. The viscosities
10
of the lithospheres and upper mantle are measured with a rheometer (Physica MCR 301, Anton Paar). At room temperature and for strain rates ranging between 10−4s−1 and 10−3s−1, the viscosity of the silicone putty used for the oceanic lithosphere is 3.2×10⁴Pa s and the viscosity of the continental lithosphere is either 2.9×10⁴Pa s for
model 1 or 6.8×10⁴Pa s for the other ones. Viscosity of the overriding lithosphere,
15
when present, is 2.9×10⁴Pa s and the viscosity of the mantle ranges between 30 and 40 Pa s. The obtained viscosity ratio between the slab and the upper mantle varies be-tween 7.75×10²and 25×102(Table 1), which is in the high range of proposed values (e.g. Billen et al., 2003; Faccenna et al., 2007; Funiciello et al., 2008; Wu et al., 2008; Loiselet et al., 2009, 2010). In the following, we directly express the quantities with their
20
corresponding scaled values for a better relevance to real Earth.
The mechanical behavior of the trench-perpendicular boundary between the oceanic and continental lithospheres exerts a primary control on the evolution of subduction. Because of the thin viscous sheet approximation adopted in our experiments, the de-formation is not localized enough to spontaneously form a vertical tear fault during the
25
SED
5, 315–363, 2013Dynamics of laterally variable subductions
B. Guillaume et al.
Title Page
Abstract Introduction
Conclusions References
Tables Figures
◭ ◮
◭ ◮
Back Close
Full Screen / Esc
Printer-friendly Version Interactive Discussion
Discussion
P
a
per
|
Dis
cussion
P
a
per
|
Discussion
P
a
per
|
Discussio
n
P
a
per
|
boundary between the two plates: (i) no lithospheric tear fault: we assume that diff er-ential buoyancy forces and rheological properties do not meet the conditions required to trigger the rupture of the lithosphere. The evolution of the oceanic and continental portions of the subducting lithosphere stay interdependent during the time of the ex-periment; (ii) preexisting tear fault: we assume that the rupture is instantaneous and
lo-5
calized at the transition between oceanic and continental lithospheres. In practice, this second case is obtained by forming a pre-existing structure precutting the subducting lithosphere at the transition between negatively- and positively-buoyant lithospheres and filling in the created gap with vaseline that prevents the two plates of silicone to stick together again during the experiment. Mechanically, it implies that shear stresses
10
(but not the normal stresses) are negligible between the two plates.
2.2 Experimental procedure
The silicone plates are initially floating above the glucose syrup and their trailing edges are attached to the box in order to preclude any trenchward motion of the subducting plate (fixed edgesubductionsensuKincaid and Olson, 1987), in which absolute motion
15
of the subducting lithosphere is null with respect to the lower mantle (Fig. 2). Assum-ing negligible horizontal strain of the subductAssum-ing lithosphere, the rate of trench motion equals the rate of subduction. Spontaneous sinking of the negatively buoyant oceanic lithosphere, that initially floats over the syrup, is avoided by surface tension exerted by the syrup onto the silicone plate. The experimental subduction is always initiated
20
by forcing the leading edge of the silicone plate into the glucose syrup to a depth of
∼2 cm (corresponding to about 120 km in nature). We ensure that the subduction is at steady state (see Funiciello et al., 2003) before the lateral transition between oceanic and continental lithospheres enters the trench. In order to meet this condition and only identify the effects of the lateral variations in slab buoyancy, the leading part of the
sub-25
SED
5, 315–363, 2013Dynamics of laterally variable subductions
B. Guillaume et al.
Title Page
Abstract Introduction
Conclusions References
Tables Figures
◭ ◮
◭ ◮
Back Close
Full Screen / Esc
Printer-friendly Version Interactive Discussion
Discussion
P
a
per
|
Dis
cussion
P
a
per
|
Discussion
P
a
per
|
Discussio
n
P
a
per
When present, the overriding plate is decoupled from the subducting plate by a thin layer of glucose syrup (see Heuret et al., 2007; Espurt et al., 2008; Guillaume et al., 2009), which reduces the shear stresses to negligible values (because stresses scale with viscosity) and prevents plates sticking to one another. It is somehow equivalent to introducing aweak zonein numerical models that is used to mimic the effect of a fault
5
subduction zone (e.g. Zhong and Gurnis, 1994; G ´erault et al., 2012).
The glucose syrup in some of the models is initially seeded with highly reflecting air micro-bubbles. These bubbles are used as passive tracers to map the upper mantle cir-culation pattern and to quantify the related velocity field using the image analysis tech-nique denoted as Particle Image Velocimetry using the MatPIV 1.6.1 toolbox (Sveen,
10
2004). Tracers only slightly influence the density and viscosity of the mantle fluid. For models 8–11, when steady state is reached, the surface is spray-painted (in order to overcome optical issues due to the translucency of the glucose syrup) and scanned with a 3-D scanner (EScan 3-D Imaging System), which acquires the topography with a maximum horizontal resolution of 0.13 mm (∼800 m in nature). The precision of
to-15
pographic data is 0.05 mm (300 m in nature).
3 Modeling results
Lateral variations of slab buoyancy are accounted for by locally changing the density contrast between the slab and surrounding mantle. At this transition, the two units are either decoupled from one another by a preexisting lithospheric tear fault or not.
20
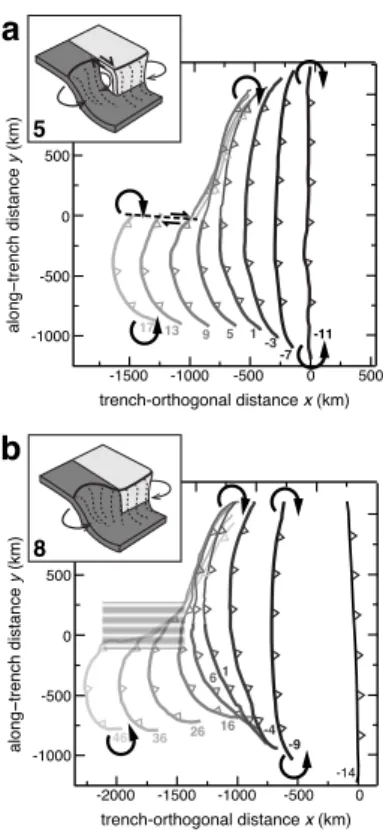
3.1 Trench kinematics
3.1.1 Large subduction zone with tear faulting (model 5)
The trench in model 5 is 2400 km large. W–E trench migration rate (vt) is computed for
90 s (∼1.2 Myr) time steps and 1 cm (60 km) steps along the trench (Fig. 3a, b). Trench
SED
5, 315–363, 2013Dynamics of laterally variable subductions
B. Guillaume et al.
Title Page
Abstract Introduction
Conclusions References
Tables Figures
◭ ◮
◭ ◮
Back Close
Full Screen / Esc
Printer-friendly Version Interactive Discussion
Discussion
P
a
per
|
Dis
cussion
P
a
per
|
Discussion
P
a
per
|
Discussio
n
P
a
per
|
i. For the first 6 Myr, the oceanic plate is sinking into the upper mantle, slab pull force progressively increases and trench retreat velocity reaches values as high as 6–8 cm yr−1(Fig. 3a, b).
ii. Once the slab reaches the bottom of the box, oceanward trench motion slows down and stabilizes at ∼4.5–5 cm yr−1. vt is slightly higher in the center of the
5
subduction zone with values of∼5–5.5 cm yr−1(Fig. 3a, b).
iii. The third stage starts with the onset of continental lithosphere subduction in the northern half of the subduction zone after 11 Myr and stops when the offset along the vertical tear fault in the center of the subduction zone develops after 20.5 Myr. In the northern part, the average negative slab buoyancy progressively
10
decreases, and the subduction and trench velocities drop. In the center of the northern unit (y=500 km), trench motion switches from retreat to – moderate – advance after a period of∼8 Myr (Fig. 3a, b) when∼125 km of continental litho-sphere has subducted. Closer to the lateral transition between continental and oceanic units (y =100 km), the decrease in trench migration rate is slower; for
15
the 9.5 Myr duration of this third stage trench velocity drops from 5 to 0.5 cm yr−1 (Fig. 3a, b). On the oceanic side (y =−100 km), the decrease ofvtis more limited,
with values just below 3 cm yr−1 after 20.5 Myr. Farther from the central disconti-nuity (y=−500 km), the arrival at trench to the north of the continental lithosphere does not decrease the trench retreat velocity, as observed elsewhere. Instead,vt 20
slightly increases from 5 to 6 cm yr−1 between 11 Myr and 20.5 Myr (Fig. 3a, b), meaning that the lateral influence of a decrease in slab buoyancy vanishes at remote locations (>500 km).
iv. After 20.5 Myr, the differential trench retrograde motion between the oceanic and continental units offsets the two plates along a vertical tear fault (Figs. 3a, b
25
and 4a). On its northern edge (y=100 km), vt keeps decreasing and eventually
SED
5, 315–363, 2013Dynamics of laterally variable subductions
B. Guillaume et al.
Title Page
Abstract Introduction
Conclusions References
Tables Figures
◭ ◮
◭ ◮
Back Close
Full Screen / Esc
Printer-friendly Version Interactive Discussion
Discussion
P
a
per
|
Dis
cussion
P
a
per
|
Discussion
P
a
per
|
Discussio
n
P
a
per
(Fig. 3a, b). Instead, on its southern edge (y=−100 km), vt instantaneously
in-creases from 3 to 6 cm yr−1. Farther from the tear fault, changes in trench kine-matics are less important. In the center of the southern unit (y=−500 km), vt
slightly increases to∼6.5 cm yr−1,∼30 % higher than trench retreat velocity dur-ing stage 2 when the width of the slab was about twice as large. Finally, the limited
5
decrease invtto the south of the tear fault after∼23–24 Myr are edge effects, as
the slab reaches the end wall of the tank.
The retrograde motion of slabs causes the development of toroidal cells at slab edges (Dvorkin, 1993; Funiciello et al., 2006; Piromallo et al., 2006). In the model, the per-sistent rollback of the oceanic lithosphere to the south excites such a mantle flow that
10
opposes the retrograde motion of the northern continental lithosphere, which explains the decreasingvt, and even slight advance, to the north.
3.1.2 Large subduction zone without tear faulting (model 8)
In this model, the subduction of positively buoyant lithosphere after 15 Myr also strongly modifies the trench kinematics (Fig. 3c, d). But unlike model 5, along-trench variations
15
of trench velocity are less pronounced. In details, 10 Myr after the entry of positively buoyant lithosphere, the difference of trench velocity between regions located 500 km north and south of the discontinuity is∼3 cm yr−1, half the value observed for model 5
(6 cm yr−1) (Fig. 3b, d). It also holds for regions closer to the discontinuity. The difference in trench velocity 15 Myr after the onset of continental subduction between regions
20
located 100 km away from the discontinuity is restricted to∼1 cm yr−1 for model 8 as
opposed to∼6 cm yr−1for model 5 (Fig. 3c, d). Because in the absence of a tear fault, shear stresses are high between the two plates, they remain coupled throughout and the kinematic evolution of the north and south trenches is never independent from one another. Thus the absence of slab segmentation at the junction between regions
25
SED
5, 315–363, 2013Dynamics of laterally variable subductions
B. Guillaume et al.
Title Page
Abstract Introduction
Conclusions References
Tables Figures
◭ ◮
◭ ◮
Back Close
Full Screen / Esc
Printer-friendly Version Interactive Discussion
Discussion
P
a
per
|
Dis
cussion
P
a
per
|
Discussion
P
a
per
|
Discussio
n
P
a
per
|
3.1.3 Narrow subduction zone with tear faulting (model 11)
The setups of models 11 and 5 are similar except for the width of the subduction zone, which is half as large in 11 (1200 km vs. 2400 km). It also follows a comparable 4 stage evolution (Fig. 3e, f). During stage 2, the trench migrates slightly faster than in model 5 (5.5–6 vs 5 cm yr−1), in agreement with previous models that show that narrower slabs
5
retreat faster (Guillaume et al., 2010). At the beginning of stage 3 after 18 Myr, trench retreat velocity decreases all along the subduction zone. In the center of the oceanic unit of the subducting lithosphere, where the migration rate slightly increases in model 5, model 11 instead shows a 50 % decrease ofvt.
There is also a delay in the time of tear faulting with respect to the large subduction
10
zone model. It occurs∼25 Myr after the positively buoyant unit reaches the trench in model 11 instead of 10 Myr in model 5. This can be explained by the lateral lower variability in trench migration rate that increases the delay necessary for the tear fault to open. In both cases however, the segmentation of the slab at depth occurs when the difference in amount of trench retreat between both sides of the discontinuity reaches
15
values of 200–250 km.
3.2 Trench shape and depth
Figure 4 shows the evolution of trench shape through time for the large subduction zone models with (5) or without (8) tearing. At first order, both models share a common ge-ometry that is controlled by the along-trench variability of trench motion. During stages
20
1 and 2, the trench retreats faster at the center of the subduction zone than along the edges, which promotes trench curvature. After the arrival of continental lithosphere to the north, the trench remains almost stationary in the northern part whereas in the southern part retrograde motion of the subducting plate continues. This subsequently causes the formation of a concave trench to the south and an almost-linear trench to
25
SED
5, 315–363, 2013Dynamics of laterally variable subductions
B. Guillaume et al.
Title Page
Abstract Introduction
Conclusions References
Tables Figures
◭ ◮
◭ ◮
Back Close
Full Screen / Esc
Printer-friendly Version Interactive Discussion
Discussion
P
a
per
|
Dis
cussion
P
a
per
|
Discussion
P
a
per
|
Discussio
n
P
a
per
7 Myr. Model 8 instead shows continuous transitions from fast trench retreat south of the discontinuity to a stationary – or slowly advancing – trench to the north∼16 Myr
af-ter continental subduction. The difference is here accommodated by slab deformation on a roughly 400 km wide band (Fig. 4b).
Trench depth is also sensitive to along-trench variations in slab buoyancy. We
5
scanned the surface elevation of the model (Fig. 5a) in order to compare the along-trench variations of minimum along-trench elevation with the corresponding along-trench migration rate for model 11 (Fig. 5b). Before the subduction of the buoyant lithosphere (16.5 Myr), both trench elevation and trench migration rate are uniform along the entire subduction zone with a∼10 km deep trench (below reference level, here the mean mantle surface
10
elevation far from the subduction zone) associated to a trench velocity of 6 cm yr−1. Instead, after 40 Myr, when up to 250 km of buoyant material has entered the trench, trench elevation varies laterally, with a maximum depth in front of the continental unit restricted to∼2 km. Figure 5c displays the relationship between trench velocity and
trench elevation for points sampled every 60 km along the trench at different times of
15
the same model. Faster trench migration rates match deeper trenches. In these mod-els, the trench depth results from the competition between the buoyancy stresses in the glucose syrup, that tend to restore uniformity, and the shear stresses exerted by the slab that impose the downward flow of the glucose syrup (see Husson et al., 2012). Response of trench topography to variations of trench kinematics is instantaneous and
20
for instance, faster trench retreat of the oceanic part of the subduction zone occurring after slab segmentation at 42 Myr results in a deepening of the trench, from 9 to 11 km at 40 Myr to 11 to 12 km at 46.5 Myr (Fig. 5c). Although the shear stresses between the slab and mantle linearly depend on trench velocity, the relationship shown on Fig. 5c breaks down for low trench retreat rates or advancing trenches because of the effect of
25
SED
5, 315–363, 2013Dynamics of laterally variable subductions
B. Guillaume et al.
Title Page
Abstract Introduction
Conclusions References
Tables Figures
◭ ◮
◭ ◮
Back Close
Full Screen / Esc
Printer-friendly Version Interactive Discussion
Discussion
P
a
per
|
Dis
cussion
P
a
per
|
Discussion
P
a
per
|
Discussio
n
P
a
per
|
3.3 Mantle flow
Horizontal velocities (vh) are computed at the surface of the glucose syrup and
sili-cone plate in the model 11 (that has no upper plate) using Particle Image Velocimetry (PIV) on top-view images with a pixel resolution of 0.25 mm and time intervals of 30 s. PIV relies on basic pattern matching, which reconstructs the Eulerian velocity field on
5
a regular grid (Adrian, 1991; Nogueira et al., 2001, among others). We use a multipass cross-correlation analysis with a 50 % overlap of the interrogation regions.
Figure 6 displays the horizontal velocity vectors and the magnitude of both W–E and N–S components of the horizontal velocity field 20 Myr, 25 Myr and 40 Myr af-ter subduction initiation for model 11. During the early stage of uniform subduction
10
(20 Myr), the retrograde motion of the subducting panel results in the formation of two toroidal cells centered on the slab edges (Fig. 6, see also Funiciello et al., 2006; Hus-son et al., 2012). The pattern of mantle circulation is almost symetrical with (i) fast westward particle motion in the center of the subduction zone with maximum velocities (vh(W–E)≈6 cm yr
−1
) (Fig. 6b), similar to the westward trench migration rate at the same
15
period, (ii) fast eastward flow (vh(W–E)>4 cm yr
−1
) at the edges of the subduction zones (Fig. 6b).
The early stage of the subduction of continental lithosphere (25 Myr) records vari-able trench migration rates along the trench (Fig. 3e, f). This directly affects horizontal velocities in the mantle with an asymetry in the westward particle motion between
re-20
gions in front of the oceanic unit (vh(W–E)>4 cm yr
−1
) and in front of the continental unit (vh(W–E)∼2 cm yr
−1
) (Fig. 6b). Even if the surface involved in mantle flow has not sig-nificantly decreased with respect to the previous stage, the average motion of particle has slowed down both in the W–E and N–S directions owing to the overall decrease in trench migration rates (Fig. 6b, c).
25
After 40 Myr of subduction, a switch in mantle flow direction occurs in front of the con-tinental unit, particles moving eastward at low velocities (vh(W–E)<0.5 cm yr
−1
SED
5, 315–363, 2013Dynamics of laterally variable subductions
B. Guillaume et al.
Title Page
Abstract Introduction
Conclusions References
Tables Figures
◭ ◮
◭ ◮
Back Close
Full Screen / Esc
Printer-friendly Version Interactive Discussion
Discussion
P
a
per
|
Dis
cussion
P
a
per
|
Discussion
P
a
per
|
Discussio
n
P
a
per
velocities at∼4 cm yr−1. In the mantle wedge just above the slab, mantle flow is mainly trench-perpendicular with fast motion for the oceanic unit whereas above the continen-tal unit, it is mainly trench-parallel with low magnitude.
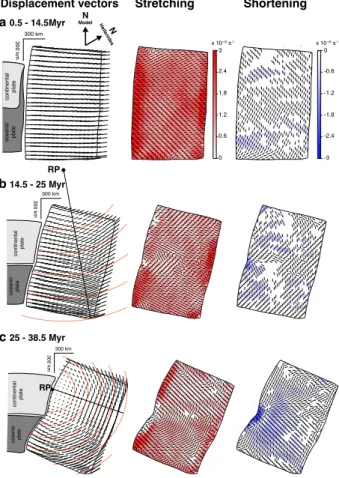
3.4 Overriding plate deformation
We measure the horizontal strain within the overriding plate at different times of the
5
experiment by tracking the displacement of grid nodes initially evenly-spaced by 60 km. Owing to the newtonian behavior of the silicone used to model the overriding plate, deformation is continuous. Figure 7 presents the displacement field and main strain directions recorded during three time intervals for model 1.
Before the arrival of continental lithosphere at the trench (0.5–14.5 Myr), the finite
10
displacement of the overriding plate with respect to the lower mantle reference frame is larger at its western edge than at its eastern edge, resulting in trench-perpendicular stretching (Fig. 7a). Stretching is not uniform, owing to differential shear stresses ex-erted at the lithosphere–asthenosphere boundary that resist the trenchward motion of the upper plate. It is maximal within the first 120–180 km from the trench (Fig. 7a) and
15
decreases away from the boundary. Local trench-parallel stretching at the southern and northern edges of the upper plate results from the free lateral boundary conditions that allow the silicone plate to spread laterally above the low-viscosity glucose syrup under the effect of gravity.
The early stage of continental lithosphere subduction (14.5–25 Myr) is associated to
20
a 30 to 60 % decrease in trench retreat rates along the entire subduction zone (Fig. 3g, h). Its deformation decomposes into translation (herein irrelevant), plain rotation and stretching. During this period, the grid nodes rotate clockwise around a pole located
∼500 km north of the northernmost extent of the overriding lithosphere (Fig. 7b). Over-riding plate mainly deforms through laterally non uniform stretching. For the first 180 km
25
SED
5, 315–363, 2013Dynamics of laterally variable subductions
B. Guillaume et al.
Title Page
Abstract Introduction
Conclusions References
Tables Figures
◭ ◮
◭ ◮
Back Close
Full Screen / Esc
Printer-friendly Version Interactive Discussion
Discussion
P
a
per
|
Dis
cussion
P
a
per
|
Discussion
P
a
per
|
Discussio
n
P
a
per
|
Region of maximum trench-perpendicular stretching coincides with the area where the gradient of the east-west component of horizontal mantle flow at the top of the astheno-sphere is maximum (Fig. 6b), i.e. where shear stresses underneath the lithoastheno-sphere are the highest. Within the first 60 km in front of the continental–oceanic transition, the overriding plate mainly deforms under moderate trench-parallel shortening (Fig. 7b).
5
In the final stage (25–38.5 Myr), the difference in along-trench kinematics results in a clockwise rotation of grid nodes with a rotation pole located on the trenchward edge of the overriding plate in front of the continental unit (Fig. 7c). Despite the almost null motion of the trench at the location of the continental unit, the trenchward edge of the overriding plate north of the oceanic-continental transition still deforms under
10
trench-perpendicular stretching at higher rates than recorded before (>3×10⁻¹⁶s−1)
(Fig. 7c). Deformation here is controlled by stresses arising from the far-field, associ-ated with trench retreat for the oceanic unit at moderate rates (2±1 cm yr−1) (Fig. 3g, h). Within the first 60 km from the trench, the center of the overriding plate is dominated by trench-perpendicular shortening (Fig. 7c), as a result of the indentation of the
con-15
tinent. Indeed at this specific location, retreat of the oceanic lithosphere to the south triggers the westward absolute motion of the overriding plate at a faster rate than the westward absolute trench motion, slowed down by the subduction of positively buoy-ant lithosphere to the north. Beyond 120 km, upper plate deforms under a combination of moderate stretching and shortening, the principal axis of stretching rotating from
20
trench-perpendicular on its edges to trench-parallel in its center (Fig. 7c).
3.5 Dynamic topography
Long-wavelength, non-tectonic uplift or subsidence counterbalance the vertical trac-tion caused by the flowing mantle underneath the lithosphere. Ultimately, this flow is excited by density variations in the mantle, and that component of the
topogra-25
SED
5, 315–363, 2013Dynamics of laterally variable subductions
B. Guillaume et al.
Title Page
Abstract Introduction
Conclusions References
Tables Figures
◭ ◮
◭ ◮
Back Close
Full Screen / Esc
Printer-friendly Version Interactive Discussion
Discussion
P
a
per
|
Dis
cussion
P
a
per
|
Discussion
P
a
per
|
Discussio
n
P
a
per
of dynamic subsidence can exceed several hundred meters (Mitrovica et al., 1989; Gurnis, 1993; Zhong and Gurnis, 1994; Husson, 2006; Husson et al., 2012).
We track the vertical deformation of the model surface with a scanner during subduc-tion in model 11 and in particular at the top of the asthenosphere above the subducting lithosphere, north and south of the discontinuity (Fig. 8).
5
The subduction of buoyant material after∼18 Myr of subduction induces an instan-taneous response of the surface for the northern continental subduction zone with an uplift of around 0.7 km in∼3 Myr at 250 km from the trench (Fig. 8b). Conversely, in the
oceanic portion of the subduction zone, although the trench retreat velocity strongly decreases, the variations in surface elevation remain elusive during∼10 Myr (Fig. 8c).
10
However, between 30 and 42 Myr, the surface uplifts of ∼0.7 km, which may be
ex-plained by the influence of positively buoyant material to the north, that globally de-creases the subduction rate, and as such, the vertical traction exerted by the mantle on the surface.
Surface motion at 500 km from the trench appears insensitive to changes in slab
15
buoyancy (Fig. 8b, c). However on the long-term, the surface gently uplifts at rates of
∼0.02 mm yr−1 for both continental and oceanic subductions between 18 and 42 Myr.
Dynamic topography being directly sensitive to the vertical component of mantle flow, it once more reflects the fact that during that time interval the vigor of the horizontal mantle flow has decreased (Fig. 6) but also the vertical traction underneath the surface
20
as a result of the overall decrease in slab buoyancy.
After 42 Myr, the tear fault decouples the continental and oceanic units, which strongly modifies the dynamic topography above the oceanic portion of the subduc-tion zone. A ∼1.7 km downlift of the surface is recorded at 250 km from the trench, yielding a subsidence rate of ∼0.3±0.1 mm yr−1 (Fig. 8c). Decoupling the two slab
25
SED
5, 315–363, 2013Dynamics of laterally variable subductions
B. Guillaume et al.
Title Page
Abstract Introduction
Conclusions References
Tables Figures
◭ ◮
◭ ◮
Back Close
Full Screen / Esc
Printer-friendly Version Interactive Discussion
Discussion
P
a
per
|
Dis
cussion
P
a
per
|
Discussion
P
a
per
|
Discussio
n
P
a
per
|
its initial value, prior to the entry of the continental unit into the subduction zone. This additional 1 km downlift is therefore a consequence of mantle flow reorganization as-sociated to slab narrowing, which in this case promotes faster vertical sinking of the slab.
4 Comparison to the Hellenic subduction
5
4.1 Geological setting
The Hellenic subduction is a small remnant of the vast Tethyan subduction that drove the collision of Africa and Eurasia (Fig. 1). Another few of those small subduction zones are found in the Mediterranean (e.g. Royden, 1993; Malinverno and Ryan, 1986) but the Aegean slab is probably the last that remains powerful enough to be considered
10
an active tectonic system, for the subducting Ionian lithosphere could be the oldest seafloor on Earth (Speranza et al., 2012). In the general framework of the now very slow African-Eurasian collision, the subduction of the Aegean slab, that is attached to Africa, resembles thefixed mode of subduction of our models. Fast rollback accompa-nied the subduction, triggering pervasive lithospheric extension in the Aegean domain
15
(see Jolivet et al., 2013, for a review), trenchward migrating volcanism and exciting adjacent mantle flow (Paul et al., 2010).
However, this activity did not prevail throughout the entire Tertiary (e.g. Papaniko-laou and Royden, 2007; Brun and Sokoutis, 2010; Royden and PapanikoPapaniko-laou, 2011; Jolivet et al., 2013). The Aegean domain globally spreads until Mid-Miocene, until the
20
right lateralNorth Anatolian Fault (NAF) isolated Anatolia from the Eurasian continent ( ˇSeng ¨or et al., 2005; Royden and Papanikolaou, 2011), cut through the Marmara Sea and reached the Aegean Sea and formed the North Aegean Trough (NAT). During that early stage, lithospheric stretching accommodated slab retreat and faults trended parallel to the uniformly retreating trench.
SED
5, 315–363, 2013Dynamics of laterally variable subductions
B. Guillaume et al.
Title Page
Abstract Introduction
Conclusions References
Tables Figures
◭ ◮
◭ ◮
Back Close
Full Screen / Esc
Printer-friendly Version Interactive Discussion
Discussion
P
a
per
|
Dis
cussion
P
a
per
|
Discussion
P
a
per
|
Discussio
n
P
a
per
Then, a brief Late Miocene to Early Pliocene episode of localized arc parallel exten-sion occurred in the outer rim of the Hellenic arc, in the Cretan Sea and Peloponnese in particular (Fig. 9a). This event is coeval to the inception of the right lateral Kefalonia Fault (Papanikolaou and Royden, 2007) which, from Pliocene onwards, further modi-fied the kinematics of the area. The subduction of a plate of laterally variable buoyancy
5
along the Hellenic trench could have profoundly modified the Aegean dynamics. In-deed, since Late Miocene times, the Kefalonia Transform Fault isolates the Adriatic continental unit from the Ionian oceanic plate (Kahle et al., 1993; Vassilakis et al., 2011). Subduction rates at the North and South Hellenic trenches occur at rates of 5 to 12 mm yr−1and 25 to 40 mm yr−1(e.g. McClusky et al., 2000; Royden and
Papaniko-10
laou, 2011; P ´erouse et al., 2012), respectively, which offsets the South and North Hel-lenic subduction zones by a few tenths of kilometers at present day. The formation of the fault itself results from the entry in the subduction zone of a very negatively buoyant oceanic plate to the south, while in the north the subduction of a continental unit of increasingly positive buoyancy proceeds, as the buoyancy difference of the two
15
plate units suffices to trigger a laterally variable regime along the trench (Royden and Papanikolaou, 2011).
The Aegean Sea then migrated along with the trench to the South-West (with respect to stable Eurasia), as an apparently almost rigid unit (McClusky et al., 2000; Kreemer and Chamot-Rooke, 2004). Extension is now focussed in the West Anatolian Shear 20
zone (WASZ), on the western margin of Turkey, in the Peloponnese and in Mainland Greece (Gautier et al., 1999; Jolivet et al., 2013; Royden and Papanikolaou, 2011, Fig. 9b). Only in Mainland Greece and Peloponnese deformation remains somewhat diffuse (Vassilakis et al., 2011; Bradley et al., 2013); only in this area the Anatolian plate is not separated from Eurasia by a discrete right lateral fault. The Kefalonia Fault could
25
SED
5, 315–363, 2013Dynamics of laterally variable subductions
B. Guillaume et al.
Title Page
Abstract Introduction
Conclusions References
Tables Figures
◭ ◮
◭ ◮
Back Close
Full Screen / Esc
Printer-friendly Version Interactive Discussion
Discussion
P
a
per
|
Dis
cussion
P
a
per
|
Discussion
P
a
per
|
Discussio
n
P
a
per
|
Greece, gently swing to ∼N120 across the Gulf of Corinth, and reach ∼N170
(ap-proximately trench parallel) in the South Peloponnese (e.g. Doutsos, 2001). From the western tip of the NAF to the Kefalonia Fault (i.e. in the NAT and CHSZ), only normal faulting is unequivocally identified; this lead P ´erouse et al. (2012) to advocate that the GPS inferred strain field does not require any dextral shear component in this area.
5
Despite the inherent oversimplifications of our experimental setup, our dynamic mod-els resemble the Hellenic subduction by many aspects. The Kefalonia Fault shall be considered as the tear fault (possibly shear-stress free) that isolates plate units of con-trasted buoyancies. In the following, we interpret the observables for the Hellenic sub-duction (trench and upper plate kinematics, mantle flow and topography) at the light of
10
our dynamic models.
4.2 The Hellenic trench
The Hellenic trench initially migrated continuously along the outer rim of the Aegean domain. It accompanied the global expansion and spreading, that is well reproduced by our models, where the initially linear trench becomes concave during trench retreat
15
(Fig. 4), as in earlier models (e.g. Funiciello et al., 2003; Morra et al., 2006; Loiselet et al., 2009). The shape of the trench responds efficiently to the entry of a plate of laterally variable buoyancy into the subduction zone. In the models, it corresponds to the introduction of a low buoyancy unit that locally decreases the trench migration rates (Fig. 3); in the Hellenides it is the introduction of the old Ionian oceanic lithosphere after
20
the consumption of the Adria block that speeds up trench migration to the south. In both cases, the difference in trench migration rates imposed by lateral slab buoyancy vari-ability increases by a few tenths of mm yr−1after a few million years. It is accompanied, in the models, either by a viscous shear of the subducting plate when no built-in tear fault accommodates the differential trench motion, or by a right lateral slip along the tear
25
SED
5, 315–363, 2013Dynamics of laterally variable subductions
B. Guillaume et al.
Title Page
Abstract Introduction
Conclusions References
Tables Figures
◭ ◮
◭ ◮
Back Close
Full Screen / Esc
Printer-friendly Version Interactive Discussion
Discussion
P
a
per
|
Dis
cussion
P
a
per
|
Discussion
P
a
per
|
Discussio
n
P
a
per
2011; Royden and Papanikolaou, 2011). This value corresponds to the difference in the trench velocities of the northern and southern Hellenic subduction zones, a figure that is also obtained in the models after a few million years (Fig. 3). Interestingly, the models show that it takes more than∼4 Myr, i.e. the time since the onset of the activity
of the Kefalonia Fault, before steady state is reached. This suggests that the slip rates
5
along the Kefalonia Fault may be accelerating and continue to speed up in the future (along with an acceleration of the southern trench migration, as also shown by Royden and Papanikolaou, 2011).
Trench depth varies along strike; while in the Northern Hellenides the trench is shal-lower than∼1000 m, in the southern counterpart, it is more than 3000 m deep (Fig. 11).
10
The absolute trench depth in the models overshoots that figure by 5000 to 8000 m (Fig. 5b, c, and Husson et al., 2012), because our setup does not account for faults (as in Zhong and Gurnis, 1994, for instance), and because the meniscus caused by sur-face tension increases the depth by a constant. Those undesired effects are particularly high at low rates. However, relative depths for similar subduction rates are comparable
15
in our models (Fig. 5c), i.e. some 2000 to 4000 m deeper for fast subducting plates (at∼30 mm yr−1) than for the slowly subducting plates (at ∼10 mm yr−1). This results
confirms that the along strike variations in the Hellenic trench depth mirror the laterally variable subduction rates.
4.3 Aegean deformation
20
Trench migration in our models follows the mechanism that was initially proposed by Royden and Papanikolaou (2011). In addition, our models explore the impact of the inception of the Kefalonia Fault onto the upper plate. Silicone plates behave as quasi-Newtonian fluids at experimental strain rates. Thus in our simplified model, upper plate deformation is diffuse and the models do not produce any of the faults that may also
25
SED
5, 315–363, 2013Dynamics of laterally variable subductions
B. Guillaume et al.
Title Page
Abstract Introduction
Conclusions References
Tables Figures
◭ ◮
◭ ◮
Back Close
Full Screen / Esc
Printer-friendly Version Interactive Discussion
Discussion
P
a
per
|
Dis
cussion
P
a
per
|
Discussion
P
a
per
|
Discussio
n
P
a
per
|
of the models to the discrete deformation observed on Earth holds. Indeed, our models show comparable patterns of deformation and explain the temporal evolution of Aegean tectonics though, of course, the diffuse deformation and the unaccounted Anatolian extrusion prevent the reproduction of the discrete dextral shear found in the NAT and NAF.
5
During the early stage of Aegean expansion, prior to the inception of the Kefalonia Fault, lithospheric stretching accommodated slab retreat and faults trended parallel to the uniformly retreating trench, in agreement with the deformation seen during the early stages of our models: extension is widespread and reaches its fastest rate on the entire plate (Fig. 7a). The inception of the tear fault initiated a non uniform rollback
10
and trench migration (see Sect. 4.2) that caused a wholesale rotation of the upper plate around a Euler pole located some 1200 km from the triple junction (Fig. 7b). Deformation remained essentially extensional, and the deformation axis in the models show that normal faults in front of the oceanic unit are expected to trend parallel to the trench (Fig. 7b). This episode explains the arc parallel “transitional” episode of
15
deformation of Papanikolaou and Royden (2007) (Fig. 9a).
The third stage of deformation (Fig. 7c) occurs at the time where the tear fault reaches mantle depths. Then, the Euler pole shifts to a much closer location to the triple junction between the tear fault and the trench, at∼300 km. It approximately matches the location of the Euler pole for post-Eocene (and probably post-Oligocene) rotations
20
that was found close to Scutari-Pec, Albania, on the basis of paleomagnetic measure-ments (Speranza et al., 1992). It is similar to the Euler pole proposed by van Hinsber-gen et al. (2005) on the basis of paleomagnetic measurements for western Greece, on average since Mid-Miocene (thus compatible). It also matches the location of the Euler pole found by Brun and Sokoutis (2010), on the basis of a comparison between
stretch-25
SED
5, 315–363, 2013Dynamics of laterally variable subductions
B. Guillaume et al.
Title Page
Abstract Introduction
Conclusions References
Tables Figures
◭ ◮
◭ ◮
Back Close
Full Screen / Esc
Printer-friendly Version Interactive Discussion
Discussion
P
a
per
|
Dis
cussion
P
a
per
|
Discussion
P
a
per
|
Discussio
n
P
a
per
rotation pole proposed by P ´erouse et al. (2012) from kinematic indicators. That rota-tion is accompanied by strong extension in the vicinity of the trench. In the models, the extension axis is approximately oriented N–S in front of the triple junction, at an equivalent location to the CHSZ (Fig. 7c). The two last stages therefore reproduce the structural pattern of the Peloponnese and Mainland Greece, where extension shifts
5
from arc-parallel to arc-crossing trends. In particular, the∼EW trending Corinth rift is
well explained by our models. In addition, our models predict some localized compres-sion next to the triple junction (Fig. 7b), a somewhat less abundant, yet present, feature in Greece around Kefalonia (Sachpazi, 2000; Vassilakis et al., 2011, and Fig. 9b).
A synthetic view is given by the horizontal divergence and curl of the model surface
10
velocity fields (Fig. 9c, d), that we use to locate stretching and shear, respectively. After the first stage of widespread extension, the divergence field reveals the initiation of an elongated extensional zone in front of the triple junction during the second stage (after the inception of the tear fault) (Fig. 9c), i.e. at a location that compares to that of the CHSZ and NAT with respect to the Kefalonia Fault; this episode continues during the
15
third stage, but decreases in magnitude (Fig. 9d). Furthermore, divergence in this area indicates that the extensional zone in our models enlarges and increases in magnitude north-eastward, away from the triple junction, i.e. at comparable location to the NAT. This pattern of scissors-like stretching is that of the deformation from the Gulf of Patras towards the Aegean sea. A second zone of extension appears by the oceanic trench,
20
at a location that compares to that of the Cretan Sea and Peloponnese, a feature that decreases during the third stage, in accordance with the geological record. Second, mapping the curl of the horizontal velocity field locates occurrences of toroidal flow, that is the local rotation about the vertical axis, that we interpret as the location where strike slip faulting is expected (Fig. 9c, d). The curl shows that very little shear occurs
25
SED
5, 315–363, 2013Dynamics of laterally variable subductions
B. Guillaume et al.
Title Page
Abstract Introduction
Conclusions References
Tables Figures
◭ ◮
◭ ◮
Back Close
Full Screen / Esc
Printer-friendly Version Interactive Discussion
Discussion
P
a
per
|
Dis
cussion
P
a
per
|
Discussion
P
a
per
|
Discussio
n
P
a
per
|
is largest close to the trench, at a location that compares to that of the wide CHSZ with respect to the Kefalonia Fault. It thins away at a location that matches that of the nar-row NAT and NAF, as opposed to divergence. In summary, deformation evolves through time from extension towards strike-slip via transtension, as indicated by the ratio diver-gence/curl that decreases through time, by an average factor of∼4 from the second to
5
the third stage. As dextral shear builds up, the deforming zones narrow, which resem-bles the evolution of the broad extensional NAT, Cretan Sea and Peloponnese (during Late Miocene and Early Pliocene, i.e. the second stage) towards a more localized dex-tral transtension across the CHSZ and NAT (during the third, Plio-Quaternary stage), as suggested by Papanikolaou and Royden (2007). This resemblance lead us to
con-10
clude that together, the divergence and curl fields of the model horizontal velocities clearly predict the deformation field as revealed from structural analysis (Papanikolaou and Royden, 2007) but also from the focal mechanisms at present-day (Fig. 9b). In details, eastward from Kefalonia, observed deformation shifts from (dominantly) com-pression to (dominantly) dextral strike slip and (dominantly) extension around Corinth.
15
Our models successfully reproduce the observed kinematics, with a late episode of
∼N50 trending dextral shear (akin to the NAT and NAF) and ∼N90 trending normal
faults (akin to the Gulf of Corinth) that follows a transitional episode of arc parallel nor-mal faulting. The dynamic causes shall be explored thanks to the analysis of the mantle flow.
20
4.4 Mantle flow
The three stage tectonic evolution of the Hellenic domain is successfully reproduced by our models; they correspond to the subduction of uniformly buoyant slab, to the entry of the heterogeneous slab, and last, to the complete subduction of the tear fault. How it forces the deformation of the upper plate is due to the changes in the driving
25
SED
5, 315–363, 2013Dynamics of laterally variable subductions
B. Guillaume et al.
Title Page
Abstract Introduction
Conclusions References
Tables Figures
◭ ◮
◭ ◮
Back Close
Full Screen / Esc
Printer-friendly Version Interactive Discussion
Discussion
P
a
per
|
Dis
cussion
P
a
per
|
Discussion
P
a
per
|
Discussio
n
P
a
per
the underlying mantle flow; this suggests that it is mostly mantle drag that efficiently controls the kinematics of plate boundaries (Husson, 2012).
At present-day, the Hellenic slab is most likely teared between Rhodes and Cyprus and a window allows for mantle flow underneath West Anatolia (Govers and Wortel, 2005). The situation is less clear for the Kefalonia Fault; seismic tomography (Spakman
5
et al., 1988; Piromallo et al., 2006; Suckale et al., 2009) possibly reveals a discontin-uous slab and more detailed seismic experiments suggest that the surface of the slab is offset horizontally by some 100 km across the Kefalonia Fault (Gesret et al., 2011). However, whether the mantle flows through a potential Kefalonia window remains un-certain, and it is most likely small, if any. Only seismic anisotropy (Fig. 10a, Paul et al.,
10
2010; Hatzfeld et al., 2001; Evangelidis et al., 2011) possibly advocates for along-arc mantle flow that could be interpreted as originating from the Kefalonia window, but the not-so-clear nature of along-arc anisotropy (e.g. Russo and Silver, 1994; Long and Sil-ver, 2009; Faccenda and Capitanio, 2013) prevents from being conclusive. Overall the trend of seismic tomography in the sublithospheric mantle does not accurately match
15
the motion of Anatolia. In particular, anisotropy is not imprinted yet by the too young shear underneath the North Anatolian fault (Kreemer et al., 2004; Jolivet et al., 2009); this observation precludes its use as a mean to explore recent changes in mantle de-formation.
However, based on the comparison to surface deformation, P ´erouse et al. (2012)
20
concluded that the Kefalonia window is opened. Indeed, surface strain shows what P ´erouse et al. (2012) refer to as two toroidal cells, dextral and sinistral at the western and eastern edges of the oceanic slab. Our models shows that this behavior is also obtained just before the actual opening of the tear fault (Fig. 7c). However, our mod-els also showed that it is only when the tear fault is actually subducted that dextral
25
SED
5, 315–363, 2013Dynamics of laterally variable subductions
B. Guillaume et al.
Title Page
Abstract Introduction
Conclusions References
Tables Figures
◭ ◮
◭ ◮
Back Close
Full Screen / Esc
Printer-friendly Version Interactive Discussion
Discussion
P
a
per
|
Dis
cussion
P
a
per
|
Discussion
P
a
per
|
Discussio
n
P
a
per
|
overriding plate. This shear only happens when the diversion of the mantle flow thanks to the Kefalonia tear fault begins, and not before (when the fault has not reached man-tle depths). If the slab window was fully opened, and allowed for manman-tle flow through it, dextral shear would be even more dramatic. This shows that it is mantle flow, and not trench pull or any shallow process, that causes it. Instead, we conclude that the
5
increasingly vigorous toroidal flow around the edges of the oceanic slab is responsible for dextral shear across the two units: basal, southwestward drag grows larger in the southern section than in the northern one and is enough to shear the overriding plate, possibly helping the NAF to make its way across the Aegean and Mainland Greece and Peloponese.
10
4.5 Dynamic topography
Mantle flow causes the sufficient drag force to shear the Aegean lithosphere. It also induces vertical tractions that deflect the surface. Mantle flow models indicate that dy-namic topography is likely in excess of 1000 m in the Cretan Sea (Husson, 2006; Boschi et al., 2010; Faccenna and Becker, 2010). In particular, it may be responsible for the
15
very deep Cretan Sea (Fig. 11). Of course, residual topography is not real topogra-phy. Nevertheless, we note that in the Aegean domain, crustal thickness only varies by a few kilometers (e.g. Tirel et al., 2004) and isostasy by no means shall suffice to explain the ∼2000 m variations in elevation. Indeed, elevation drops from north to south across the CHSZ, from the continental North Hellenic subduction to the oceanic
20
South Hellenic one (Fig. 11). Second, flooding of the Aegean sea started after roll-back started (see the paleogeographic reconstructions of Dermitzakis and Papaniko-laou, 1981) and likely increased during Late Neogene (Wright, 1978; van Hinsbergen et al., 2004, 2005). It remains difficult to evaluate the subsidence rates, but we observe that subsidence therefore took place above the oceanic slab, at the time during which
25
SED
5, 315–363, 2013Dynamics of laterally variable subductions
B. Guillaume et al.
Title Page
Abstract Introduction
Conclusions References
Tables Figures
◭ ◮
◭ ◮
Back Close
Full Screen / Esc
Printer-friendly Version Interactive Discussion
Discussion
P
a
per
|
Dis
cussion
P
a
per
|
Discussion
P
a
per
|
Discussio
n
P
a
per
elevation between the two units. This result corroborates the idea that dynamic topog-raphy plays a critical role in shaping the Aegean seafloor.
5 Discussion and conclusions
We use three-dimensional analogue models of subduction to explore the interplay be-tween mantle flow and surface tectonics during the subduction of a slab of laterally
vari-5
able buoyancy. The simplified experimental setup provides the necessary ingredients to successfully reproduce the kinematics and tectonic history of the Aegean–Anatolian region since middle Miocene and for the analysis, in particular, of the role played by mantle flow around the Kefalonia Fault.
For a fixed ridge configuration, slab pull controls the subduction velocity, which
es-10
sentially scales with trench velocity. Lateral density variations modify this simple scaling law and cause a profound, three-dimensional reorganization of the subduction system. Trench migration rates are not only controlled by the local slab pull force but are also influenced by the changes in neighboring slab density. This is the case of the Hellenic subduction zone, where the buoyancy of the subducting lithosphere purportedly
dras-15
tically changes across the Kefalonia Fault, from a dense oceanic to a continental litho-sphere. In all models, trench migration rates within the oceanic unit decreases after the onset of continental unit subduction despite the unchanged local slab pull force. The influence is gradual and vanishes at larger distances than∼500 km from the density discontinuity. The reciprocal effect, that would be trench retreat for the continental unit
20
despite the low or null local slab pull force, is not verified. Instead, trench stops retreat-ing in spite of the still active local slab pull force. This illustrates the three-dimensional effect, which is the role played by the toroidal flow underneath the continental plate, ex-cited by the adjacent fast retreating oceanic plate. Compressive stresses underneath the slow-retreating continental unit cause it to prematurely stall and even advance.
Ge-25
SED
5, 315–363, 2013Dynamics of laterally variable subductions
B. Guillaume et al.
Title Page
Abstract Introduction
Conclusions References
Tables Figures
◭ ◮
◭ ◮
Back Close
Full Screen / Esc
Printer-friendly Version Interactive Discussion
Discussion
P
a
per
|
Dis
cussion
P
a
per
|
Discussion
P
a
per
|
Discussio
n
P
a
per
|
the trench from Middle to Late Miocene onwards (Royden and Papanikolaou, 2011), illustrating the decreasing trench retreat rates in Peloponnesus due to the subduction of more buoyant material beneath the northern Hellenides.
Our analysis also shows how mantle flow is controlled by changes in along-trench kinematics. During the subduction of a uniform slab, trench retreat is almost uniform
5
along the entire length of the subduction zone and two symmetrical toroidal cells de-velop at the edges of the subduction zone. In the Central Mediterranean, such man-tle flow pattern has been proposed to explain for instance anomalous uplift around the Calabrian subduction zone (Faccenna et al., 2011). A direct comparison with the Hellenic subduction zone at this stage is more hazardous since only one slab tear
10
between the western edge of the Cyprus slab and the eastern edge of the Hellenic slab is clearly imaged by tomographic models (e.g. Sala ¨un et al., 2012). The following stages instead more likely resemble the Hellenic subduction zone with the introduction of a lateral buoyancy variation, similar to the difference in slab buoyancy across the Ke-falonia region, that diverts horizontal mantle flow from its previous symmetry. Toroidal
15
flow through the western Anatolian slab window, as imaged by SKS splitting data (Paul et al., 2010), results here from the fast retreat of the oceanic unit in the southern por-tion of the subducpor-tion zone. The latter is also responsible for trench-parallel mantle deformation north of the discontinuity, that could be one explanation for the NW–SE direction of fast polarization of SKS data observed beneath Mainland Greece (Fig. 10).
20
However, strain calculated in the model is short-term (calculated over a 0.5 Myr period) whereas fast direction of SKS data most likely reflects the long-term deformation of the mantle beneath the Aegean-Anatolian region. In addition, interpreting trench-parallel direction of SKS data close to the trench is not trivial (e.g. Long and Silver, 2009).
Thanks to their simple setups, our models reveal the main lines of the dynamic
25