ABSTRACT
RESUMO
Submetido em 06/11/15 e aprovado em 21/02/17.
1 Universidade Tecnológica Federal do Paraná, Pato Branco, Paraná, Brazil. [email protected]; [email protected]; [email protected]; [email protected]; [email protected]
2 Cooperativa Central de Pesquisa Agrícola (COODETEC), Cascavel, Paraná, Brazil. [email protected] *Corresponding author: [email protected]
Environment-specific selection to identify high yielding wheat
genotypes and response to fungicide application
Selection of disease resistant genotypes is the main goal of wheat (Triticum aestivum L.) breeding programs.
However, because of the lack of genotypes resistant to all diseases and the strong influence of the environment on the level of resistance of the genotypes, the use of fungicides is necessary in the cultivation of wheat. The objective of this study was to compare the gain in yield and the selection efficiency of wheat genotypes due to the fungicide application in trials carried out in different sites and years. This study used grain yield data from 816 wheat genotypes evaluated in 248 advanced trials at eight sites during the years from 2004 to 2012. The gain resulting from fungicide application for a given genotype was estimated by the difference between yield of plots on which fungicide was applied and control treatment. The greatest gains with fungicide application were observed in sites with lower average temperatures and higher rainfall indices, such as Campo Mourão, Castro, Não-Me-Toque and Guarapuava. On the other hand, the lowest gains with fungicide application occurred in Dourados and Palotina, environments where crops in general suffer water stress and present higher average temperatures. The year effect resulted in yield increases due to fungicide application ranging from 16.9 to 60.7%. The selection and evaluation of the response to the application of fungicide in wheat should be environment-specific to maximize the use of genotype x environment interaction.
Key-words: disease resistance; environment x genotype interaction; genotype selection; Triticum aestivum L.
Giovani Benin1*, Lindolfo Storck1, Volmir Sergio Marchioro2, Elesandro Bornhofen1,
Leomar Guilherme Woyann1, Diego Maciel Trevizan1
10.1590/0034-737X201764020009
Seleção ambiente-específica de genótipos para rendimento de grãos e responsividade à
aplicação de fungicida em trigo
A seleção de genótipos resistentes a doenças é uma meta prioritária dos programas de melhoramento genético de trigo (Triticum aestivum L.). Mas, devido a não existirem genótipos resistentes à todas as doenças e a forte influência
INTRODUCTION
In Brazil, wheat (Triticum aestivum L.) is grown in a
range of environments with different soil, weather and management conditions, which affect the cultivars adaptability and the pressure of pathogens, mainly those that cause fungal diseases.
The wide range of fungal diseases that may attack wheat crop presents different potentials of damage to the production and the quality of the grain produced throughout the country. The damage caused by those diseases depends on the growth stage of the crop and the severity of the disease, which is a function of environmental conditions, virulence of the physiological race and the susceptibility of the cultivar (Roelfs et al., 1992). The major
diseases of wheat in Brazil are powdery mildew (Blumeria graminis f.sp. tritici), leaf rust (Puccinia recondita f.sp. tritici) and the leaf spot complex, which includes brown
spot (Bipolaris sorokiniana), yellow spot (Drechslera tritici-repentis) and glume spot (Stagonospora nodorum).
These diseases occur mostly in regions with higher air relative humidity and especially affect the photosynthetic capacity of the plant. The control is usually efficient whem an appropriate crop management is carried out, mainly in relation to crop rotation and choice of fungicides.
In addition to plant’s structure diseases, spike diseases such as Fusarium head blight (FHB) (Gibberella zeae)
and blast (Pyricularia oryzae) have the potential to
prevent the translocation of photoassimilates to the grains and to produce toxins that may be harmful to consumers of the products derived from these grains. FHB is a disease that occurs more frequently in the states of Rio Grande do Sul, Santa Catarina and the coldest regions of Paraná. Blast is more frequent in the warmer regions of Brazil where wheat is grown. Those diseases are difficult of being controlled by fungicides.
The occurrence of diseases in wheat canopy has an important influence on the fluctuations in the production of this cereal, both in Brazil (Tormen et al., 2013) and in
other countries (Ilbery et al., 2012). Because of the
fungicide aplication costs and its environmental impacts, the main alternative of disease control is the use of resistant cultivars. However, there are no wheat cultivars with a good level of resistance to all diseases and the
resistance presented by the cultivars is relative, as it depends on the environmental conditions, which vary among years and regions where it is grown. Fungicide is applied to mitigate the effects of the lack of genetic resistance and unfavorable environmental conditions, such as high pathogen incidence, emergence of new strains of pathogens and pathogen-favorable environmental conditions.
The variation in efficacy and responsiveness to fungicide application is mainly influenced by the relative air humidity, temperature, pathogen aggressiveness, resistance of the cultivar and the level of technological management adopted (Barros et al., 2006; Jørgensen &
Olsen 2007; Loyce et al. 2008; Wegulo et al., 2011;
Thompson et al., 2014). Depending on the conditions of
the environment, management and cultivars, losses ranging from 5.5 to 79% due to the occurrence of leaf fungal diseases were recorded (Ransom & Mcmullen 2008; Wegulo et al. 2009; MacLeod et al., 2010; Tonin et al.,
2013). The losses in productivity are mainly due to the early senescence and to the lower interception and efficiency of the use of solar radiation (Serrago et al.,
2009; Zhang et al., 2010; Serrago et al., 2011).
The environmental variability and differentiated responses of genotypes to fungicide application makes it necessary to identify specific sites for the selection of cultivars and the evaluation of the effectiveness of this practice. In breeding programs, selection of cultivars and their responses to fungicide application is carried out in experimental units (Kurt, 2002). Value for Cultivation and Use (VCU) tests are generally conducted with one or more fungicide applications, for maximum expression of the genotype, without the interference of diseases, and in one or more replicates, no fungicide is applied. In these plots where no protection is used, the reduction in productivity may vary significantly, according to the degree of resistance of the cultivars and the environmental conditions.
The objective of this study was to determine the gain in wheat yield due to the application of fungicides in different years and cultivation sites, and to qualify environments that enhance the selection of genotypes that are more resistant and/or responsive to fungicide application.
em Dourados e Palotina, ambientes que geralmente impõem estresses hídricos a cultura e que possuem temperaturas médias mais elevadas. O efeito de anos de cultivo resultou em incrementos de produtividade devido a aplicação de fungicida que variaram de 16,9 a 60,7%. A seleção e a avaliação da resposta à aplicação de fungicida em trigo deve ser ambiente-específica, buscando maximizar o aproveitamento da interação genótipo x ambiente.
MATERIAL AND METHODS
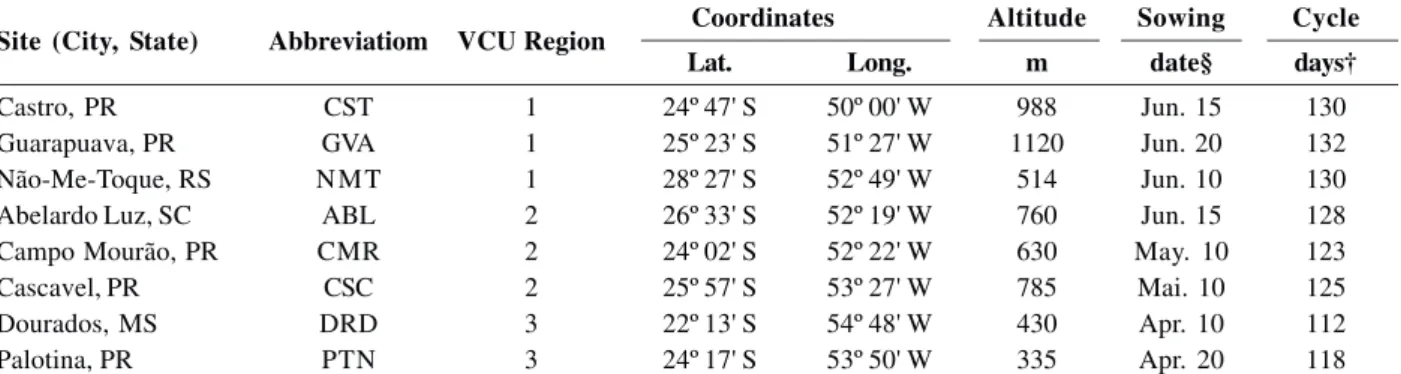
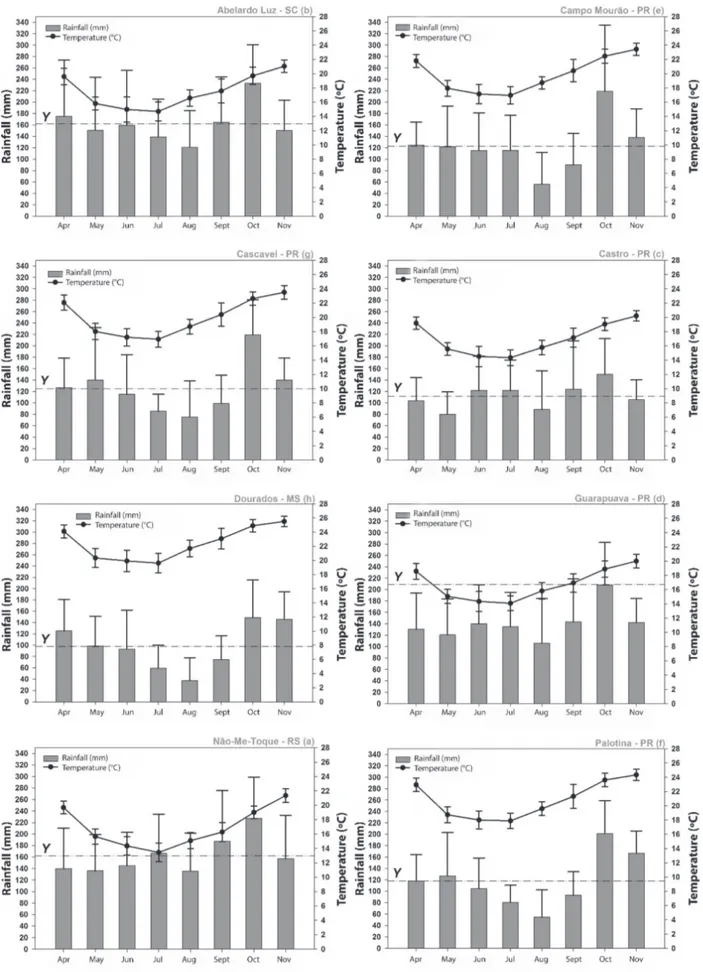
We used data from grain yield of 816 wheat genotypes (90 cultivars and 726 lines) evaluated in 248 trials at eight growing sites in crop seasons from 2004 to 2012. The tests were conducted in Abelardo Luz, state of Santa Catarina (ABL), Campo Mourão in the state of Paraná (CMR), Cas-cavel, state of Paraná (CSC), Castro, state of Paraná (CST), Dourados, state of Mato Grosso do Sul (DRD), Guara-puava, state of Paraná (GVA), Não-Me-Toque, state of Rio Grande do Sul (NMT) and Palotina, state of Paraná (PTN). The sites differ regarding to altitude, latitude and longitude (Table 1), rainfall and temperature (Figure 1), and are representative of the VCU 1 (CST, GVA, NMT), VCU 2 (ABL, CMR, CSC) and VCU 3 (DRD, PTN) region. The genotypes were evaluated in the Value for Cultivation and Use (VCU) network of the wheat breeding program from the Central Agricultural Cooperative for Economic and Social Development (COODETEC).
The trials were carried out using a randomized com-plete block design and each one consisted of 25 genotypes distributed in three blocks with fungicide and one block with no fungicide application. The plots consisted of six lines of 5.0 m length, spaced by 0.20 m apart. Crop management and application of fungicides were carried out according to the technical information for the wheat crop in each evaluation year (RCBPTT, 2008). Because the tests were conducted in different regions, with occurrence of different diseases, the number of preventive applications ranged from 3 to 5, carried out at the same time for all genotypes, aiming at a more effective control of diseases at any growth stage. At maturity, harvest was carried out and grain yield (kg ha-1) was measured,
corrected at 13% of moisture.
Gain (G) in grain yield in the blocks where fungicide was applied in relation to the same genotype in the block with no application of the fungicide, for each trial and genotype, was estimated using the expression: Gij = 100(Yij - Yi4) / Yi4 for the production (Y) for the genotype i in
blocks j = 1, 2 and 3 (with fungicide) and = 4 (with no
fungicide).
The two characters (Y and G), with three replicates, were submitted to analysis of variance according to the randomized complete block design. The selective accuracy was calculated using the expression: SA = (1 - 1/F)0.5 where
F = value of the F test for genotypes in the analysis of variance (Resende & Duarte, 2007).
The semi-amplitude of the confidence interval was estimated using the expression: , where z = 1.96
for 95% of confidence, σ is the standard deviation for the set of evaluated individuals and n indicates the number of
individuals evaluated.
The genotypes were divided into two percentiles (P0.05 and P0.95), where P0.05 is the group of genotypes less responsive to the application of fungicides and P0.95 is the most responsive group. The genotypes were also divided into classes according to the percentage gain in yield and yield regarded to overall average yield. In the first division, two classes were formed, one composed of genotypes with gain in yield with lower application of fungicide and the other higher than the overall average, which was 36.3%. In the second division, the two clas-ses were composed of genotypes with lower and higher yield than the general average (3.380 kg ha-1). The sites
are considered significantly different when the mean + CI (half range of the confidence interval, 1-p = 0.95) of one site is less than the average - CI of another location. Statistical analyzes were performed in the Genes program (Cruz, 2013) and figures elaborated in the Sigmaplot v.11 software.
RESULTS AND DISCUSSION
The genotype effect on grain yield and gain due to fungicide application was significant (p < 0.05) in 100% of the tests (Table 2). This indicates that, regardless of the cultivation site or the year of evaluation, a variation was found among the genotypes regarding the response to
Table 1: Test sites for evaluation of wheat genotypes with the respective Value for Cultivation and Use (VCU) regions, geographic coordinates, altitude, sowing date and average cycle of genotypes
Coordinates Altitude Sowing Cycle
Lat. Long. m date§ days†
Castro, PR CST 1 24º 47' S 50º 00' W 988 Jun. 15 130
Guarapuava, PR GVA 1 25º 23' S 51º 27' W 1120 Jun. 20 132
Não-Me-Toque, RS NMT 1 28º 27' S 52º 49' W 514 Jun. 10 130
Abelardo Luz, SC ABL 2 26º 33' S 52º 19' W 760 Jun. 15 128
Campo Mourão, PR CMR 2 24º 02' S 52º 22' W 630 May. 10 123
Cascavel, PR CSC 2 25º 57' S 53º 27' W 785 Mai. 10 125
Dourados, MS DRD 3 22º 13' S 54º 48' W 430 Apr. 10 112
Palotina, PR PTN 3 24º 17' S 53º 50' W 335 Apr. 20 118
§Approximate sowing date. †Average cycle from sowing to physiological maturity.
fungicide application, with the possibility of selection of genotypes that are more resistant and/or responsive to phytosanitary management.
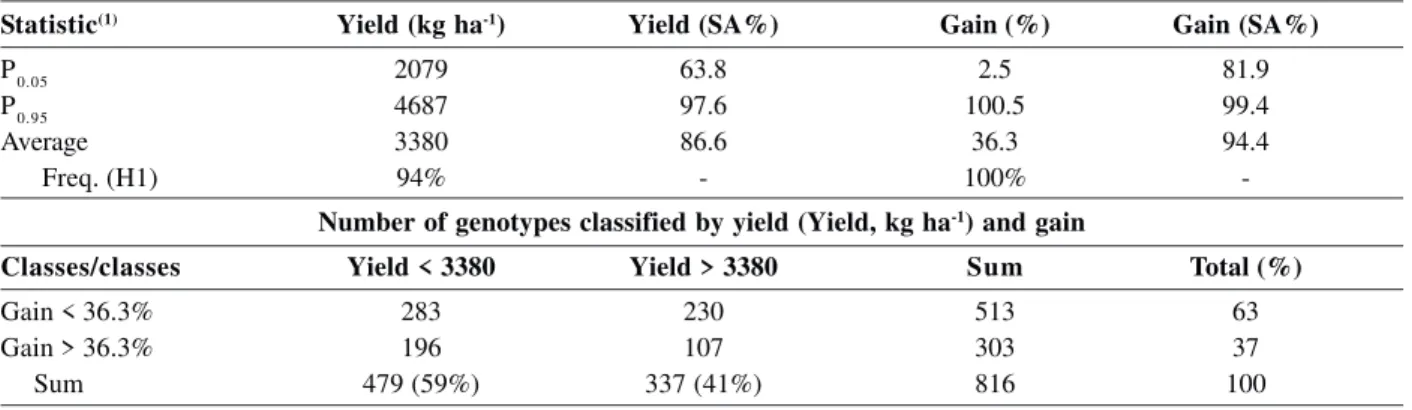
Yield gain due to fungicide application exceeded the control yield (without fungicide) by 100.5% in 5% of the tests, indicating the presence of genotypes that are susceptible to diseases and highly responsive to application of genotypes (Table 2). In addition, in 5% of the trials, the gain with the application of fungicide was less than 2.5%, which may indicate, in these tests, the presence of genotypes more resistant to diseases and/or environments (sites and years) less favorable to the development of pathogens. These results show that the management of diseases with fungicides results in significant gains in grain yield.
The overall average of yield gain with fungicide application was 36.3%. The selective accuracy (SA), which evaluates the accuracy of the tests (Resende & Duarte, 2007), was 81.9% in the 5% less responsive to fungicide application genotype group and 99.4% in the 5% more responsive to fungicide application genotype group (Table 2). The highest SA in the 5% more responsive group is due to the greater amplitude of response variability of the genotypes to the fungicide, raising the mean square of genotype in the analysis of variance and, consequently, the calculated F value. The overall mean of SA was 94.4%, indicating high experi-mental accuracy in genotype selection. In the same groups, the SA for the grain yield character was lower than the SA for the gain due to the application of fungicide, indicating that the grain yield is more dependent on the environmental variation.
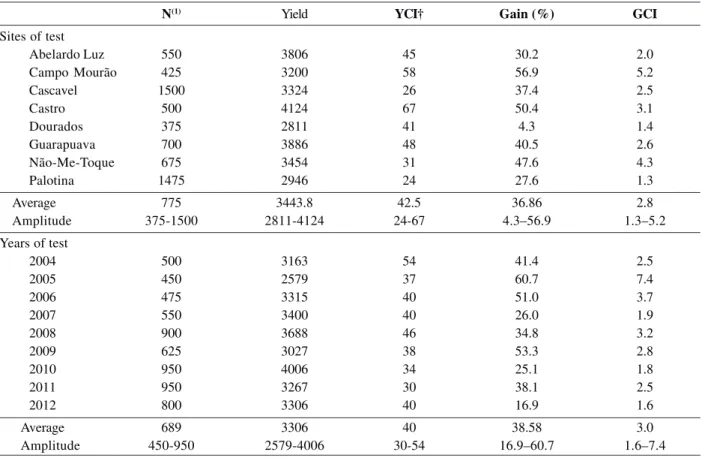
In this study, the influence of the environmental effect (sites and years of cultivation) on the productive performance of wheat and on the response to fungicide application was evidenced (Table 3). Wegulo et al. (2011)
also observed that the environmental component is
important and highly dependent on the site and year of cultivation. In Table 3, Dourados was the site with the lowest grain yield average (2,811 kg ha-1) and it showed
the lowest gain with fungicide application (4.3%). The lower yield and responsiveness to the application of fungicide in Dourados is because of the lower rainfall and higher average temperature (Figure 1), which negatively influence grain yield, since they submit wheat to water and temperature stress, reducing the cycle (Table 1) and the grain-filling period. The application of fungicide in low yield environments and where disease-unfavorable factors predominate combined with the use of resistant genotypes, may compromise the economic viability of this practice (Wegulo et al., 2011; Thompson et al., 2014). In a study with a cultivar that was little
affected by leaf rust, Assunção & Torres (2013) also emphasize the need to adopt action thresholds, considering the economic return of this practice and the rational use of fungicides.
The highest gain with fungicide application, 56.9% (Table 3), was observed in Campo Mourão, a municipality that belongs to the Ivaí river basin (SEMA, 2010). Rivers of significant size are present in the territory of the municipality, which, allied with the combination of mild temperatures and moderate rainfall rates (Figure 1), results in ideal relative humidity indexes for the development of pathogens. A similar condition occurs in Castro, located in the Tibagi river basin (SEMA, 2010). In these two sites, wheat is influenced by the highest rainfall accumulations in September and October (Figure 1), submitting crops to conditions predisposed to the occurrence of diseases. In contrast, wheat harvest in Palotina and Dourados is carried out before the rainy season, because of early sowing, resulting in a lower incidence of diseases.
The highest yields and gains with the application of fungicides were found in Castro and Guarapuava, (Table
Table 2: Characterization and clustering of Value for Cultivation and Use trials (VCU) of wheat based on the average of wheat grain
yield (Yield, kg ha-1), selective accuracy for yield (Yield (SA%)), gain due to fungicide application (Gain (%)) and selective accuracy
for gain (SA%)
Statistic(1) Yield (kg ha-1) Yield (SA%) Gain (%) Gain (SA%)
P0.05 2079 63.8 2.5 81.9
P0.95 4687 97.6 100.5 99.4
Average 3380 86.6 36.3 94.4
Freq. (H1) 94% - 100%
-Number of genotypes classified by yield (Yield, kg ha-1) and gain
Classes/classes Yield < 3380 Yield > 3380 Sum Total (%)
Gain < 36.3% 283 230 513 63
Gain > 36.3% 196 107 303 37
Sum 479 (59%) 337 (41%) 816 100
(1)P
3). These sites are located at altitudes higher than 1.000 m (Table 1), submitting the wheat crop to mild temperatures throughout its cycle (Figure 1), which, combined with the greater availability of incident solar radiation, results in a high photothermal coefficient (PC – relationship between solar radiation and temperature) (Cunha et al. 2005; Silva et al. 2014). Sites with high PC allow the elongation of
growth subphases and consequently greater differen-tiation of yield components (Fischer, 1985; Gaju et al. 2009).
The longest grain-filling period at sites with the highest PC also promotes the responsiveness to fungicide application (Barkley et al., 2014). In these regions, due to
favorable conditions for the occurrence of foliar and FHB diseases, control with fungicide is usually more intense, requiring a greater number of applications.
The environmental variability due to the effect of years of cultivation presented an amplitude of variation of 16.9 to 60.7% in the gains in grain yield with the application of fungicide. Pearson’s linear correlation between the grain yield obtained over the years and the respective gain by the application of fungicide is negative (r=-0.70, p < 0.01) (data not shown). This shows us that in years where the occurrence of diseases is high, even with the existence of gains with the application of
fungicide, the grain yield is expressively reduced. The effect of years of cultivation on the occurrence of diseases in wheat, because of environmental variations, is also reported by other authors (Felicio et al. 2004;
Barros et al. 2006; Ransom & McMullen 2008; Wegulo et al. 2011). In this sense, Thompson et al. (2014) suggest
that the phytosanitary management is year/site specific, considering the expected yield potential, prices and predominant climatic conditions.
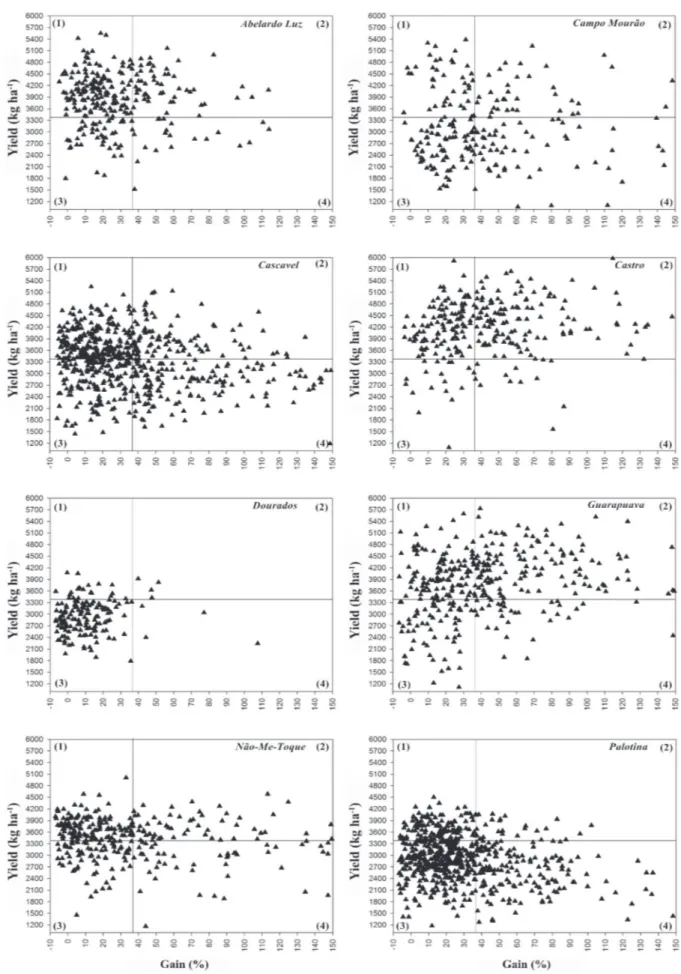
The effect of the cultivation sites on the yield performance and gain with the application of fungicide can be observed in Figure 2. The lines dividing the quadrants were plotted on the overall grain yield mean and the overall average of yield gain with the application of fungicide. In quadrants 1 and 2 are located the genotypes with grain yield above average, with lower and higher gain due the fungicide application, respectively. In quadrants 3 and 4 are located the genotypes with grain yield below the overall average, with lower and higher gain due the fungicide application, respectively. The dot dispersion refers to the genotypes evaluated at each site over the years. It is observed that Dourados and Palotina presented most of the genotypes concentrated in quadrant 3, that is, with yield below the overall average and little
Table 3: Number of genotypes (N), grain yield (Yield, kg ha-1), semi-amplitude of confidence interval for grain yield (YCI, kg ha-1),
gain (%) due to the fungicide application in Value for Cultivation and Use trials (VCU) of wheat, semi-amplitude of confidence interval for gain (GCI%) for test sites and year
N(1) Yield YCI† Gain (%) GCI
Sites of test
Abelardo Luz 550 3806 45 30.2 2.0
Campo Mourão 425 3200 58 56.9 5.2
Cascavel 1500 3324 26 37.4 2.5
Castro 500 4124 67 50.4 3.1
Dourados 375 2811 41 4.3 1.4
Guarapuava 700 3886 48 40.5 2.6
Não-Me-Toque 675 3454 31 47.6 4.3
Palotina 1475 2946 24 27.6 1.3
Average 775 3443.8 42.5 36.86 2.8
Amplitude 375-1500 2811-4124 24-67 4.3–56.9 1.3–5.2
Years of test
2004 500 3163 54 41.4 2.5
2005 450 2579 37 60.7 7.4
2006 475 3315 40 51.0 3.7
2007 550 3400 40 26.0 1.9
2008 900 3688 46 34.8 3.2
2009 625 3027 38 53.3 2.8
2010 950 4006 34 25.1 1.8
2011 950 3267 30 38.1 2.5
2012 800 3306 40 16.9 1.6
Average 689 3306 40 38.58 3.0
Amplitude 450-950 2579-4006 30-54 16.9–60.7 1.6–7.4
responsive to the application of fungicide, due to the limitation of these environments (Figure 1). The low response variability of the genotypes to the application of fungicide is justified itself because these sites showed the lowest grain yields and the lowest gains in productivity with the application of fungicide (Table 3).
We verified in Castro, Guarapuava and Abelardo Luz, a higher concentration of genotypes in quadrants 1 and 2, that is, above the overall yield average and little or high responsive to the application of fungicide, respectively. Thus, in environments that are more favorable to wheat crop, such as Castro, Guarapuava and Abelardo Luz, the breeder has a wide range of variation among genotypes, being able to prioritize the selection of genotypes with high grain yield, with greater resistance to diseases (quadrant 1) or responsive to application of fungicide (quadrant 2). Cascavel, Não-Me-Toque and Campo Mourão present similar characteristics regarding stratification of genotypes, with a higher concentration of genotypes in quadrants 1 and 2, however, allowing the identification of responsive genotypes for fungicide application.
These results indicate that the response of wheat to fungicide application is highly variable since it depends on several factors, such as the incidence and severity of specific leaf diseases, resistance of cultivars, yield potential and environmental conditions. It was observed a great effect of years and growth sites on the yield performance of the wheat crop and responsiveness to the application of fungicide, corroborating with studies conducted by Wegulo et al. (2011), Barkley et al. (2014)
and Thompson et al. (2014). Brancourt-Hulmel et al.
(2005), Loyce et al. (2008, 2012) and Thompson et al. (2014)
also observed the need for local-specific selection and evaluation, to maximize the use of the genotype x environment interaction. In order to maximize and optimize the selection, it is important that the experimental network includes discriminatory sites (that potentiate the differentiation of genotypes) and representative of the region of cultivation.
CONCLUSIONS
The evaluation of the response to fungicide application in the selection of wheat genotypes for yield should be environment-specific and the tests should be carried out in different sites and years to quantify and capitalize the genotype x environment interaction in the selection process.
In the experimental network of wheat breeding programs, there should be sites that maximize and allow the selection of genotypes resistant to diseases and, in addition, responsive to the application of fungicides.
REFERENCES
Assunção M & Torres AL (2013) Eficácia versus viabilidade eco-nômica do controle químico e genético da ferrugem da folha em trigo. Ciência Rural, 43:1141-1146.
Barkley A, Tack J, Nalley LL, Bergtold J, Bowden R & Fritz A (2014) Weather, disease, and wheat breeding effects on Kansas wheat varietal yields, 1985 to 2011. Agronomy Journal, 106:227-235.
Barros BC, Castro JL & Patrício FRA (2006) Resposta de cultiva-res de trigo (Triticum aestivum L.) ao controle químico das
principais doenças fúngicas da cultura. Summa Phytopathologica, 32:239-246.
Brancourt-Hulmel M, Heumez E, Pluchard P, Beghin D, Depatureaux C, Giraud A & Le Gouis J (2005) Indirect versus direct selection of winter wheat for low-input or high-input levels. Crop Science, 45:1427-1431.
Cunha FR, Pires JLF, Pasinato A & Dalmago GA (2005) Variabili-dade temporal e espacial do quociente fototermal no Rio Gran-de do Sul e suas implicações para a expressão do potencial Gran-de rendimento de grãos de trigo. Revista Brasileira de Agro-meteorologia, 13:91-101.
Cruz CD (2013) GENES - a software package for analysis in expe-rimental statistics and quantitative genetics. Acta Scientiarum. Agronomy, 35:271-276.
Del Ponte EM, Fernandes J, Pavan W & Baethgen WE (2009) A model based assessment of the impacts of climate variability on fusarium head blight seasonal risk in Southern Brazil. Journal of Phytopathology, 157:675-681.
Felicio JC, Camargo CEO, Castro JLD & Germani R (2004) Ren-dimento de grãos de trigo e sua relação com as doenças e variá-veis climáticas em Capão Bonito de 1994 a 2001. Bragantia, 63:93-103.
Fischer RA (1985) Number of kernels in wheat crops and the influence of solar radiation and temperature. Journal of Agricultural Science, 105:447-461.
Gaju O, Reynolds MP, Sparkes DL & Foulkes MJ (2009) Relationships between large-spike phenotype, grain number, and yield potential in spring wheat. Crop Science 49:961-973. Goulart ACP, Sousa PG & Urashima AS (2007) Danos em trigo causados pela infecção de Pyricularia grisea. Summa
Phytopathologica, 33:358-363.
Ilbery B, Maye D & Little R (2012) Plant disease risk and grower– agronomist perceptions and relationships: an analysis of the UK potato and wheat sectors. Applied Geography, 34:306-315. Jørgensen LN & Olsen LV (2007) Control of tan spot (Drechslera
tritici-repentis) using cultivar resistance, tillage methods and
fungicides. Crop Protection, 26:1606-1616.
Kurt S (2002) Screening of wheat cultivars for resistance to stripe rust and leaf blotch in Turkey. Crop Protection, 21:495-500. Loyce C, Meynard JM, Bouchard C, Rolland B, Lonnet P, Bataillon
MacLeod A, Pautasso M, Jeger MJ & Haines-Young R (2010) Evolution of the international regulation of plant pests and challenges for future plant health. Food Security, 2:49-70. Ransom JK & McMullen MV (2008) Yield and disease control on
hard winter wheat cultivars with foliar fungicides. Agronomy Journal, 100:1130-1137.
RCBPTT - Reunião da Comissão Brasileira de Pesquisa de Trigo e Triticale (2008) Informações técnicas para a safra 2009: trigo e triticale. Passo Fundo, RCBPTT / Embrapa Trigo / Embrapa Transferência de Tecnologia. 172p.
Resende MDV & Duarte JB (2007) Precisão e controle de qualida-de em experimentos qualida-de avaliação qualida-de cultivares. Pesquisa Agropecuária Tropical, 37:182-194.
Roelfs AP, Singh RP & Saari EE (1992) Rust Diseases of Wheat: Concepts and methods of disease management. Mexico, CIMMYT. 81p.
SEMA (2010) Bacias hidrográficas do Paraná - Série histórica. Curitiba, SEMA. 138p.
Serrago RA, Carretero R, Bancal MO & Miralles DJ (2009) Foliar diseases affect the eco-physiological attributes linked with yield and biomass in wheat (Triticum aestivum L.). European Journal
of Agronomy, 31:195-203.
Serrago RA, Carretero R, Bancal MO & Miralles DJ (2011) Grain weight response to foliar diseases control in wheat (Triticum
aestivum L.). Field Crops Research, 120:352-359.
Silva RR, Benin G, Marchese JA, Silva ÉDBD & Marchioro VS (2014) The use of photothermal quotient and frost risk to identify suitable sowing dates for wheat. Acta Scientiarum. Agronomy, 36:99-110.
Thompson NM, Epplin FM, Edwards JT & Hunger RM (2014) Economics of foliar fungicides for hard red winter wheat in the USA southern Great Plains. Crop Protection, 59:01-06.
Tonin RFB, Reis EM & Danelli ALD (2013) Etiologia e quantificação dos agentes causais de manchas foliares na cultura do trigo nas safras 2008 a 2011. Summa Phytopathologica, 39:102-109.
Tormen NR, Lenz G, Minuzzi SG, Uebel JD, Cezar HS & Balardin RS (2013) Reação de cultivares de trigo à ferrugem da folha e mancha amarela e responsividade a fungicidas. Ciência Rural, 43:239-246.
Wegulo SN, Breathnach JA & Baenziger PS (2009) Effect of growth stage on the relationship between tan spot and spot blotch severity and yield in winter wheat. Crop Protection, 28:696-702.
Wegulo SN, Zwingman MV, Breathnach JA & Baenziger PS (2011) Economic returns from fungicide application to control foliar fungal diseases in winter wheat. Crop Protection, 30:685-692. Zhang YJ, Zhang X, Chen CJ, Zhou MG & Wang HC (2010) Effects of fungicides JS399-19, azoxystrobin, tebuconazole, and
carbendazim on the physiological and biochemical indices and