Food Science and Technology ISSN 0101-2061
DI:
D http://dx.doi.org/10.1590/1678-457X.6642
1 Introduction
As rheological characteristics of wheat dough are generally more reproducible among laboratories, and relate fairly well to end-use functionality, most of the world’s wheat of commerce is traded based upon farinograph, extensigraph and alveograph values rather than to the results of baking test (Duyvejonck et al., 2012; Ferrari et al., 2014). In the case of alveograph (Chopin Technologies, 2000), dough baking strength (W), tenacity (P), extensibility (L), and the balance between them (P/L) are very important for assessing dough rheological properties (Indrani et al., 2007; Codină et al., 2012; Li et al., 2013).
Achieving the demanded standards of dough rheological properties is complex as it is usually influenced by the genotype (G), the environment (E) and the complex interaction of genetic and environmental factors (GEI). The understanding of these effects is essential to help breeders to set proper objectives and strategies to develop wheat genotypes with high yield potential as well as with specific and consistent quality attributes to meet market needs The importance of the effects of G, E and GEI is increasing for breeders, growers, grain traders and end-use processors (Peterson et al., 1998; Souza et al., 2004; Williams et al., 2008).
In addition to the genotypic mean for any trait, the breeder is also interested in its stability, which depends on GEIs. Therefore, an assessment of stability in wheat could permit better genotype characterization (Robert, 2002).
Several stability statistics have been proposed to investigate G, E and GEI effects occurring in METs. They display different aspects of the stability approach, including parametric (e.g. slope of regression on an environmental index), non-parametric (e.g.
rank-sum) and multi-variate methods (e.g. additive main effects and multiplicative interaction analysis) (Lin et al., 1986; Kang, 1988; Zobel et al., 1988). In this study, we were interested in using non-parametric stability statistics (NPSSs) in order to measure stabilities of wheat genotypes for dough properties (i.e. W and P/L). Because NPSSs do not depend on any assumptions about the distribution of phenotypic observations (Huehn, 1996) one can easily estimate the variance or standard deviation of the ranks of a genotype in different environments (Becker & Leon, 1988).
In principal, NPSSs are based on the ranks of genotypes in each environment and genotypes with similar ranking across environments are classified as stable (Becker & Leon, 1988). There are several NPSSs. For instance, Huehn (1996) proposed four nonparametric measures of stability Si(1), S
i (2) S
i (3) and S
i
(6). Ketata
(1988) suggested rank mean (RM) against standard deviation of ranks (RSD). Fox et al. (1990) recommended a nonparametric superiority measure (TDP) for general adaptability. The Rank-Sum (RS) statistic was generated by Kang (1988).
According to the literature, no paper has been published yet in the context of our study. Therefore, we used the aforementioned NPSSs for detecting G, E and GEI effects on alveograph dough properties (i.e. W and P/L) of eighteen wheat genotypes tested across eight years (i.e. environments) in central Turkey.
The objectives of this study were (i) to identify wheat genotypes with high dough quality and stability tested across irrigated environments of Turkey and (ii) to determine the NPSSs suitable for detecting the genotypes with high dough quality and stable.
Non-parametric stability analyses of dough properties in wheat
Yuksel KAYA1*, Mehmet SAHIN1
Received 11 Feb., 2015 Accepted 23 July, 2015
1 Bahri Dagdas International Agricultural Research Institute, Konya, Turkey
*Corresponding author: [email protected]
Abstract
Literature has unveiled that a paper has not been published yet on using non-parametric stability statistics (NPSSs) for evaluating genotypic stability in dough properties of wheat. Accordingly, the effects of genotype (G), environment (E) and GE interaction (GEI) on alveograph parameters, i.e. dough baking strength (W) and its tenacity (P)/extensibility (L), of 18 wheat (T. aestivum L.) genotypes were studied under irrigated field conditions in an 8-year trial (2006-2014) in central Turkey. Furthermore, genotypic stability for W and P/L was determined using 8 NPSSs viz. RM-Rank mean, RSD-Rank’s standard deviation, RS-Rank Sum, TDP-Ranking, Si
(1), S i
(2), S i
(3) and S i
(6) rank statistics. The ANDVA revealed that W and P/L were primarily controlled by E,
although G and GEI also had significant effects. Among the 8 NPSSs, only RM, RS and TDP statistics were suitable for detecting the genotypes with high stable and bread making quality (e.g. G1 and G17). In conclusion, using RM, RS and TDP statistics is advisable to select for dough quality in wheat under multi-environment trials (METs).
Keywords: alveograph; dough; stability; wheat.
2 Materials and methods
2.1 Field trials
A total of 18 genotypes of wheat (T. aestivum L.), composed of 2 breeding lines and 16 registered cultivars from Russia, Bulgaria, Ukraine and National Wheat Breeding Program of Turkey (NWBPT), and International Winter Wheat Improvement Program (International Winter Wheat Improvement Program, 2015), were grown in replicated trials in Konya, central Turkey, (37°52ˈN, 32°29ˈE, 1016 m above sea level), on a hydromorphic alluvial under the conditions of Mediterranean climate, during the 8 consecutive cropping seasons (from 2006 to 2014) (Tables 1 and 2). Field trials designed in completely randomized blocks with four replicates were sown in Dctober and harvested in July each year. Sowing was done with an experimental drill in 1.2 m × 7 m plots, consisting of 6 rows spaced 20 cm apart. The seeding rate was 450 seeds m–2. Fertilizer application was
27 kg N ha–1 and 69 kg P 2D5 ha
–1 at the planting, 70 kg N ha–1
at the stem elongation and 30 kg N ha–1 at the grain filling
stages. Harvesting was done with an experimental combine in 1.2 m × 5 m plots.
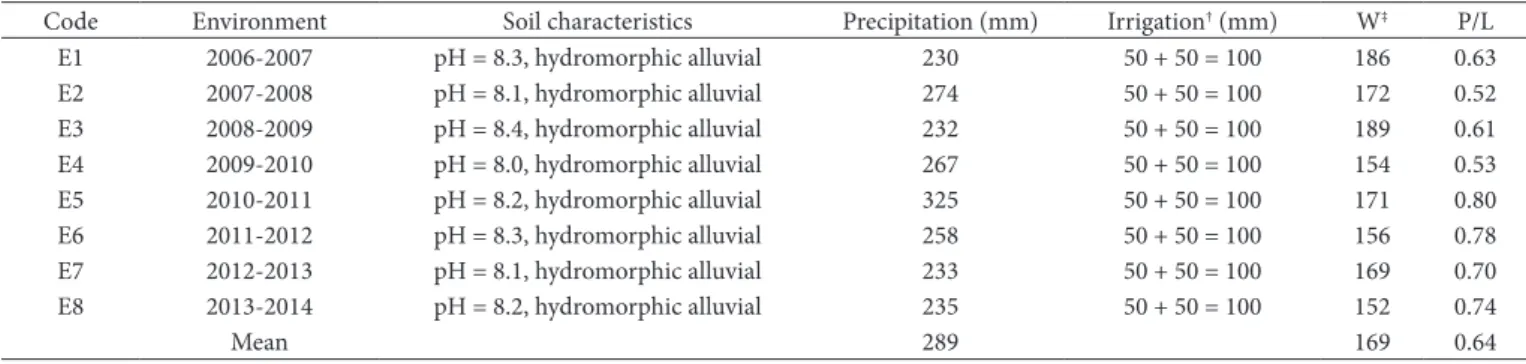
Field trials received an annual precipitation between 230 mm and 325 mm, with long term average of 289 mm (Table 2). In addition, a supplementary irrigation of 100 mm in total (i.e. 50 mm at stem elongation and 50 mm at grain filling stages) was applied to the genotypes studied for each cropping season.
2.2 Milling
Hard, medium-hard and soft wheat grain samples were tempered to around 16%, 15% and 14% moisture content, respectively. All samples were milled by using a Brabender Senior mill (Li et al., 2013).
2.3 Dough test
Dough properties for each genotype were determined by a Chopin MA 82 alveograph using AACC 54-30A method (American Association of Cereal Chemists, 2000). Each alveograph curve (Chopin Technologies, 2000) was analyzed with respect to four parameters: P – dough tenacity (aptitude to resist deformation), L – dough extensibility (maximum volume of air that the bubble is able to contain), P/L – configuration of the curve and W – dough baking strength (surface under the curve) (Bordes et al., 2008; Hadnađev et al., 2011).
2.4 Statistical analysis
Annual data of dough properties (i.e. W and P/L) over the total 8-yr period were subjected to combined analysis of variance (ANDVA) (Table 3). Each year was considered as an individual environment in ANDVA.
NPSSs were done using SAS codes proposed by Hussein et al. (2000) for Si
(3) and S i
(6) (Huehn, 1996), RS (Kang, 1988), and TDP
(Fox et al., 1990) and by Lu (1995) for Si (1) and S
i
(2) (Huehn, 1996).
The other NPSSs, RM and RSD (Ketata, 1988) were estimated using Excel©.
3 Results
3.1 Weather conditions
As it is typical of the Mediterranean climate, quantity and distribution of precipitation were highly variable, but concentrated over the period between the end of autumn and the beginning of spring. Within 8 years of period stated earlier, precipitation (Dctober–July) was varied from 230 to 325 mm (Table 2). Except for the 2010-2011 cropping season, all were characterized by a
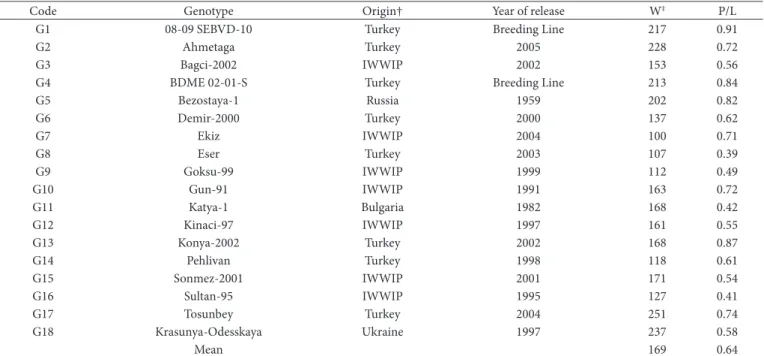
Table 1. Code, origin, year of release, means of dough baking strength (W) and tenacity (P)/extensibility (L) for each genotype.
Code Genotype Drigin† Year of release W‡ P/L
G1 08-09 SEBVD-10 Turkey Breeding Line 217 0.91
G2 Ahmetaga Turkey 2005 228 0.72
G3 Bagci-2002 IWWIP 2002 153 0.56
G4 BDME 02-01-S Turkey Breeding Line 213 0.84
G5 Bezostaya-1 Russia 1959 202 0.82
G6 Demir-2000 Turkey 2000 137 0.62
G7 Ekiz IWWIP 2004 100 0.71
G8 Eser Turkey 2003 107 0.39
G9 Goksu-99 IWWIP 1999 112 0.49
G10 Gun-91 IWWIP 1991 163 0.72
G11 Katya-1 Bulgaria 1982 168 0.42
G12 Kinaci-97 IWWIP 1997 161 0.55
G13 Konya-2002 Turkey 2002 168 0.87
G14 Pehlivan Turkey 1998 118 0.61
G15 Sonmez-2001 IWWIP 2001 171 0.54
G16 Sultan-95 IWWIP 1995 127 0.41
G17 Tosunbey Turkey 2004 251 0.74
G18 Krasunya-Ddesskaya Ukraine 1997 237 0.58
Mean 169 0.64
†IWWIP-International Winter Wheat Improvement Program (International Winter Wheat Improvement Program, 2015). ‡W-Dough baking strength (× 10–4 J),
long drought stress period affecting all the main developmental phases with probably more intense water stress during grain filling, while high temperatures occurred concomitantly with low precipitation. It is likely that the drought occurrence altered the efficiency of supplementary irrigation treatments on field trials. However, this kind of alteration could not be of importance for dough features evaluated in this study, since correlations of annual precipitation amounts across environments with W and P/L values were not significant (r = –0.175NS, r = 0.215NS,
respectively).
3.2 ANOVA and mean comparisons
Table 3 summarized the ANDVA results of G, E and GEI for dough features (i.e. W and P/L) evaluated in the study. Considering the variance sources, both W and P/L were statistically significant (P < 0.01).
Relative contributions of G and E to the total variation were assessed as the percentage of total sum of squares (Table 3). Both W and P/L were sensitive to GEIs. Also, genetic variation was considerably lower for W and P/L, while environmental variation contributed higher to them.
The alveograph characteristics of genotypes showed that W representing the energy necessary to inflate the dough bubble to the point of rupture ranged from 100 × 10−4 J for G7 to
251 × 10−4 J for G17, with mean of 169 × 10−4 J (Table 1). Dn the
other hand, the values for curve configuration ratio, P/L, indicating the ratio of tenacity (P) to extensibility (L) of the dough varied
between 0.39 for G8 and 0.91 for G1. As for dough characteristics obtained from the environments, W ranged from 152 × 10−4 J
for E8 to 189 × 10−4 J for E3 and P/L varied from 0.52 for E2 to
0.80 for E5 (Table 2). It was found that genotype variations for W and P/L were wider than those of the environments.
3.3 Nonparametric stability statistics for dough baking strength (W)
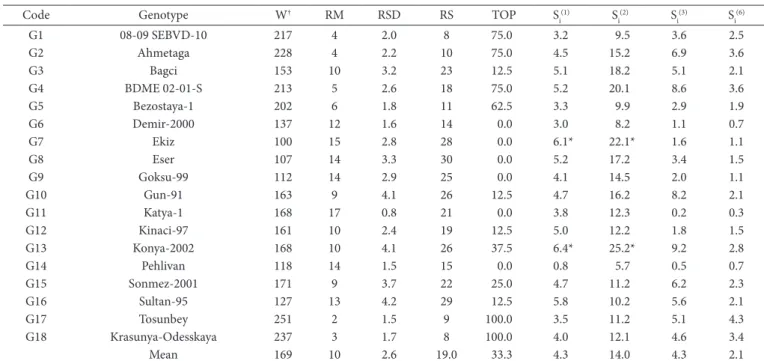
Assessment of the 18 genotypes based on the 8 NPSSs, together with W means, is presented in Table 4. Ketata (1988) proposed two non-parametric methods: rank’s mean (RM) and its standard deviation (RSD). According to RM, genotypes G1, G2, G4, G5, G17 and G18 were the most desirable, because they had lower RM values, whereas genotypes G5, G6, G11, G14, G17 and G18 were the most desirable for RSD (Tables 4). Among them G5, G17 and G18 were the most stable for both NPSSs and also their W values were higher than that of mean genotype (169 × 10−4 J) (Table 4).
Kang’s (1988) rank-sum (RS) statistic uses both W mean and stability variance. The genotypes with the lowest RS are the most favorable ones. According to the RS statistic, G1, G2, G5 G17 and G18 had the lowest values for RS and therefore were the most stable ones (Table 4).
The nonparametric measure of Fox et al. (1990) consists of scoring the percentage of environments in which each genotype ranked in the top (TDP), middle (MID) and bottom (BDT) third of trial entries. A genotype usually found in the top third
Table 2. Code, amounts of precipitation and irrigation, means of dough baking strength (W) and tenacity (P)/extensibility (L) for each environment.
Code Environment Soil characteristics Precipitation (mm) Irrigation† (mm) W‡ P/L
E1 2006-2007 pH = 8.3, hydromorphic alluvial 230 50 + 50 = 100 186 0.63
E2 2007-2008 pH = 8.1, hydromorphic alluvial 274 50 + 50 = 100 172 0.52
E3 2008-2009 pH = 8.4, hydromorphic alluvial 232 50 + 50 = 100 189 0.61
E4 2009-2010 pH = 8.0, hydromorphic alluvial 267 50 + 50 = 100 154 0.53
E5 2010-2011 pH = 8.2, hydromorphic alluvial 325 50 + 50 = 100 171 0.80
E6 2011-2012 pH = 8.3, hydromorphic alluvial 258 50 + 50 = 100 156 0.78
E7 2012-2013 pH = 8.1, hydromorphic alluvial 233 50 + 50 = 100 169 0.70
E8 2013-2014 pH = 8.2, hydromorphic alluvial 235 50 + 50 = 100 152 0.74
Mean 289 169 0.64
†Irrigation was made as 50 mm at stem elongation and 50 mm grain filing stages, respectively. ‡W-Dough baking strength (× 10−4 J), P/L-tenacity (P)/extensibility (L).
Table 3. Combined analyses of variance (ANDVA) for dough baking strength (W) and tenacity (P)/extensibility (L).
Source df W MS (%) P/L MS (%)
SS SS
Environment(E) 7 698,786.54 99,826.65** 58.1 12.34 1.76** 55.6
Replication (E) 24 50,124.79 2,088.53 0.87 0.04
Genotype (G) 17 299,876.23 17,639.78** 24.9 5.88 0.35** 26.5
G × E Interaction 119 203,457.64 1,709.73** 16.9 3.98 0.03** 17.9
Error 408 49,089.45 120.32 0.69 0.01
Total 575 1,301,334.65 100.0 23.76 100.0
CV (%) 4.51 5.41
Mean 169 × 10−4 J 0.64
of entries across environments can be considered relatively well adapted and stable. Thus, G17 and G18 were well adapted genotypes, because they ranked in the top third of genotypes in a highest percentage of environments (TDP = 100%), and were followed by G1, G2, G4 and G5 (TDP > 62.5%) (Table 4).
According to the significance tests for Si(1) and S i
(2) developed
by Huehn (1996), there were no significant differences in rank stability among the genotypes (except G7 and G13) grown in 8 environments (Table 4). G7 and G13, however, were significantly unstable in compare to others. Genotypes with fewer changes in rank are considered to be more stable. The Si(1) estimates are based
on all possible pair-wise rank differences across environments for each genotype, whereas Si(2) is based on variances of ranks
for each genotype across environments (Huehn, 1996). These two statistics are ranked of genotypes similarity for stability. For example, according to both Si(1) and S
i
(2), G1, G5, G6 and G14
had the smallest changes in ranks and therefore, are regarded as the most stable genotypes. However, among the most stable genotypes, G6 and G14 had lower W than that of the average genotype (169 × 10−4 J) (Table 4).
Two other nonparametric statistics of Huehn (1996), Si (3) and
Si
(6) combine W and stability based on W ranks of genotypes in
each environment. These parameters measure stability in units of the mean rank of each genotype. The lowest value for each of these statistics indicates maximum stability for a certain genotype. G6, G11 and G14 were the most stable ones according to the Si(3) and S
i
(6) parameters. Dn the other hand, their W values were
lower than that of the mean genotype (Table 4).
In the context of this study, we were interested in determining the stable genotypes with high W using the NPSSs. Considering
8 NPSSs, only RM, RS and TDP were able to detect the genotypes with higher stability and W value. Consequently, G1, G5, G17 and G18 were determined to be suitable for the objectives of this study.
3.4 Nonparametric stability statistics for dough tenacity (P)/ extensibility (L)
Evaluation of genotype stability for P/L using 8 NPSSs is shown in Table 5. With respect to RM, G1, G4, G5, G14 and G17 were the most stable, while G4, G8, G14 and G17 were the most desirable for RSD. Among them G4, G14 and G17 were the most stable for both NPSSs. As for RS, G1, G4, G14 and G17 had the lowest values and therefore were the most stable ones (Table 5). Dn the other hand, G1 was the most adapted and stable genotype, since it ranked in the top over genotypes tested in the study (TDP = 100%). G4, G13 and G14 were also among the most stable ones (TDP > 75%) (Table 5).
Regarding the significance tests for Si (1) and S
i
(2), solely G6
and G13 were significantly different from the other genotypes tested (Table 5). Based on both Si(1) and S
i
(2), G1, G2, G8 and
G17 were regarded as the most stable genotypes. However, among the most stable ones, G2 and G8 had lower P/L than the mean genotype had (0.64) (Table 5). Dn the other hand G2, G8 and G16 were the most stable genotypes according to the Si
(3) and S i
(6) parameters. But, their P/L values were lower
than that of the mean genotype (Table 5). Taking into account of all NPSSs, the G1, G4 and G17 were identified as desirable genotypes, with higher stable and P/L close to optimum value of 1.0 (Bordes et al., 2008). In conclusion, G1 and G17 were the most desirable genotypes for both W and P/L values.
Table 4. Non-parametric stability statistics for dough baking strength (W).
Code Genotype W† RM RSD RS TDP S
i
(1) S
i
(2) S
i
(3) S
i (6)
G1 08-09 SEBVD-10 217 4 2.0 8 75.0 3.2 9.5 3.6 2.5
G2 Ahmetaga 228 4 2.2 10 75.0 4.5 15.2 6.9 3.6
G3 Bagci 153 10 3.2 23 12.5 5.1 18.2 5.1 2.1
G4 BDME 02-01-S 213 5 2.6 18 75.0 5.2 20.1 8.6 3.6
G5 Bezostaya-1 202 6 1.8 11 62.5 3.3 9.9 2.9 1.9
G6 Demir-2000 137 12 1.6 14 0.0 3.0 8.2 1.1 0.7
G7 Ekiz 100 15 2.8 28 0.0 6.1* 22.1* 1.6 1.1
G8 Eser 107 14 3.3 30 0.0 5.2 17.2 3.4 1.5
G9 Goksu-99 112 14 2.9 25 0.0 4.1 14.5 2.0 1.1
G10 Gun-91 163 9 4.1 26 12.5 4.7 16.2 8.2 2.1
G11 Katya-1 168 17 0.8 21 0.0 3.8 12.3 0.2 0.3
G12 Kinaci-97 161 10 2.4 19 12.5 5.0 12.2 1.8 1.5
G13 Konya-2002 168 10 4.1 26 37.5 6.4* 25.2* 9.2 2.8
G14 Pehlivan 118 14 1.5 15 0.0 0.8 5.7 0.5 0.7
G15 Sonmez-2001 171 9 3.7 22 25.0 4.7 11.2 6.2 2.3
G16 Sultan-95 127 13 4.2 29 12.5 5.8 10.2 5.6 2.1
G17 Tosunbey 251 2 1.5 9 100.0 3.5 11.2 5.1 4.3
G18 Krasunya-Ddesskaya 237 3 1.7 8 100.0 4.0 12.1 4.6 3.4
Mean 169 10 2.6 19.0 33.3 4.3 14.0 4.3 2.1
*Significant at the 0.05 probability level. †Symbols: W-Dough baking strength (× 10−4 J), RM-Rank mean, RSD-Rank’s standard deviation (Ketata, 1988), RS-Rank Sum stability statistic
(Kang, 1988), TDP-Proportion of environments in which a genotype ranked in the top third (Fox et al. 1990), Si (1), S
i (2), S
i (3) and S
i
4 Discussion
Wheat breeders are under perpetual pressure to improve not only, grain yield, but also the industrial milling and baking quality of the grain. The use of alveograph parameters to help truncate populations in the early generations allows breeders to reduce the number of genotypes entering yield testing and favorably increase of the frequency of lines with good grain quality (Trethowan et al., 2001).
According to Mailhot & Patton (1988) P and L of the dough are considered the most important characteristics in the bread-making quality. In general, strong flours are characterized by high P and W and low or medium L values (Dubois et al., 2008). Thus, Bordes et al. (2008) classified wheat genotypes on the basis of alveogram parameters. P/L is commonly used in wheat trade where value of 0.50 indicates either resistant and very extensible dough or moderately extensible less resistant dough. Furthermore, value of 1.50 indicates very strong and moderately extensible dough, whilst raw material with P/L value in the range 0.40-0.80 is suitable for bakery production. Concerning the interpretation of W value for standard quality wheat is characterized by W value in range 160-200 × 10−4 J, whilst good quality wheat and
improving wheat are characterized by W value in the range 220-300 × 10−4 J and higher than 300 × 10−4 J, respectively
(Pagani et al., 2006; Bordes et al., 2008).
Regarding the wheat trade rules declared by Turkish Grain Board (Toprak Mahsulleri Dfisi Genel, 2014), dough properties of wheat for commerce may not be presented, due to the fact that their declaration is not compulsory yet. Furthermore dough features have not been yet accepted as obliged criteria for Turkish Wheat Classification. For this reason we could not classify the
genotypes used in this study regarding dough properties. Dn the other hand, it is obvious that regardless of dough characteristics, classifying wheat may result in a handicap of high quality wheat to be imported by Turkey, since grain of 4.754.682 tons was imported by Turkey in 2011 to meet the domestic demand for the high quality wheat (Food and Agriculture Drganization Corporate Statistical Database, 2012).
According to the wheat cultivar registration procedure in Turkey, dough characteristics, including alveograph parameters, must be proved for comparing the newly developed cultivars with standard counterparts during the official registration trials (DRTs). However, there is no range of dough parameters to classify the newly developed cultivars in use of the evaluation process of registration. Although, DRTs are conducted in multi-environment (year × location combinations) trials (METs), quality analyses are still carried out on data coming from a single environment trial. Therefore, selection efficiency in quality traits would be lower than what we expected, because GEI effects on quality traits are significant (Vázquez et al., 2012; Costa et al., 2013).
The results of this study confirmed the most of the advanced breeding lines and registered cultivars in Turkey having medium quality for alveograph parameters (i.e. W and P/L). There are several reasons why they are inferior in quality. Firstly, only three out of twelve national research institutes dealing with wheat breeding in Turkey have the alveograph instrument to make dough analyses in their quality laboratories. Genotypes tested in various breeding trials could not be well screened for quality traits, especially for dough parameters, because of the lack of laboratory equipment. Secondly, breeding lines selected from IWWIP (International Winter Wheat Improvement Program, 2015) to NWBPT also were low in quality. This was
Table 5. Non-parametric stability statistics for dough tenacity (P)/extensibility (L).
Code Genotype P/L† RM RSD RS TDP S
i
(1) S
i
(2) S
i
(3) S
i (6)
G1 08-09 SEBVD-10 0.91 5 2.4 4 100.0 2.6 5.4 3.8 3.5
G2 Ahmetaga 0.72 12 2.3 16 0.0 1.7 2.2 1.2 0.9
G3 Bagci 0.56 12 5.2 16 12.5 3.1 10 5.5 1.9
G4 BDME 02-01-S 0.84 4 1.8 14 75.0 5.2 18.2 5.4 2.9
G5 Bezostaya-1 0.82 6 4.5 19 50.0 5.7 25.1 8.2 4.1
G6 Demir-2000 0.62 11 5.0 20 50.0 6.5* 31.3* 16.2 4.8
G7 Ekiz 0.71 7 3.7 19 25.0 4.1 10.2 5.4 2.2
G8 Eser 0.39 16 1.6 19 0.0 1.6 2.3 1.1 0.6
G9 Goksu-99 0.49 13 3.7 22 0.0 3.4 9.8 5.1 1.7
G10 Gun-91 0.72 8 3.3 24 50.0 5.1 20.4 9.1 3.3
G11 Katya-1 0.42 13 4.9 30 0.0 4.3 13.2 5.4 2.1
G12 Kinaci-97 0.55 11 5.3 27 25.0 5.1 21.1 11.2 3.1
G13 Konya-2002 0.87 8 6.5 21 75.0 6.9* 34.8* 18.3 5.9
G14 Pehlivan 0.61 6 1.7 14 75.0 4.5 16.2 4.6 3.0
G15 Sonmez-2001 0.54 10 6.1 21 12.5 4.1 12.4 8.7 2.8
G16 Sultan-95 0.41 15 2.5 29 0.0 4.9 21.5 1.6 1.1
G17 Tosunbey 0.74 5 1.7 11 50.0 2.5 4.5 2.3 2.1
G18 Krasunya-Ddesskaya 0.58 11 4.7 16 0.0 3.9 9.9 4.7 2.0
Mean 0.64 10 3.7 19.0 33.3 4.0 14.9 6.5 2.7
*Significant at the 0.05 probability level. †Symbols: P/L-Dough tenacity (P)/extensibility (L), RM-Rank mean, RSD-Rank’s standard deviation (Ketata, 1988), RS-Rank Sum stability statistic (Kang, 1988), TDP-Proportion of environments in which a genotype ranked in the top third (Fox et al., 1990), Si(1), S
i (2), S
i (3) and S
i
not surprising to us, because increasing yield potential is still on the top of breeding priority list of IWWIP. Thirdly, in our breeding program, quality analyses are still being conducted in a single environment (or location or year) trials, but not in METs. Many studies clearly showed that quality traits are under the control of GEIs (Williams et al., 2008; Vázquez et al., 2012; Kaya & Akcura 2014). In advance to genotype selection process in METs for high quality, genotype stability needs to be estimated by using various stability statistics as a preliminary step. Dn the other hand, it is possible to develop the genotypes with high stable and good bread making quality. For instance, G1 and G17, breeding line and registered cultivar originated from NWBPT respectively, were among the most desirable ones, with regard to their stabilities and dough features (i.e. W and P/L).
In this study, we used eight NPSSs, since they have certain advantages with respective to parametric ones (Becker & Leon 1988; Huehn, 1996). Among them, only RM (Ketata, 1988), RS (Kang, 1988) and TDP (Fox et al., 1990) were determined to be suitable for detecting the genotypes with high stable and dough baking quality. Unfortunately, we could not find any paper published in literature in favor of (or against) our findings. Therefore, we did not discuss our findings in the light of previous literature for justification.
5 Conclusions
In this study, we found that GEI was significant for the alveograph parameters (e.g. W and P/L); therefore, the dough analyses should be run in METs. The conclusion for breeders is that if top quality wheat cannot be obtained, it could be due to environmental effects rather than deficiency of the genotype selection. Therefore, in wheat breeding, quality objectives should be set by considering both G, E and GEI effects (Vázquez et al., 2012). In addition, genotypic stability for the alveograph parameters can be determined using the NPSSs such as RM, RS and TDP.
Acknowledgements
This study was supported by the Ministry of Food, Agriculture and Livestock, Republic of Turkey, Project No: TAGEM/ TA/11/07/01/002.
References
American Association of Cereal Chemists – AACC. (2000). Approved
methods of the American Association of Cereal Chemists (10th ed.).
St. Paul: AACC.
Becker, H. C., & Leon, J. (1988). Stability analysis in plant breeding. Plant
Breeding, 101(1), 1-23. http://dx.doi.org/10.1111/j.1439-0523.1988.
tb00261.x.
Bordes, J., Branlard, G., Dury, F. X., Charmet, G., & Balfourier, F. (2008). Agronomic characteristics, grain quality and flour rheology of 372 bread wheats in a worldwide core collection. Journal of Cereal
Science, 48(3), 569-579. http://dx.doi.org/10.1016/j.jcs.2008.05.005.
Chopin Technologies. (2000). Méthodes et équipements pour la maîtrise
característiques des céréales et dérivés. Villeneuve-la-Garenne: Chopin.
Retrieved from http://www.chopin.fr/fr
Codină, G. G., Mironeasa, S., Mironeasa, C., Popa, C. N., & Tamba-Berehoiu, R. (2012). Wheat flour dough Alveograph characteristics
predicted by Mixolab regression models. Journal of the Science of
Food and Agriculture, 92(3), 638-644. http://dx.doi.org/10.1002/
jsfa.4623. PMid:21919003.
Costa, M. S., Scholz, M. B. S., & Franco, C. M. L. (2013). Effect of high and low molecular weight glutenin subunits, and subunits of gliadin on physicochemical parameters of different wheat genotypes.
Food Science and Technology, 33(Suppl. 1), 163-170. http://dx.doi.
org/10.1590/S0101-20612013000500024.
Dubois, M., Dubat, A., & Launay, B. (2008). The alveo consistograph
handbook (2nd ed.). St. Paul: AACC International.
Duyvejonck, A. E., Lagrain, B., Dornez, E., Delcour, J. A., & Courtin, C. M. (2012). Suitability of solvent retention capacity tests to assess the cookie and bread making quality of European wheat flours.
LWT - Food Science and Technology, 47, 56-63.
Ferrari, M. C., Clerici, M. T. P. S., & Chang, Y. K. (2014). A comparative study among methods used for wheat flour analysis and for measurements of gluten properties using the Wheat Gluten Quality Analyser (WGQA). LWT - Food Science and Technology, 34(2), 235-242. http://dx.doi.org/10.1590/fst.2014.0038.
Food and Agriculture Drganization Corporate Statistical Database – FADSTAT. (2012). Rome: FAD. Retrieved from http://faostat.fao.org/. Fox, P. N., Skovmand, B., Thompson, B. K., Braun, H. J., & Cormier, R. (1990). Yield and adaptation of hexaploid spring triticale. Euphytica, 47(1), 57-64. http://dx.doi.org/10.1007/BF00040364.
Hadnađev, T. D., Pojic, M., Hadnadev, M., & Torbica, A. (2011). The Role of empirical rheology in flour quality control. In I. Akyar (Ed.),
Wide spectra of quality control (pp. 335-360). Rijeka: InTech. Retrieved
from http://www.intechopen.com/books/wide-spectra-of-quality-control/the-role-of-empirical-rheology-in-flour-quality-control. Huehn, M. (1996). Non-parametric analysis of genotype x environment
interactions by ranks. In M. S. Kang & H. G. Gauch Jr. (Eds.), Genotype
by environment interaction (pp. 235-271). Boca Raton: CRC Press.
Hussein, M. A., Bjornstad, A., & Aastveit, A. H. (2000). SASG x ESTAB: a SAS program for computing genotype x environment stability statistics. Agronomy Journal, 92(3), 454-459. http://dx.doi. org/10.2134/agronj2000.923454x.
Indrani, D., Manohar, R. S., Rajiv, J., & Rao, G. V. (2007). Alveograph as a tool to assess the quality characteristics of wheat flour for parotta making. Journal of Food Engineering, 78(4), 1202-1206. http://dx.doi. org/10.1016/j.jfoodeng.2005.12.032.
International Winter Wheat Improvement Program – IWWIP. (2015). Ankara: IWWPI. Retrieved from http://www.iwwip.org/.
Kang, M. S. (1988). A rank-sum method for selecting high yielding, stable corn genotypes. Cereal Research Communications, 16, 113-115. Kaya, Y., & Akcura, M. (2014). Effects of genotype and environment on grain yield and quality traits in bread wheat (T. aestivum L.). Food
Science and Technology, 34(2), 386-393. http://dx.doi.org/10.1590/
fst.2014.0041.
Ketata, H. (1988). Genotype × environment interaction. In Proceeding
of the Workshop on Biometrical Techniques for Cereal Breeders.
Aleppo, Syria.
Li, Y., Wu, Y., Hernandez-Espinosa, N., & Peña, R. J. (2013). The influence of drought and heat stress on the expression of end use
quality parameters of common wheat. Journal of Cereal Science,
57(1), 73-78. http://dx.doi.org/10.1016/j.jcs.2012.09.014.
Toprak Mahsulleri Dfisi Genel Müdürlüğü – TMD. (2014). Ankara: TMD. Retrieved from http://www.tmo.gov.tr/Main.aspx?ID=1.
Trethowan, R. M., Pena, R. J., & van Ginkel, M. (2001). The effect of indirect tests for grain quality on the grain yield and industrial quality of bread wheat. Plant Breeding, 120(6), 509-512. http:// dx.doi.org/10.1046/j.1439-0523.2001.00651.x.
Vázquez, D., Berger, A. G., Cuniberti, M., Bainotti, C., Miranda, M. Z., Scheeren, P. L., Jobet, C., Zuniga, J., Cabrera, G., Verges, R., & Pena, R. J. (2012). Influence of cultivar and environment on quality of Latin American wheats. Journal of Cereal Science, 56(2), 196-203. http://dx.doi.org/10.1016/j.jcs.2012.03.004.
Williams, R. M., D’brien, L., Eagles, H. A., Solah, V. A., & Jayasena, V. (2008). The influences of genotype, environment, and genotype × environment interaction on wheat quality. Australian Journal of
Agricultural Research, 59(2), 95-111. http://dx.doi.org/10.1071/
AR07185.
Zobel, W. R., Wright, M. J., & Gauch, H. G. (1988). Statistical analysis of a yield trial. Agronomy Journal, 80(3), 388-393. http://dx.doi. org/10.2134/agronj1988.00021962008000030002x.
Lu, H. S. (1995). PC-SAS Program for estimating Huhn’s nonparametric stability statistics. Agronomy Journal, 87(5), 888-891. http://dx.doi. org/10.2134/agronj1995.00021962008700050018x.
Mailhot, W. C., & Patton, J. C. (1988). Criteria of flour quality. In Y. Pomeranz (Ed.), Wheat: chemistry and technology (Vol. II, pp. 69-90). St. Paul: AACC.
Pagani, M. A., Lucisano, M., & Mariotti, M. (2006). Italian bakery. In Y. H. Hui (Ed.), Bakery products quality and technology (pp. 527-560). Ames: Blackwell Publishing.
Peterson, C. J., Graybosch, R. A., Shelton, D. R., & Baenziger, P. S. (1998). Baking quality of hard winter wheat: response of cultivars to environment in the Great Plains. Euphytica, 100(1-3), 157-162. http://dx.doi.org/10.1023/A:1018361502435.
Robert, N. (2002). Comparison of stability statistics for yield and quality traits in bread wheat. Euphytica, 128(3), 333-341. http:// dx.doi.org/10.1023/A:1021296919225.