Nonparametric stability methods for interpreting genotype by environment
interaction of bread wheat genotypes (
Triticum aestivum
L.)
Mevlut Akcura and Yuksel Kaya
Bahri Dagdas International Agricultural Research Institute, Konya, Turkey.
Abstract
Evaluation of performance stability and high yield is essential for yield trials conducted in different environments. We determined the stability of 10 bread wheat (Triticum aestivum L.) genotypes (5 cultivars and 5 advanced lines) using nonparametric stability measures and compared nonparametric stability statistics across 19 environments in the Central Anatolian Region of Turkey. Experiments were setup in a randomized complete block design with four repli-cations. Nonparametric stability measures revealed that AL-2, Karahan-99 and Altay-2000 were the most stable and well adapted genotypes across the 19 environments. In addition, it was concluded that graphs of mean grain yield (t ha-1
)vs. nonparametric measures (Si(1)
,Si(2)
,S(3)
,Si(6)
andσgy) values and kr vs.σr values could enhance visual effi-ciency of genotype selection based on genotype by environment interaction. Furthermore, highTOP values, Si(3)and
Si(6)
were associated with high grain yield, but the other nonparametric stability measures were not positively corre-lated with grain yield and instead characterized a static concept of stability. Choice of genotype for increased grain yield in bread wheat would, therefore, be expected to change yield stability by increasing the values of theSi
(3)
,Si (6)
andTOP nonparametric stability statistics.
Key words:bread wheat (Triticum aestivumL.), nonparametric stability analysis, yield.
Received: October 5, 2007; Accepted: March 13, 2008.
Introduction
The study of genotype by environment interaction (GEI) has assumed great importance in genotype testing programs because yield performance of a genotype is a re-sult of the interaction between the genotype and environ-ment. Environmental factors, such as rainfall, temperature and soil structure play an important role in genotype perfor-mance, grain yield and quality. Increase of genetic potential for yield is an important objective of bread wheat breeding programs in Turkey.
Genotype by environment interactions are important
sources of variation in any crop, and the termstabilityis
sometimes used to characterize a genotype, which shows a relatively constant yield, independent of changing
environ-mental conditions. On the basis of this idea,genotypes with
a minimal variance for yield across different environments are considered stable. This idea of stability may be consid-ered as a biological or static concept of stability (Becker and Leon, 1988). This concept of stability is not acceptable to most breeders and agronomists, who prefer genotypes with high mean yields and the potential to respond to
agro-nomic inputs or better environmental conditions (Becker, 1981). The high yield performance of released varieties is one of the most important targets of breeders, which ex-plains why they prefer a dynamic concept of stability (Becker and Leon, 1988).
Bread wheat genotypes are generally evaluated in multi-environment trials (MET) to test their performance across environments and to select the best genotypes for specific environments. In most cases, GEI is significant, complicating yield improvement studies, but the release of a genotype with consistent performance over a wide range of environments should lead to stability in production. However, a measure of the relative yield stability of bread wheat genotypes under a wide range of environmental con-ditions is needed for determining the efficiency of a geno-type evaluation program. In light of these considerations a number of statistical procedures have been applied to esti-mate the stability of genotypes and related interactions.
The statistical techniques applied to this type of data can be as follows: linear formulations, like joint-regression (Yates and Cochran, 1938; Eberhart and Russell, 1966); multivariate clustering techniques (Lin and Butler, 1990); multiplicative methods based on additive main effects and
multiplicative interaction (AMMI; Zobel et al., 1988;
Gauch, 1992);or nonparametric methods (Huehn, 1979).
Send correspondence to Mevlut Akcura. Bahri Dagdas Interna-tional Agricultural Research Institute, P.O. Box 125, Konya, Turkey. E-mail: mevlut_akcura@yahoo.com.
Genotype by environment interaction modeled using multi-environment trials can be used to assess phenotypic stability of genotypes, although phenotypic stability is of-ten defined in a variety of ways, with increasing numbers of stability statistics having been developed (Gauch and
Zo-bel, 1996; Sabaghniaet al., 2006).
There are two major approaches to studying genotype by environment interactions and determining the adapta-tion of genotypes (Huehn, 1996). The most common approach is parametric analyses, which are based on statis-tical assumptions about the distribution of genotypic, envi-ronmental and GEI effects. Another approach is nonpara-metric or analytical clustering, which makes no specific modeling assumptions when relating environments and phenotypes relative to biotic and abiotic environmental fac-tors. Parametric measures of phenotypic stability are mostly related to variance components or related statistics. These stability estimates have good properties under cer-tain statistical assumptions, based on the normal distribu-tion of errors and interacdistribu-tion effects, but may not perform well if these assumptions are violated by factors such as the presence of outliners (Huehn, 1990a). Due to the fact that parametric tests for the significance of variances and vari-ancerelated measures can be very sensitive to the underly-ing statistical assumptions an alternative approach is to use techniques such as non-parametric measures that are more robust to departures from the assumptions used in paramet-ric analysis (Adugna and Labuschagne, 2003).
The other approach is to use nonparametric tech-niques, and several procedures have been proposed based on comparing ranks of genotypes in each environment, with genotypes with similar ranking across environments being considered stable (Huehn, 1979; Nassar and Huehn,
1987; Kang, 1988; Ketataet al., 1989; Foxet al., 1990).
The following four nonparametric measures of phenotypic stability have been proposed by Huehn (1979) and Nassar
and Huehn (1987):Si(1), the genotype absolute rank
differ-ence mean as tested over n environments; Si(2), the
be-tween-ranks variance over the n environments; Si(3), the
sum of the absolute deviations of the squares of ranks for
each genotype; andSi(6), the sum of the squares of ranks for
each genotype relative to the mean of ranks. See also
Sabaghnia et al.(2006). It is possible to not only assign
mean yield ranks, with the genotype with the highest yield being ranked 1, but also ranks for the Shukla stability vari-ance (Shukla, 1972) in which the lowest estimated yield value is ranked 1 (Kang 1988), with the sum of these two sets of ranks resulting in an index in which the genotype with lowest rank-sum is considered to be the most desir-able. In addition, a nonparametric superiority measure for general adaptability has been suggested based on stratified ranking of the cultivars in each separate environment, with the proportion of sites at which a specific cultivar occurred
in the top third of the ranks (theTOP value), the middle
third of the ranks (theMIDvalue) and the lower third of the
ranks (theLOWvalue) being calculated, a genotype with a
highTOPvalue (i.e., occurring principally in the top third
of the ranks) being considered as a widely adapted
geno-type (Fox et al., 1990). Nonparametric statistical
proce-dures have several advantages over parametric stability statistics in that they are easy to use and interpret, no as-sumptions are needed regarding the distribution of the observed values, removal or addition of one or several genotypes cause little variation in the results and outlier bias is reduced (Huehn, 1990a).
The objectives of this study were to identify bread wheat genotypes that have both high grain yield and stable performance across different environments for semiarid ar-eas of Turkey and study the relationships between different nonparametric stability statistics.
Materials and Methods
Data source
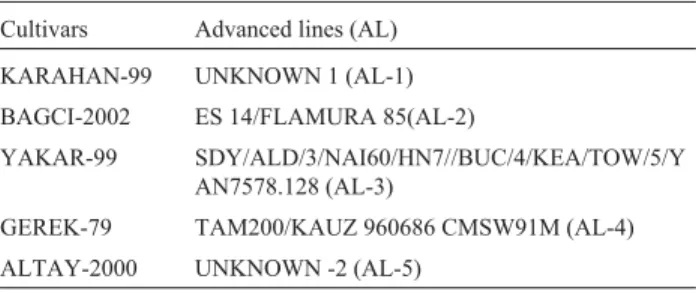
Ten bread wheat (Triticum aestivum L.) genotypes
(Table 1) were evaluated at different sites in Turkey during the 2002/2003 and 2003/2004 growing seasons (Table 2). For both growing seasons the sowing dates ranged from 20 September to 15 October depending on the soil moisture. The total number of environments (site x growing season) was 19, each location in a given year being considered as a separate environment.
Experimental layout was a randomized complete block design with four replications. Sowing was done by an experimental drill in 1.2 m x 7 m plots, consisting of six rows with 20 cm left between the rows. Seeding rate was
550 seeds m-2for all environments. Fertilizer application
was 27 kg N ha-1and 69 kg P2O5ha-1at planting and 40 kg
N ha-1at the stem elongation stage. Harvesting was done in
1.2 m x 5 m plots by experimental combine. Grain yield
(t ha-1) was obtained by converting plot yield to yield per
hectare.
Statistical analysis
We used four sets of nonparametric statistics to esti-mate stability in this study. One of them (Huehn, 1979; Nassar and Huehn, 1987) consisted of four nonparametric
stability statistics (Si(1),Si(2),Si(3)andSi(6)) combining mean
yield and stability (see also Becker and Leon, 1988).
Table 1- Bread wheat genotypes tested in 19 environments.
Cultivars Advanced lines (AL)
KARAHAN-99 UNKNOWN 1 (AL-1)
BAGCI-2002 ES 14/FLAMURA 85(AL-2)
YAKAR-99 SDY/ALD/3/NAI60/HN7//BUC/4/KEA/TOW/5/Y AN7578.128 (AL-3)
GEREK-79 TAM200/KAUZ 960686 CMSW91M (AL-4)
Two-way data withkgenotypes andqenvironments used rij
as the rank of theithgenotype in thejthenvironment andrias
the mean rank across all environments for theithgenotype,
the equations used being as follows:
Si(1), genotype absolute rank difference mean as tested
overnenvironments (Huehn, 1990a)
S
r r
q q i
ij ij
j j q
j q
( )
( )
1
= = ′
−
′= + = −
∑
∑
11 1 1
Si(2), between-ranks variance over n environments
(Huehn, 1990a)
S
r r
q i
ij i j
q
( )
( )
2
=
− ◊
−
• =
∑
21
1
Si(3), sum of the absolute deviations of the squares of
ranks for each genotype (Nassar and Huehn, 1987)
S
r r
r i
ij i j
q
i
( )
* *
*
( )
3
=
− • ◊
= •
∑
21
Si(6), sum of the squares of ranks for each genotype
relative to the mean of ranks (Nassar and Huehn, 1987)
S
r r
r i
ij i j
q
i
( )
* *
*
6 =
− •
= •
∑
1where ◊ rij are ranks of genotypes in each environment
based onXij- (Xi••-X• •),rij*are ranks of genotypes in each
environment based on the mean yields Xij, ri• =
∑
rij q* *
/
andri•=
∑
rij/ .qThe significance tests for theSi(1)andSi(2) statistics
were determined as suggested by Nassar and Huehn (1987).
The chi-square (χ2) values associated with Si(1) and Si(2)
were obtained using the expression χ2
= S Zi(m), where
m= 1, 2,Zi(m)= [Si(m)-E(Sim)]2/V(Sim),E(Si(m)) = expected
value (= mean) ofSi(m), andV(Si(m)) =Si(m)variance. The
sig-nificance test for the null hypothesis that all the genotypes are equally stable was done using a chi-square distribution
withkdegrees of freedom.
Another set of nonparametric stability statistic was
Kang’s (1988) rank-sum (RS), where both yield and
Shukla’s stability variance are the selection criteria, that as-signs a weight of one to both yield and stability, which al-lows identification of high-yielding and stable varieties. In this method, both the highest yielding genotype and the ge-notype with the lowest stability variance are ranked 1 and after ranking all the genotypes the ranks by yield and by sta-bility variance are added for each genotype and the
geno-Table 2- Growing seasons, environments and grain yield for bread wheat genotypes growing at different sites in Turkey.
Seasons Sites Codes Geographic coordinates Grain yield (t ha-1)
Latitude Longitude Altitude (m) Mean* Max Min Range
2002/2003 Eskisehir E1 39°46’33" N 30°31’08" E 795 4.18 4.50 3.64 0.86
Haymana E2 39°18’46" N 32°35’04" E 1236 2.69 3.17 2.14 1.04
Cumra E3 37°34’44" N 32°38’48" E 1024 4.19 4.65 3.71 0.94
Obruk E4 38°02’16" N 33°04’32" E 1036 1.55 1.61 1.32 0.29
Konya E5 37°51’43" N 32°33’31" E 1009 3.33 3.88 2.86 1.02
Eregli E6 37°31’28" N 34°01’29" E 1039 1.93 2.24 1.55 0.69
Usak E7 38°40’18" N 29°24’19" E 915 3.26 3.62 2.79 0.83
Altintas E8 38°43’35" N 29°30’38" E 964 2.47 3.24 2.07 1.17
Sivas E9 39°24’45" N 37°06’35" E 1665 1.92 2.49 1.36 1.13
2003/2004 Eskisehir E10 39°46’33" N 30°31’08" E 795 2.45 2.77 2.25 0.52
Haymana E11 39°18’46" N 32°35’4" E 1236 4.36 5.08 3.21 1.88
Cumra E12 37°34’44" N 32°38’48" E 1024 2.98 3.54 1.96 1.58
Obruk E13 38°02’16" N 33°04’32" E 1036 1.18 1.63 0.80 0.83
Sarayonu E14 38°16’07" N 32°24’23" E 1056 1.63 2.15 1.18 0.97
Kirsehir E15 39°08’49" N 34°09’52" E 997 2.82 3.61 1.99 1.62
Sivas E16 39°24’45" N 37°06’35" E 1665 2.38 3.33 1.73 1.61
Ankara E17 39°56’45" N 32°40’08" E 828 3.51 3.86 3.20 0.66
Afyon E18 38°45’15" N 30°32’35" E 1027 3.59 4.00 3.16 0.84
Esenbel E19 39°01’10" N 31°09’00" E 963 3.81 5.16 3.14 2.03
type with the lowest RS value is considered the most desirable.
We also used the methodology described by Foxet al.
(1990), who proposed a nonparametric superiority measure for general adaptability using stratified ranking of cultivars. Ranking was done at each location separately and the
num-ber of sites at which the cultivar occurred in theTOP,MID,
and LOW third of the ranks was computed. Genotypes
mostly within the top third were considered as widely adapted cultivars.
The last set of nonparametric stability statistic used in
this study included the rank (kr) method, plotting mean
rank across environments against standard deviation (σr) of
ranks for all genotypes, and grain yield (gy), plotting mean
grain yield across environments against standard deviation
(σgy) of yields for all genotypes Ketataet al.(1989). A
ge-notype is considered stable if itskrorgyvalue is relatively
consistent in all the environments.i.e., showing lowkror
highgyand having a lowσr(Floreset al., 1998). Theσr,
calculated from the yield rank of genotypes in each
envi-ronment (rij) based on the uncorrected mean yield values
(Xij), is expressed as
σr r r
q ij i
j q
= −
−
• =
∑
( )2
1 1
Theσgy, calculated from the grain yield of genotypes
in each environment (gyij) based on the uncorrected mean
yield values (Xij), is expressed as
σgy
gy g
q ij i
j q
= −
−
• =
∑
( )2
1 1
All the stability statistics were compared using Spearman’s rank correlation (Steel and Torrie, 1980). The SAS software (SAS Institute, 1999) was used to analyze the results of the nonparametric stability analysis based on the
mean values of yield (t ha-1) obtained over environments.
Lu (1995) developed a SAS-based computer program that
computes the nonparametricSi(1)andSi(2) statistics and a
comprehensive SAS program (SASG x ESTAB) became available which calculates different parametric and
non-parametric stability statistics (Husseinet al., 2000). Both of
these programs were used to calculate different non-parametric stability statistics described in our paper.
Results and Discussion
The overall mean grain yield for all the genotypes
varied between environments ranged from 1.55 t ha-1for
environment 4 to 4.36 t ha-1for environment 11 (Table 2).
Variance analysis for grain yield showed that, genotypes, environments and GEI were significant (data not shown). The significant GEI indicated that the responses of the ge-notypes changed depending on environmental conditions.
Nine stability measures and the mean yield for each genotype over all environments are given in Table 3. The
Si(1)andSi(2)(Nassar and Huehn, 1987) statistics are two
rank stability measures, the Si(1) statistic measuring the
mean absolute rank difference of a genotype over
environ-ments, withSi(1)= 0 for a genotype with maximum stability,
whileSi(2)gives the variance between the ranks over
envi-ronments, with zero variance being an indication of
maxi-mum stability. The exact variance and expectation ofSi(1)
andSi(2)were given by Huehn (1990a). The nonparametric
Si(1)andSi(2)statistics are measures of stability alone and are
strongly correlation with each other even when using the uncorrected yield data, being nearly perfectly correlated with each other if the uncorrected yield data is adjusted for genotypic effects using the corrected values. However, the
values of theSi(1)andSi(2)statistics obtained using the
un-corrected yield data and the un-corrected data are often consid-erably different and show only medium or low correlation
(Huehn, 1990b). TheSi(1)statistic is preferred for practical
applications because it is very easy to calculate and allows a clear and objective interpretation it represents the mean ab-solute rank difference between the environments. Further-more, an efficient test of significance is available for this statistic (Huehn, 1990a).
TheZi(1)andZi(2)values for each genotype were
cal-culated based on the ranks of the corrected data and summed over genotypes to obtain Z values (Table 3), with
the Z1sum of 4.98 and the Z2sum of 4.57 both being less
than the criticalχ2
value (18.31 for n - 1 = 10 environments and p = 0.05) and thus indicating no significant differences in rank stability among the nine genotypes grown in the eleven environments. No genotype was significantly unsta-ble relative any of the other genotypes because they all
showed smallZvalues compared with the criticalχ2
value (6.63 for n - 1 = 1 genotypes and p = 0.01), a significance level of p = 0.01 corresponding to a comparison-wise error rate of about 0.05 (Lu, 1995).
Plots of mean yield (t ha-1) against theSi(1)andSi(2)
values are given in Figures 1 and 2 respectively. MeanSi(1)
andSi(2)values and grand mean yield divide both figures
into four sections, with section 1 containing that
high-yielding genotypes with smallSi(1)andSi(2)values, section 2
containing high-yielding genotypes with largeSi(1)andSi(2)
values, section 3 containing low-yielding genotypes with
largeSi(1) andSi(2) values, and section 4 containing
low-yield genotypes with smallSi(1)andSi(2)values. The
geno-types were distributed in the different sections of Figures 1 and 2 as follows: section 1 contained the Karahan-99, Altay-2000 and AL-2 genotypes, which can be considered to be the most stable and well adapted genotypes in all
envi-ronments (i.e., had general adaptation ability); section 2
Bagci-2002, AL-1 and AL-5 genotypes, which appeared to be poorly adapted in all the environments; and section 4 con-tained the Yakar-99 and AL-4 genotypes, which showed greater resistance to environmental fluctuation and there-fore increasing specificity of adaptability to low-yielding
environments. Regarding the choice between theSi(1)and
Si(2)statistic, Nassar and Huehn (1987) suggest that theS1(1)
statistic should be used in any case in which a genotype shows unusual fluctuations between sections. Prior to any decision to use a genotype in a specific environment it is crucial to be aware of the ranking of the genotypes in each
environment, with Figure 1 [mean yield (t ha-1) againstSi(1)]
and Figure 2 [mean yield (t ha-1) againstSi(2)], which show
high concordance, providing a means to achieve this. For example, the Karahan-99, AL-2 and Altay-2000 genotypes were most stable and well adapted across environments (Figure 1 and 2) but Karahan-99 had the higher mean rank and AL-2 the lower, so Karahan-99 should be selected in preference to AL-2 on account of the fact that Karahan-99 has higher yield across environments than AL-2.
Two other nonparametric statistics, described by
Huehn (1979),Si(3)andSi(6)(Figures 3 and 4) combine yield
and stability based on the yield ranks of genotypes in each environment. These statistics measure stability in units of the mean rank of each genotype, described in more detail in the original paper by Huehn (1979), with the lowest value for each of these statistics indicating maximum stability for
a certain genotype. For example, theSi(1)andSi(2)statistics
showed that AL-2 was the most stable genotype, although
Figure 1- Plot of the mean absolute rank difference of a genotype over
en-vironments (Si(1)) against mean grain yield (gy, t ha-1) for 10 bread wheat
genotypes over environments.
Figure 2- Plot of the variance between the ranks over environments (Si(2))
against mean grain yield (gy, t ha-1) for 10 bread wheat genotypes over
en-vironments. Table 3 -Mean grain yield ( gy ) and four sets of nonparametric stability statistics (see Key) for grain yield of five cultivars and five advanced lines (AL) evaluated in 19 environm ents. Genotypes gy (t ha -1)* Nonparametric statistical methods Ketata et al. (1989) Nassar and Huehn (1987) Kang (1988) RS Fox et al. (1990) TOP σ gy kr σ r Si ( 1 ) Z1 Si ( 2 ) Z2 Si ( 3 ) Si ( 6 ) Karahan-99 3.13 0.94 3.26 2.72 3.15 0.17 7.32 0.27 27.75 12.07 10 78.95 Bagci-2002 2.71 0.98 6.84 2.22 3.60 0.66 9.36 0.39 13.00 5.53 13 10.53 Yakar-99 2.75 1.04 6.79 2.27 3.42 0.10 8.45 0.01 12.86 5.36 9 5.26 Gerek-79 2.86 0.83 5.42 3.06 3.70 1.13 10.16 1.15 33.83 10.15 15 36.84 Altay-2000 2.90 0.94 5.89 2.31 3.32 0.00 8.11 0.01 19.31 6.61 8 26.32 AL-1 2.59 0.83 7.58 2.20 3.54 0.43 9.16 0.26 9.78 3.86 15 5.26 AL-2 3.12 1.03 3.11 1.41 2.99 0.67 6.56 0.90 13.68 7.81 3 68.42 AL-3 3.10 1.05 3.79 2.43 3.75 1.48 10.27 1.29 28.26 9.89 11 63.16 AL-4 2.71 0.94 7.21 2.03 3.18 0.10 7.49 0.18 9.82 4.27 9 0.00 AL-5 2.57 1.01 8.00 2.60 3.49 0.25 8.82 0.10 15.25 5.52 17 5.26 Sum 2.84 0.96 5.79 2.33 3.41 4.98 8.41 4.57 18.35 7.11 *Least significant difference = 0.18, p = 0.01. Test statistics for ( Si ( 1 )), (S i ( 2 )) Grand mean (t ha -1)E ( Si ( 1 )) E( Si ( 2 )) Var( Si ( 1 )) Var( Si ( 2 )) χ 2Z (1),Z (2) χ 2sum Z (1),Z (2) 2.84 3.41 8.41 0.14 3.18 7.88 18.31 Key: mean grain yield ( gy ); standard deviation of grain yield ( σ gy ); rank ( kr ); rank standard deviation ( σ r ); genotype absolute rank difference mean over n environments ( Si ( 1 )); between-ranks variance over the n environments ( Si ( 2 )); sum of the absolute deviations of the squares of ranks for each genotype ( Si ( 3 )); the sum of the squares of ranks for each genotype relative to the mean of ranks ( Si ( 6 )); Kang’s rank-sum ( RS ); number of sites at which the cultivar occurred in the top third of the ranks ( TOP ). The Z-statistic is a measure of stability calculated as the chi-square ( χ 2) values associated with Si ( 1 )and Si ( 2 )and calculated as χ 2( Z )= SZ i ( m
),wher
em=1 ,2 , Zi ( m )=[ Si ( m ) -E ( Si m)]
2/V
( Si m); E ( Si ( m )) = expected value (= mean) of Si ( m
);and
this was supported by theSi(3)statistic, but theSi(6)statistic
indicated that Altay-2000 was the most stable genotype. The mean yield of the AL-2 genotype was relatively high, but the mean yield of Altay-2000 was relatively low (Table 3).
Kang’s (1988) nonparametric stability statistic (RS)
uses both yield and stability variance (Shukla, 1972), with the genotype having the lowest rank-sum being the most fa-vorable. In our study, the AL-2 genotype had the minimum
RSvalue and was, therefore, the most stable genotype,
fol-lowed by the Altay-2000, Yakar-99 and AL-4 genotypes
(Table 3). TheRSstatistic also indicated AL-1, AL-5 and
Gerek-79 were the most undesirable genotypes (Table 3).
According to Fox et al. (1990) a genotype usually
found in the top third of entries across environments can be considered relatively well adapted and stable. Thus, in our study, the most stable genotype was Karahan-99 because it ranked in the top third of genotypes in a high percentage of
environments (i.e., had a highTOPvalue), followed by the
AL-2 and AL-3 genotypes, with the least-desirable
geno-types being AL-4, Yakar-99, AL-5 and AL-1 (Table 3).
Ketata et al. (1989) proposed using two
nonpara-metric methods, one based on ranking and the other on
grain yield. In the ranking method the rank (kr) and the
standard deviation of ranks (σr) is used, with the high
yield-ing (3.12 t ha-1) and stable AL-2 genotype being in section 1
while the low yielding (2.57 t ha-1to 2.75 t ha-1) and stable
Altay-2000, Bagci-2002, Yakar-99, AL-1 and AL-4
geno-types are in section 2 (Figure 5). In contrast to the general adaptability of genotypes in sections 1 and 2, the genotypes in sections 3 and 4 lacked stable yield performance but, their average yield was not low and when single environ-ments were considered even extremely high. These geno-types (Karahan-99, Gerek-79 and AL-3) had rank values
lower than the meankrvalue and hadσrgreater than the
mean (Table 3) and appeared to be sensitive to environmen-tal changes. In fact, the Karahan-99 and AL-3 genotypes gave higher grain yields than the overall mean and could be recommended for cultivation in favorable environments, whereas Gerek-79, which also produced almost average
grain yield, hadkrandσrvalues close to the mean and
ex-hibited less sensitivity to environmental changes based on these nonparametric stability statistics (Figure 5).
Geno-type AL-5 in section 4 of Figure 5 showed akrvalue greater
than the meankrandgybelow the overall mean (Table 3),
and was relatively better adapted to poor environments and insensitive to environmental changes. The results for the
grain yield gy and grain yield standard deviation (σgy)
method are presented in Figure 6, from which it can be seen
that Karahan-99 (3.13 t ha-1), Altay-2000 (2.90 t ha-1) and
Gerek-79 (2.86 t ha-1) were all high yielding genotypes with
stability appearing section 2. In section 4 genotypes AL-2
(3.12 t ha-1) and AL-3 (3.10 t ha-1) had highergythan the
mean and theirσgyvalues were close to the mean (0.96),
with the highgyand lowσgyvalues indicating that these
genotypes could be considered stable.
The relationship between the four different sets of stability statistics
We found significant positive rank correlations
be-tweengyand the nonparametricSi(3),Si(6)andTOPstatistics
(Table 4), supporting the findings of Becker and Leon
(1988) who also reported high rank correlations betweengy
and theSi(3)andSi(6)statistics. Selection for increased grain
yield in bread wheat would, therefore, be expected to
change grain yield stability by increasing theSi(3),Si(6)and
TOPstability statistics. This would lead to the development
of genotypes specifically adapted to environments with op-timal growing conditions. Such genotypes would be less than optimal in yield performance when cultivated in poor
Figure 3- Plot of the sum of the absolute deviations of the squares of ranks
for each genotype (Si(3)) against mean grain yield (gy, t ha-1) for 10 bread
wheat genotypes over environments.
Figure 4- Plot of the sum of the squares of ranks for each genotype
rela-tive to the mean of ranks (Si(6)) against mean grain yield (gy, t ha-1) for 10
bread wheat genotypes over environments.
Figure 5- Plot of the rank standard deviation (σr) against the rank (kr) for
environments though they could give maximum yields when cultivated in optimal environments. On the other
hand, a significantly negative rank correlation betweengy
andkrwas found. Furthermore, there were significant
posi-tive correlation betweenSi(2)andRSbetweenSi(3)andSi(6)
TOPwithσrand also between the Si(6) andTOP andσr
nonparametric stability statistics. In addition, there were
significant negative rank correlations betweenkr andgy,
Si(3),Si(6)andTOP(Table 4).
The Si(1), Si(2) and RS stability statistics were
posi-tively and significantly correlated and, indicated that the three measures were similar in classifying the genotypes according to their stability under different environmental
conditions.Scapim et al.(2000) also found significantly
positive correlations between theSi(1), Si(2) andSi(3)
non-parametric statistics. Similarly, Flores et al. (1998)
re-ported high rank correlations betweenSi(1)andSi(2)in faba
bean(Vicia fabaL.) and pea (Pisum sativumL.). Conse-quently, only one of these statistics would be sufficient to select the stable genotypes in a breeding program.
Nonparametric stability measurements seem to be
use-ful alternatives to parametric measurements (Yue et al.,
1997), although they do not supply information about geno-type adaptability. In fact, there are several reasons to prefer nonparametric stability models, one being that outlier bias is avoided and no assumptions are needed about the distribu-tion of the data and the second is that nonparametric statistics are easy to use and to interpret. Based on these consider-ations, it appears that the estimation of stability is an appro-priate approach for GEI analysis, this view being supported by the fact that a variety of parametric and nonparametric stability measures have been compared in the literature (Lin et al, 1986; Floreset al., 1998; Sabaghniaet al., 2006).
Our study indicates that the nonparametric statistics
Si(1),Si(2),Si(3),Si(6)pluskr,σrandσgyvalues together with
ranks can be recommended for estimating the nonpara-metric stability statistics of genotypes grown in different environments. These statistics can be used by breeders and agronomists who need to make selection based upon geno-type x environment interactions. In addition, there were
significant positive rank correlations betweengyandTOP,
Si(3)andSi(6), indicating that selection for increased grain
yield in bread wheat would therefore be expected to change
grain yield stability by increasing theSi(3),Si(6) andTOP
nonparametric stability statistics. Furthermore, the plots
re-lating mean grain yield (gy, t ha-1) against the
nonpara-metricSi(1),Si(2),Si(3),Si(6)andσgystatistics andkragainst
σrvalues could enhance the visual efficiency of selection
based on GEI.
References
Adugna W and Labuschagne MT (2003) Parametric and nonparametric measures of phenotypic stability in linseed (Linum usitatissimumL.). Euphytica 129:211-218. Becker HC (1981) Correlations among some statistical measures
of phenotypic stability. Euphytica 30:835-840.
Becker HC and Leon J (1988) Stability analysis in plant breeding. Plant Breed 101:1-23.
Table 4- Spearman’s rank correlation coefficients between the different nonparametric stability parameters for grain yield of 10 bread wheat genotypes.
parameters gy σgy Si(1) Si(2) Si(3) Si(6) RS TOP kr
σgy 0.37
Si(1) -0.31 0.01
Si(2) -0.31 0.01 1.00**
Si(3) 0.59* -0.19 0.27 0.27
Si (6)
0.82** -0.21 0.02 0.02 0.90**
RS -0.54 -0.22 0.71** 0.71** 0.18 -0.04
TOP 0.94** -0.29 0.13 -0.13 0.67** 0.89** -0.24
kr -0.98** -0.33 0.26 0.26 -0.59* -0.82** 0.55 -0.90**
σr 0.19 -0.02 0.39 0.39 0.79** 0.61* 0.49 0.35 0.31
* Significant at p = 0.05 probability; ** Significant at p = 0.01.
Key: mean grain yield (gy); standard deviation of grain yield (σgy); rank standard deviation (σr); genotype absolute rank difference mean overn environ-ments (Si(1)); between-ranks variance over thenenvironments (Si(2)); sum of the absolute deviations of the squares of ranks for each genotype (Si(3)); the
sum of the squares of ranks for each genotype relative to the mean of ranks (Si(6)); Kang’s rank-sum (RS); number of sites at which the cultivar occurred in
the top third of the ranks (TOP); rank (kr).
Figure 6- Plot of the standard deviation of grain yield (σgy) against the
mean grain yield (gy, t ha-1) for 10 bread wheat genotypes over
Eberhart SA and Russell WA (1966) Stability parameters for comparing varieties. Crop Sci 6:36-40.
Flores E, Moreno MT and Cubero JI (1998) A comparison of univariate and multivariate methods to analyze environ-ments. Field Crops Res 56:271-286.
Fox PN, Skovmand B, Thompson BK, Braun HJ and Cormier R (1990) Yield and adaptation of hexaploid spring triticale. Euphytica 47:57-64.
Gauch HG (1992) Statistical Analysis of Regional Yield Trials. Elsevier, Amsterdam, 278 pp.
Gauch HG and Zobel RW (1996) AMMI analysis of yield trials. In: Kang MS and Gauch HG (eds) Genotype by Environ-ment Interaction. CRC Press, Boca Raton, pp 85-122. Hildebrand PE (1990) Modified stability analysis and on-farm
re-search to breed specific adaptability for ecological diversity. In: Kang MS (ed) Genotype-By-Environment Interaction and Plant Breeding. Louisana State, Baton Rouge, pp 169-180.
Huehn M (1990a) Nonparametric measures of phenotypic stabil-ity: I. Theory. Euphytica 47:189-194.
Huehn M (1990b) Nonparametric measures of phenotypic stabil-ity: II. Applications. Euphytica 47:195-201.
Huehn M (1996) Non-parametric analysis of genotype x environ-ment interactions by ranks. In: Kang MS and Gauch HG (eds) Genotype by Environment Interaction. CRC Press, Boca Raton, pp 213-228.
Huehn VM (1979) Beiträge zur Erfassung der phänotypischen Stabilität. EDV Med Biol 10:112-117.
Hussein MA, Bjornstad A and Aastveit AH (2000) SASG x ESTAB: A SAS program for computing genotype x envi-ronment stability statistics. Agron J 92:454-459.
Kang MS (1988) A rank-sum method for selecting high-yielding, stable corn genotypes. Cereal Res Comm 16:113-115. Ketata HY and Yau SK Nachit M (1989) Relative consistency
performance across environments. International Symposium on Physiology and Breeding of Winter Cereals for stressed Mediterranean Environments, Montpellier, pp 391-400.
Lin CS and Butler G (1990) Cluster analyses for analyzing two-way classification data. Agron J 82:344-348.
Lin CS, Binns MR and Lefkovitch LP (1986) Stability analysis. where do we stand? Crop Sci 26:894-900.
Lu HS (1995) PC-SAS Program for estimating Huhn’s non-parametric stability statistics. Agron J 87:888-891. Nassar R and Huehn M (1987) Studies on estimation of
pheno-typic stability: Tests of significance for nonparametric mea-sures of phenotypic stability. Biometrics 43:45-53. Sabaghnia N, Dehghani H and Sabaghpour SH (2006)
Non-parametric methods for interpreting genotype x environment interaction of lentil genotypes. Crop Sci 46:1100-1106. SAS Institute (1999) SAS/STAT User’s Guide. 2nd edition. SAS
Institute Inc., Cary.
Scapim CA, Oliveira VR, Braccinil AL, Cruz CD, Andrade CAB and Vidigal MCG (2000) Yield stability in maize(Zea mays L.) and correlations among the parameters of the Eberhart and Russell, Lin and Binns and Huehn models. Genet Mol Biol 23:387-393.
Shukla GK (1972) Some aspects of partitioning genotype-envi-ronmental components of variability. Heredity 28:237-245. Steel RGD and Torrie JH (1980) Principles and Procedures of Sta-tistics, a Biometrical Approach. 2nd edition. McGraw-Hill, New York, 633 pp.
Yates E and Cochran WG (1938) The analysis of groups of experi-ments. J Agric Sci 28:556-580.
Yue GL, Roozeboom KL, Schapaugh WT and Liang GH (1997) Evaluation of soybean cultivars using parametric and non-parametric stability estimates. Plant Breed 116:271-275. Zobel RW, Wright MJ and Gauch HG (1988) Statistical analysis
of a yield trial. Agron J 80:388-393.
Senior Editor: Ernesto Paterniani