eISBN: 978-1-60805-295-0 ISBN: 978- 1 -60805-504-3
Single and Two-Phase
Flows on Chemical and
Biomedical Engineering
Editors
Ricardo Dias
&
Rui LimaBragança Polytechnic (ESTiG) Portugal
Antonio A. Martins
&
Teresa M. Mata University of Porto (FEUP)Portugal
Bentham
C?/
Books
---Single and Two-Phase Flows on Chemical
and Biomedical Engineering
Editors
Ricardo Dias
Department of Chemical and Biological Technology, ESTiG, Braganca Polytechnic, C. Sta. Apolonia, 5301-857
Bragança, Portugal
CEFT - Transport Phenomena Research Center, Faculty of Engineering, University of Porto (FEUP), Rua Dr. Roberto Frias, s/n, 4200-465 Porto Portugal
Antonio A. Martins
CEFT-Transport Phenomena Research Center, Faculty of Engineering, University of Porto (FEUP) Rua Dr. Roberto Frias, s/n, 4200-465 Porto, Portugal
Rui Lima
Department of Mechanical Technology, ESTiG, Braganca Polytechnic, C. Sta. Apolonia, 5301-857
Bragança, Portugal
CEFT - Transport Phenomena Research Center Faculty of Engineering, University of Porto (FEUP) Rua Dr. Roberto Frias, s/n, 4200-465 Porto, Portugal
eBooks End User License Agreement
Please read this license agreement carefully before using this eBook. Your use of this eBook/chapter constitutes your agreement to the terms and conditions set forth in this License Agreement. Bentham Science Publishers agrees to grant the user of this eBook/chapter, a non-exclusive, nontransferable license to download and use this eBook/chapter under the following terms and conditions:
1. This eBook/chapter may be downloaded and used by one user on one computer. The user may make one back-up copy of this publication to avoid losing it. The user may not give copies of this publication to others, or make it available for others to copy or download. For a multi-user license contact [email protected]
2. All rights reserved: All content in this publication is copyrighted and Bentham Science Publishers own the copyright. You may not copy, reproduce, modify, remove, delete, augment, add to, publish, transmit, sell, resell, create derivative works from, or in any way exploit any of this publication’s content, in any form by any means, in whole or in part, without the prior written permission from Bentham Science Publishers.
3. The user may print one or more copies/pages of this eBook/chapter for their personal use. The user may not print pages from this eBook/chapter or the entire printed eBook/chapter for general distribution, for promotion, for creating new works, or for resale. Specific permission must be obtained from the publisher for such requirements. Requests must be sent to the permissions department at E-mail: [email protected]
4. The unauthorized use or distribution of copyrighted or other proprietary content is illegal and could subject the purchaser to substantial money damages. The purchaser will be liable for any damage resulting from misuse of this publication or any violation of this License Agreement, including any infringement of copyrights or proprietary rights.
Warranty Disclaimer: The publisher does not guarantee that the information in this publication is error-free, or warrants that it will meet the users’ requirements or that the operation of the publication will be uninterrupted or error-free. This publication is provided "as is" without warranty of any kind, either express or implied or statutory, including, without limitation, implied warranties of merchantability and fitness for a particular purpose. The entire risk as to the results and performance of this publication is assumed by the user. In no event will the publisher be liable for any damages, including, without limitation, incidental and consequential damages and damages for lost data or profits arising out of the use or inability to use the publication. The entire liability of the publisher shall be limited to the amount actually paid by the user for the eBook or eBook license agreement.
Limitation of Liability: Under no circumstances shall Bentham Science Publishers, its staff, editors and authors, be liable for any special or consequential damages that result from the use of, or the inability to use, the materials in this site.
eBook Product Disclaimer: No responsibility is assumed by Bentham Science Publishers, its staff or members of the editorial board for any injury and/or damage to persons or property as a matter of products liability, negligence or otherwise, or from any use or operation of any methods, products instruction, advertisements or ideas contained in the publication purchased or read by the user(s). Any dispute will be governed exclusively by the laws of the U.A.E. and will be settled exclusively by the competent Court at the city of Dubai, U.A.E.
You (the user) acknowledge that you have read this Agreement, and agree to be bound by its terms and conditions. Permission for Use of Material and Reproduction
Photocopying Information for Users Outside the USA: Bentham Science Publishers grants authorization for individuals to photocopy copyright material for private research use, on the sole basis that requests for such use are referred directly to the requestor's local Reproduction Rights Organization (RRO). The copyright fee is US $25.00 per copy per article exclusive of any charge or fee levied. In order to contact your local RRO, please contact the International Federation of Reproduction Rights Organisations (IFRRO), Rue du Prince Royal 87, B-I050 Brussels, Belgium; Tel: +32 2 551 08 99; Fax: +32 2 551 08 95; E-mail: [email protected]; url: www.ifrro.org This authorization does not extend to any other kind of copying by any means, in any form, and for any purpose other than private research use.
CONTENTS
Foreword i
Preface ii
List of Contributors iii
Acknowledgements xii
Part I: Single Phase Flows on Chemical Enginnering
1. Spacims-Probing the Internal Behaviour of 3D Structured
Materials 3
Jacinto Sá, Cristina-Elena Stere and Alexandre Goguet
2. Modelling of a Monolithic Reverse Flow Reactor for Selective Catalytic Reduction of NO by Ammonia 26
Emilio Muñoz, David Lesser, Pablo Marín, Salvador Ordóñez and Fernando V. Díez
3. Mesoscopic Simulation of Rarefied Gas Flow in Porous Media 52
Alexandros N. Kalarakis, Eugene D. Skouras and Vasilis N. Burganos
4. Mixing Through Half a Century of Chemical Engineering 79
Ricardo J. Santos, Madalena M. Dias and José Carlos B. Lopes
5. Application of the Probability Density Function Method to Turbulent Mixing with Chemical Reaction 113
Andrei Chorny
6. Activated Sludge Models Coupled to CFD Simulations 153
7. Using CFD to Estimate External Mass Transfer Coefficients and Intra-Particle Diffusional Effects on the Supercritical
Hydrogenation of Sunflower Oil 174
A. Guardo, E. Ramírez, M.A. Larrayoz and F. Recasens
8. Mass Transfer Around a Single Soluble Solid with Different Shapes Buried in a Packed Bed and Exposed to Fluid Flow 196
J.M.P.Q. Delgado
9. Advances on Viscoelastic Fluid Flow Simulation 233
Jovani L. Favero, Argimiro R. Secchi, Nilo S. M. Cardozo and Hrvoje Jasak
10. Tree-Shaped Flow Structures Viewed from the Constructal
Theory Perspective 266
António F. Miguel
11. Determination of Effective Transport Properties of Metallic
Foams: Morphology and Flow Laws 292
J. Vicente, E. Brun, J.M. Hugo, J.P. Bonnet and F. Topin
Part II: Two Phase Flows on Chemical Enginnering
12. Flow Visualization in Gas-Solid Packed Beds by Spatially
Resolved Near-Infrared Imaging 332
Aiouache Farid, Nic An tSaoir Méabh and Luis Abreu Fernandes Daniel
13. Interfacial Area Modelling in Two-Phase Flow Studies 361
Christophe Morel
14. Mass Transfer Models for Oxygen-Water Co-Current flow in
Vertical Bubble Columns 386
15. Characterization of Turbulence and Flow Regimes in Bubble Columns Based on Nonlinear Chaos Analysis of Various Data 412
Stoyan Nedeltchev
16. Characterization and Modeling of Flotation Processes 440
G.G. Kagramanov and V.A. Kolesnikov
Part III: Single and Two Phase Flows on Biomedical Enginnering 17. Pulse Wave Propagation in Large Blood Vessels Based on
Fluid-Solid Interactions Methods 460
Tomohiro Fukui, Kim H. Parker and Takami Yamaguchi
18. An-Harmonic Modeling of the Peripheral Distortion of the
Arterial Pulse 472
Panagiotes A. Voltairas, D.I. Fotiadis, A. Charalambopoulos and L.K. Michalis
19. Numerical Analysis of Blood Flow in Stenosed Channels 489
Stéphanie Ferreira, Ricardo P. Dias, Carlos Balsa and Carla S. Fernandes
20. Blood Flow Behavior in Microchannels: Past, Current and Future
Trends 513
R. Lima, T. Ishikawa, Y. Imai and T. Yamaguchi
21. A Survey of Microchannel Geometries for Mixing of Species in
Biomicrofluidics 548
Francesco Pennella, Francesco Mastrangelo, Diego Gallo, Diana Massai, Marco A. Deriu, Giuseppe Falvo D'Urso Labate, Cristina Bignardi, Franco Montevecchi and Umberto Morbiducci
22. Endothelial Cell Responses to Fluid Shear Stress: From
Methodology to Applications 579
23. Micro-Flow Visualization of Magnetic Nanoparticles for
Biomedical Applications 600
R. Lima, R.J. Joseyphus, T. Ishikawa, Y. Imai and T. Yamaguchi
24. A Computational Study on the Possibility of the Initialization And Development of Intracranial Aneurysms Considering Biofluid and
Biosolid Mechanics 613
Yixiang Feng, Shigeo Wada and Takami Yamaguchi
i
FOREWORD
I am delighted to write the Foreword for this book, which captures the recent advances in both analytical and experimental techniques of describing accurately the single and multiphase flow phenomena in chemical engineering practice and biomedical systems. In the chemical engineering arena, there is an interesting combination of chapters covering both fundamental and other applied studies. Fundamental studies focus on a wide variety of topics such as simulation of rarefied gas flow in porous media, mass transfer for soluble solids in a packed bed, tree shaped flow structures and constructal theory, interfacial area modeling in two-phase flows, etc. Other studies address the environmental topics of NOx abatement by selective catalytic reduction of NO by ammonia, and modeling of waste water treatment by combining CFD simulation with activated sludge models. Other CFD studies on chemical engineering side include super critical hydrogenation of edible oil and simulation of a viscoelastic fluid. Important area of mixing is covered by two articles, one dealing with the evolution of mixing science and its impact on chemical engineering, and the other dealing with a specific topic of turbulent mixing with chemical reaction. There are some interesting experimental studies reporting work on bubble column and packed beds.
In the biomedical arena a number of chapters cover many fascinating articles related to blood flow, ranging from pulse wave propagation in blood vessels to numerical simulation of blood flow in stenosed channels. Other chapters in this area which describe application of microfluidics to biological systems and biomedical applications are equally fascinating.
I would like to congratulate the editors for bringing these separate but complementary chapters together in a book form. It is also nice to see many multi-disciplinary teams from countries across the globe working together to produce these chapters. I hope that the reader will benefit from the breadth and depth of the range of chemical engineering and biomedical topics covered in these chapters.
Dr. Vishwas V. Wadekar
ii
PREFACE
Single or two-phase flows are ubiquitous in most natural process and engineering systems. Examples of systems or process include packed bed reactors, either single phase or multiphase, absorber and adsorber separation columns, filter beds, plate heat exchangers, flow of viscoelastic fluids in polymer systems, or the enhanced recovery of oil, among others.
In each case the flow plays a central role in determining the system or process behaviour and performance. A better understanding of the underlying physical phenomena and the ability to describe is crucial to design, operate and control processes involving the flow of fluids, ensuring that they will be more efficient and cost effective.
Growing areas such as microfluidics, nanomedicine and the modelling and simulation of complex flow in living systems such as the blood flow in microvascular networks rely upon a good description of the flow. One way of studying the blood flow behavior is in the context of blood flow in large arteries, and another is in small vessels. In the former case, blood may be treated as a homogenous fluid and
Newtonian constitutive equations are generally accepted as a good approximation to express the rheological property of blood. In small vessels, however, the scale of generated flow field sometimes becomes comparable to the scale of a blood cell. The chapters from the area of biomedical engineering will describe several physiological and pathological events that happen in both large and small vessels.
Recent advances either in computational and experimental techniques are improving the existing knowledge of single and multiphase flows in engineering and physical systems of interest. This book reviews the state of the art and recent advances in various key areas of fluid mechanics and transport phenomena in the fields of chemical and biomedical engineering.
iii
Ricardo Dias, Antonio A. Martins, Rui Lima and Teresa M. Mata (Eds) All rights reserved-© 2012 Bentham Science Publishers
List of Contributors
Jacinto Sá
School of Chemistry and Chemical Engineering, David Keir Building, Queen’s University Belfast, Stranmillis Road, Belfast, BT9 5AG, Northern Ireland, UK.
Cristina-Elena Stere
School of Chemistry and Chemical Engineering, David Keir Building, Queen’s University Belfast, Stranmillis Road, Belfast, BT9 5AG, Northern Ireland, UK.
Alexandre Goguet
School of Chemistry and Chemical Engineering, David Keir Building, Queen’s University Belfast, Stranmillis Road, Belfast, BT9 5AG, Northern Ireland, UK.
Emilio Muñoz
Department of Chemical Engineering and Environmental Engineering, University of Oviedo, C/Julián Clavería 8, 33006-Oviedo, Spain.
David Lesser
Institut für Chemische Verfahrenstechnik, Technische Universität Clausthal, Leibnizstr. 17, 38678 Clausthal, Germany.
Pablo Marín
Department of Chemical Engineering and Environmental Engineering, University of Oviedo, C/Julián Clavería 8, 33006-Oviedo, Spain.
Salvador Ordóñez
Department of Chemical Engineering and Environmental Engineering, University of Oviedo, C/Julián Clavería 8, 33006-Oviedo, Spain.
Fernando V. Díez
iv
Alexandros N. Kalarakis
Institute of Chemical Engineering and High Temperature Chemical Processes, Foundation for Research and Technology, Hellas, Greece.
Eugene D. Skouras
Institute of Chemical Engineering and High Temperature Chemical Processes, Foundation for Research and Technology, Hellas, Greece.
Vasilis N. Burganos
Institute of Chemical Engineering and High Temperature Chemical Processes, Foundation for Research and Technology, Hellas, Greece.
Ricardo J. Santos
Laboratory of Separation and Reaction Engineering, Departamento de Engenharia Química, Faculdade de Engenharia da Universidade do Porto, Rua Dr. Roberto Frias, 4200-465 Porto, Portugal.
Madalena M. Dias
Laboratory of Separation and Reaction Engineering, Departamento de Engenharia Química, Faculdade de Engenharia da Universidade do Porto, Rua Dr. Roberto Frias, 4200-465 Porto, Portugal.
José Carlos B. Lopes
Laboratory of Separation and Reaction Engineering, Departamento de Engenharia Química, Faculdade de Engenharia da Universidade do Porto, Rua Dr. Roberto Frias, 4200-465 Porto, Portugal.
Andrei Chorny
A.V. Luikov Heat and Mass Transfer Institute, 15 P.Brovka Str, Minsk, 220072, Belarus.
J.P. Pereira
v
A. Karpinska
LSRE-Laboratory of Separation and Reaction Engineering, Faculdade de Engenharia da Universidade do Porto, Portugal.
P.J. Gomes
LSRE-Laboratory of Separation and Reaction Engineering, Faculdade de Engenharia da Universidade do Porto, Portugal.
A.A. Martins
LSRE-Laboratory of Separation and Reaction Engineering, Faculdade de Engenharia da Universidade do Porto, Portugal.
A. Guardo
Fluid Mechanics Department, Universitat Politècnica de Catalunya, Av. Diagonal 647, ETSEIB, 08028, Barcelona, Spain.
E. Ramírez
Chemical Engineering Department, Faculty of Chemistry, Universitat de Barcelona, Martí i Franquès 1, 08028, Barcelona, Spain.
M.A. Larrayoz
Chemical Engineering Department, Universitat Politècnica de Catalunya, Av. Diagonal 647, ETSEIB, 08028, Barcelona, Spain.
F. Recasens
Chemical Engineering Department, Universitat Politècnica de Catalunya, Av. Diagonal 647, ETSEIB, 08028, Barcelona, Spain.
J.M.P.Q. Delgado
xii
ACKNOWLEDGEMENTS
The editors acknowledge all the authors for their contributions and express our sincere appreciation to the assistance of all parts involved in the preparation of the book. We also acknowledge the support from the following grants: Grant-in-Aid for Science and Technology (BEB/108728/2008, PTDC/SAU-BEB/105650/2008 and PTDC/EME-MFE/099109/2008) from the Science and Technology Foundation (FCT) and COMPETE, Portugal.
Single and Two-Phase Flows on Chemical and Biomedical Engineering, 2012, 489-512 489
Ricardo Dias, Antonio A. Martins, Rui Lima and Teresa M. Mata (Eds) All rights reserved-© 2012 Bentham Science Publishers
CHAPTER 19
Numerical Analysis of Blood Flow in Stenosed Channels
Stéphanie Ferreira1, Ricardo P. Dias2,3,*, Carlos Balsa4 and Carla S. Fernandes4
1
Escola Superior de Tecnologia e Gestão de Bragança, Campus de Santa
Apolónia, 5301-857 Bragança, Portugal; 2Departamento de Tecnologia Química
e Biológica, Escola Superior de Tecnologia e Gestão de Bragança, Campus de
Santa Apolónia, 5301-857 Bragança, Portugal; 3CEFT-Centro de Estudos de
Fenómenos de Transporte, Faculdade de Engenharia da Universidade do Porto,
4200-465 Porto, Portugal and 4Departamento de Matemática, Escola Superior de
Tecnologia e Gestão de Bragança, Campus de Santa Apolónia, 5301-857 Bragança, Portugal
Abstract: Wall shear rates and pressure developed in blood vessels play an important role on the development of some clinical problems such as atherosclerosis and thrombosis. In the present work, blood flow behaviour was numerically studied in simplified domains and several relevant local properties were determined. We believe that the obtained results will be useful in the interpretation of some phenomena associated to some clinical problems. To describe the rheological behaviour of blood, three constitutive equations were used-constant viscosity, power-law and Carreau model. Numerical predictions for the blood flow in stenosed channels were in good agreement with analytical results, indicating that the computational model used to describe the studied problem is reliable. Pressure attains maximum values close to the top of the atheroma and shear rates achieved maximum values at the walls located in the nearby of the atheroma. It was also observed that, with the studied flows, the impact of the non-Newtonian behaviour of the blood on the velocity profiles was not significant. This observation can be explained by the magnitude of the obtained shear rates.
Keywords: Blood, atheroma, power-law model, carreau model, newtonian fluid, computational fluid dynamics, velocity, shear rate, pressure, fanning friction factor
INTRODUCTION
The survival of a complex organism with large dimensions, like the human
490 STP Flows on Chemical and Biomedical Engineering Ferreira et al.
organism, requires a system prepared to transport several substances for and from every organism’s cells [1-3]. This is the principal function of the circulatory system. In this system, the blood is an aqueous vehicle responsible for the transportation of nutrients, oxygen, chemical mediators, antibodies, defense cells and toxic substances [1], maintaining the ideal environment for the survival and function of the entire organism cells [3].
Blood
The blood is an opaque and heterogeneous fluid composed by a yellowish fluid-the plasma-and a series of cellular elements [1]. The blood is contained in a closed compartment-the circulatory system-that keeps it in motion in a unidirectional stream [4]. In an adult, the volume of blood is about 7% of the body weight or about 5 liters (in an adult with about 70 Kg of body weight) of which almost 60% is plasma [5].
The blood cells have a short lifetime in the blood flow. Therefore, they are constantly replaced for new cells [4, 5]. The blood cell formation process is designated as hemocitopoiesis or hematopoiesis [4].
The steam cell is rare, less than one in every 10000 nucleated cells of the bone marrow. The mitotic division of the steam cell originates two daughter cells, one remains as steam cell and the other will pursue for one of two differentiation ways: the lymphoid way, which gives origin to lymphocytes, and the myeloid way that gives origin to the rest of the blood cells [3, 4, 6].
Blood Rheology
Inside de normal circulatory flow, blood behaves as a non-Newtonian fluid. As a first approach, blood viscosity can be determined by the viscosity of plasma and internal friction between plasma and the cells in suspension (solution-gel) [7]. Four factors influence the viscosity: hematocrit, temperature, velocity and diameter of the blood vessel, as it will be described below.
Numerical Analysis of Blood Flow STP Flows on Chemical and Biomedical Engineering 491
referred levels of hematocrit, the erythrocytes become aggregated in a way that the blood flows with difficulty and, consequently, the cardiac work is huge [8].
Figure 1: Schematic representation of the relation blood viscosity vs. hematocrit.
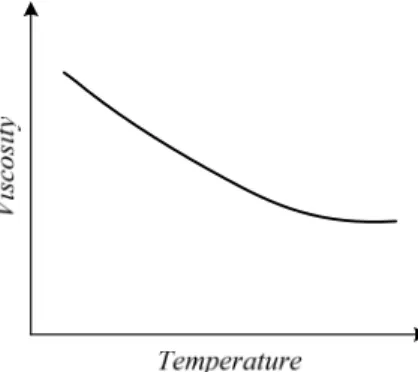
Under normal conditions, temperature (Fig. 2) does not play an important role in the blood viscosity. However, in in vitro experiments, surgeries requiring circulation outside the body and hypothermic conditions, there is an increase of the blood viscosity [8].
Figure 2: Schematic representation of the relation blood viscosity vs. temperature.
Since blood is not a Newtonian fluid, blood viscosity varies with the flow velocity, as presented in Fig. 3. The blood only flows when a certain tangential force is exceeded and, after this force, presents a pseudoplastic behaviour, i.e., its viscosity decrease with the increase of the velocity, until a certain limit is reached [8].
492 STP Flows on Chemical and Biomedical Engineering Ferreira et al.
by the power-law model and Carreau model. These models are mathematically described by the following equations, respectively:
Figure 3: Schematic representation of the relation blood viscosity vs. velocity.
, (1)
, (2)
where is the viscosity of the fluid, K the consistency index, n the flow index behavior, the shear rate, η∞ the viscosity for high shear rates, η0 the viscosity
for low shear rates and the natural time. For the blood, the rheological parameters present in the equations referred above are presented in Table 1.
Table 1: Rheological Parameters of Blood [9]
Rheological model (Pa.s) K (Pa.sn) n (-) (s) (Pa.s) 0 (Pa.s)
Newtonian 0.00345 - - - - - Power law model - 0.035 0.6 - - -
Carreau model - - 0.3568 3.313 0.00345 0.056
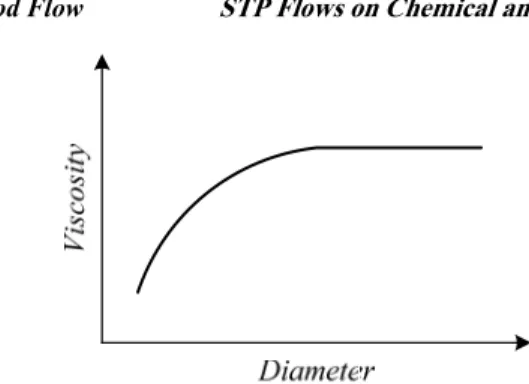
The viscosity of the blood is also dependent from the diameter of the vessel, Fig. 4. The blood viscosity achieves a constant value for a diameter higher than 0.25 mm. However, for lower diameters the viscosity tends to decrease with the reduction of the diameter. This effect is known as the Fahraeus-Lindqvist effect [8]. There are evidences that suggest that this phenomenon disappear or can even be reversed for low velocities [10].
1
n
K
2 1 / 20 1
n
Numerical Analysis of Blood Flow STP Flows on Chemical and Biomedical Engineering 493
Figure 4: Schematic representation of the relation blood viscosity vs. diameter vessel.
Blood Flow in Arteries with Atheroma
Arthrosclerosis means literally “arteries hardening”, however it is a generic term that refers to three patterns of vascular diseases which have the hardening and loss of elasticity of the arteries walls as a common factor [11].
The dominant pattern is atherosclerosis, characterized by the formation of fibrous plaques that generally exhibit a centre rich in lipids.
The atherosclerosis is very common among the population of North America, Europe, Australia, New Zealand, Russia and other developed countries. On the other hand, and judging by the number of deaths attributed to ischaemic cardiopathy (including myocardial infarction), this disease is less prevalent in Central America, South America, Africa and Asia. For instance, the mortality rate due to ischaemic cardiopathy in the United States of America is among the largest of the world, being six times greater than in Japan. Meanwhile, the Japanese who migrate to the United States of America and adopt the American lifestyle and diet also acquire the predisposition for atherosclerotic diseases typical among the American population.
494 STP Flows on Chemical and Biomedical Engineering Ferreira et al.
Factor Intervention Test (MRFIT). The constitutional factors include age, sex, genetics, hyperlipidemia, hypertension, tabagism, Diabetes Mellitus, elevated plasma levels of homocystein, factor that affects hemostasis, thrombose, and others [11]. The clinical manifestations of atherosclerosis correspond to the manifestation of its complications (thrombosis, calcification, aneurysmic dilatation) and the distal ischaemic events (in the heart, brain, inferior members and other organs). Knowing all these atherosclerosis consequences, intense efforts are being made in order to develop methods to try and minimise this big problem. Therefore there are involved primary prevention programmes, which have the objective to slow the atheroma formation or to induce the regression of established lesions in individuals that have never suffered any severe complication; and programmes of secondary prevention, destined to avoid certain events complications, as the myocardial infarction [11].
NUMERICAL APPROACH
Numerical predictions of velocity, pressure and shear rate distributions inside channels with atheromas can be obtained by solving sets of conservative mass and momentum equations using the finite-element method. Since experimental study of blood flow in the circulatory system is not an easy task, the numerical results can be useful in order to understand the blood behaviour in stenosed arteries/vessels.
Model Details
The conservation of mass and momentum equations for steady laminar incompressible flow were solved by the finite-element software package POLYFLOW® and the simulations were performed using a Dell Workstation PWS530 with 1GB of RAM.
In the numerical calculations, blood was treated, in some cases, as Newtonian fluid, and in other ones, as a non-Newtonian fluid, its rheology being described, in the latter case, by the power-law (equation (1)) and Carreau (equation (2)) models.
Geometrical Domain and Mesh Generation
Numerical Analysis of Blood Flow STP Flows on Chemical and Biomedical Engineering 495
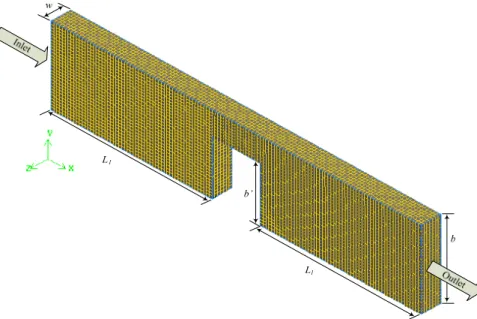
Simulations were carried out in five channels with a rectangular cross section presenting different stenosis degrees, (Table 2 and Fig. 5). All the channels had the same width, , length, and height,
. The atheroma in each of the channels had a rectangular shape with a width of 30 mm and variable height (see Table 2).
Table 2: Geometrical Properties of the Channels
Channel Stenosis degree (%) Atheroma height (mm)
C1 40 20.0
C2 45 22.5
C3 50 25.0
C4 55 27.5
C5 70 35.0
The values of stenosis degrees were defined as the ratio between the height of the channel and the height of the atheroma. The established values allows the study in the usual range of the stenosis degree (the obstruction of the vascular lumen shouldn’t exceed 50%)-channels C1, C2 and C3-and out of the referred range-channels C4 and C5.
Figure 5: Representation of the computational domain and used mesh. 12.5 mm
w L2L1Latheroma 23 cm
50 mm
496 STP Flows on Chemical and Biomedical Engineering Ferreira et al.
The discretization of the stenosed channels was made using a structured uniform grid constituted by quadrilateral elements with 1.75 mm. The size of the elements was fixed after a grid independence test. The grids were successively refined and the velocities obtained with the different meshes were compared. The results were considered to be independent of the mesh when a difference bellow 1 % (in the Fanning friction factor) was achieved [12, 13].
Boundary Conditions
The boundary conditions were established in order to reproduce the conditions of experimental works performed with similar channels [14]. In the inlet (plane
), a constant flow rate was imposed in order to achieve a mean velocity of 4.5 mm/s and non-slip at the walls was admitted. Additionally, planes of symmetry were imposed in the lateral walls of the channels.
Numerical Resolution
The equations solved were the conservation of mass and momentum equations for laminar incompressible flow of blood. The problem is a non-linear problem, so it was necessary to use an iterative method to solve the referred equations. In order to evaluate the convergence of this process, a test based on the relative error in the velocity field was performed. For the velocity field, the modification on each node between two consecutive iterations was compared to the value of the velocity at the current iteration. In the present work, the convergence value was set to 10-4, since this value is appropriate for the studied problem [13, 15-17].
Model Validation
When computational fluid dynamics (CFD) calculations are performed, it is of extreme relevance to verify the reliability and exactness of the used model. For this purpose, comparisons of the CFD results with analytical solutions of similar but simpler flows or with high quality data from closely related problems reported in the literature can be used [18].
In order to verify the reliability and exactness of the model used in this investigation, velocity profiles were compared with the analytical solution for the fully developed flow of a power-law fluid in flat infinite parallel plates [16]:
0
Numerical Analysis of Blood Flow STP Flows on Chemical and Biomedical Engineering 497
, (3)
where u is the average velocity and is given by:
, (4)
Mv being the volumetric flow rate.
In Fig. 6 it is possible to observe the good agreement between the numerical velocities and equation (3) for both Newtonian (n = 1) and power-law fluid (n = 0.6) (maximum deviation of 0.60% and 1.68% for the Newtonian and power-law fluid, respectively). As expected, the maximum deviations were observed near the wall, since the velocities in this region were close to zero.
Figure 6: Velocity profiles for fully developed flow in the region before atheroma in channel C1 for different rheological models. (●) Newtonian; (○) Power-law model; (—) equation (3) with n = 1; (---) equation (3) with n = 0.6.
To estimate the pressure drop, it is usual to use correlations between the Fanning friction factor and the Reynolds number, Re. For laminar flows it is well know that:
1
2 1 2
( ) 1
1 n n n y
v y u
n b
Mv
u wb 0 0.1 0.2 0.3 0.4 0.5 0.6 0.7
0 0.01 0.02 0.03 0.04 0.05
y (m)
v
(
mm/s
498 STP Flows on Chemical and Biomedical Engineering Ferreira et al.
, (5)
where a is a coefficient dependent of the geometry. The Fanning friction factor and Reynolds number present in the latter equation can be calculated by their definitions:
, (6)
. (7)
In the definitions above, De represents the equivalent diameter and is given by
.
The values of the parameter a from the f-Re correlation (equation (5)), obtained when blood was considered a Newtonian fluid, are presented in Fig. 7.
The values presented in Fig. 7 were determined dividing the geometrical domain in 23 subdomains with constant length (1 cm). So, parameter Lu was defined,
representing the number of the subdomains (Lu = 0 and Lu = 22 are the
subdomains containing the inlet and the outlet of the channel, respectively).
Figure 7: Evolution of coefficient a from the f-Re relation in the different channels for the Newtonian fluid. (—) Channel C1; (—) Channel C2; (—) Channel C4.
1 Re f a
2
2
PDe
f
L u
Re
uDe
2 e
D b
22 26 30 34 38 42 46 50 54
1 3 5 7 9 11 13 15 17 19 21
Lu
Numerical Analysis of Blood Flow STP Flows on Chemical and Biomedical Engineering 499
In Fig. 7 it is possible to observe that for fully developed flow (before and after the atheroma) coefficient a assumes a value very close to the one predicted analytically for flat infinite parallel plates (a = 24). The good agreement found between the numerical and analytical solutions allows confirming, once again, that the computational model describes well the studied flow. In this figure, it can also be observed that the coefficient a (and pressure drop) increases with the increase of the stenosis degree.
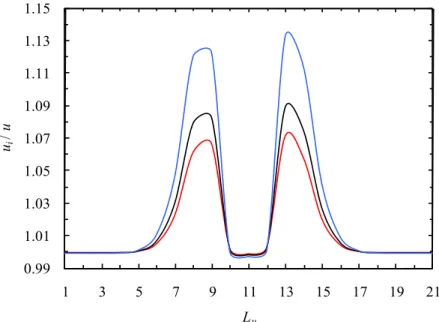
The coefficient a assumes maximum values close to the atheroma (see Fig. 7), this fact being explained by the maximums of the ratio between the interstitial velocity, ui, and mean velocity (see Fig. 8).
Figure 8: Evolution of the ratio ui/u along the different channels for the Newtonian fluid. (—) Channel C1; (—) Channel C2; (—) Channel C4.
The referred ratio and the coefficient a achieve maximums/minimums in the same regions since they can be related by the following expression:
, (8)
K0 being the shape factor of the channel [12].
0.99 1.01 1.03 1.05 1.07 1.09 1.11 1.13 1.15
1 3 5 7 9 11 13 15 17 19 21
ui
/
u
Lu
2
0
i
u a K
500 STP Flows on Chemical and Biomedical Engineering Ferreira et al.
RESULTS AND DISCUSSION
In the present work, velocity, pressure and shear rate profiles in stenosed channels were analyzed in order to understand the blood flow behaviour when this kind of pathologies appears.
The ratio between interstitial velocity and mean velocity can explain some relevant properties for the studied flow, like it was shown in the last section. The referred ratio is called tortuosity coefficient [13], , and can be also defined by:
, (9)
where Lav is the average travel distance of a fluid element in a channel with length L, the former length being estimated, for instance, by the average length of streamlines presented in Figs. 9a, 9b and 9c.
In Figs. 9a, 9b and 9c it is possible to observe higher disturbances in the blood flow when a bigger atheroma exists in the channel-fluid elements are forced to make longer travels (Figs. 8, 9a, 9b and 9c).
(a)
(b)
(c)
Figure 9: Streamlines in the central planes of the different channels. (a) Channel C1; (b) Channel C2; (c) Channel C4.
Lav ui
Numerical Analysis of Blood Flow STP Flows on Chemical and Biomedical Engineering 501
From the analysis of the velocity profiles, obtained for the different channels, it was possible to verify that the referred results are qualitatively the same when different rheological models (Newtonian, Carreau model and power-law model) are used (see Figs. 10a, 10b, 10c).
(a)
(b)
(c)
Figure 10: Velocity profiles (m/s) in the central plane of the channel C3 for the distinct rheological models. (a) Newtonian; (b) Carreau model; (c) Power-law model.
It was also verified that the influence of the stenosis degree is felt in the same way for the distinct rheological models, as can be observed in Figs. 11a, 11b, 12a and
12b, where velocity profiles in planes before the atheroma are presented for the non-Newtonian models used in this study.
In Figs. 11a and 11b it is possible to observe that the deviation from the parabolic shape of the velocity profile for a rectangular channel occurs for all the channels. The maximum of velocity moves from the center of the channel, obtained for a rectangular channel, in the direction of the top wall of the channel.
502 STP Flows on Chemical and Biomedical Engineering Ferreira et al.
(a) (b)
Figure 11: Velocity profiles, for the different channels and non-Newtonian models, in the intersection of the central plane and plane x = 0.07 m. (a) Power-law model; (b) Carreau model.
(a) (b)
Figure 12: Velocity profiles, for the different channels and non-Newtonian models, in the intersection of the central plane and plane x = 0.09 m. (a) Power-law model; (b) Carreau model.
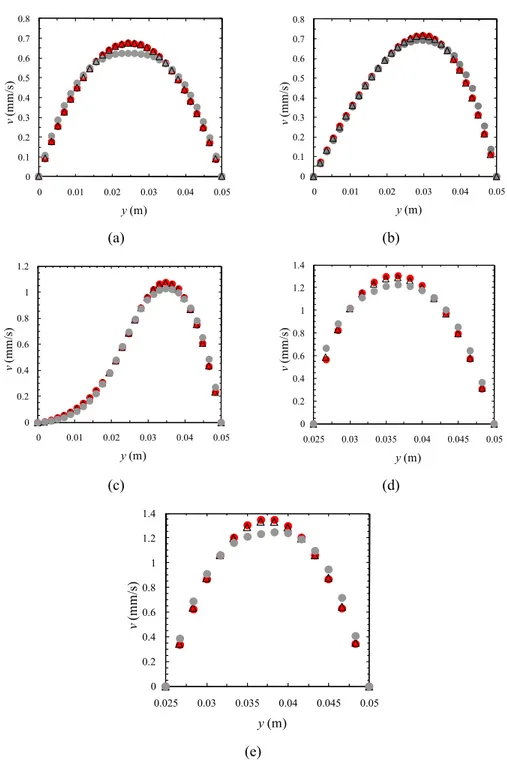
The proximity of the results presented in Figs. 11 and 12 can also be observed in Fig. 13. It was observed that the magnitude of the velocities obtained with the different rheological models were slightly different. This fact is clearly shown on Fig. 13 using channel C3 (50% stenosis degree).
The velocity profiles presented in Fig. 13a possess a parabolic shape, typical of fully developed flows in rectangular ducts, while in Fig. 13b the influence of the
0.0 0.1 0.2 0.3 0.4 0.5 0.6 0.7 0.8
0 0.01 0.02 0.03 0.04 0.05
v (m m /s ) y(m)
C1 C2 C3 C4 C5
0.0 0.1 0.2 0.3 0.4 0.5 0.6 0.7 0.8
0 0.01 0.02 0.03 0.04 0.05
v (m m /s ) y(m)
C1 C2 C3 C4 C5
0.0 0.5 1.0 1.5
0 0.01 0.02 0.03 0.04 0.05
v (m m /s ) y(m)
C1 C2 C3
C4 C5
0.0 0.5 1.0 1.5
0 0.01 0.02 0.03 0.04 0.05
v (m m /s ) y(m)
C1 C2 C3
Numerical Analysis of Blood Flow STP Flows on Chemical and Biomedical Engineering 503
(a) (b)
(c) (d)
(e)
Figure 13: Velocity profiles, for the different rheological models, in the intersection of the central plane and planes x=constant along the channel C3 (50% stenosis degree). (a) x = 0.03 m; (b) x = 0.07 m; (c) x = 0.09 m; (d) x = 0.1 m; (e) x = 0.115 m. () Newtonian; () Carreau model; () Power-law model. 0 0.1 0.2 0.3 0.4 0.5 0.6 0.7 0.8
0 0.01 0.02 0.03 0.04 0.05
v (mm/ s) y(m) 0 0.1 0.2 0.3 0.4 0.5 0.6 0.7 0.8
0 0.01 0.02 0.03 0.04 0.05
v (m m /s) y(m) 0 0.2 0.4 0.6 0.8 1 1.2
0 0.01 0.02 0.03 0.04 0.05
v (m m /s) y(m) 0 0.2 0.4 0.6 0.8 1 1.2 1.4
0.025 0.03 0.035 0.04 0.045 0.05
v (m m /s ) y(m) 0 0.2 0.4 0.6 0.8 1 1.2 1.4
0.025 0.03 0.035 0.04 0.045 0.05
v
(mm/
s)
504 STP Flows on Chemical and Biomedical Engineering Ferreira et al.
presence of the atheroma on the velocity field is already important. The stagnant region observed in Figs. 12 and 13c can be also observed in Fig. 10, in the region right before the atheroma. Fig. 13d represents the velocity profile obtained in the left corner of the atheroma while Fig. 13e corresponds to the middle of the top edge of the atheroma, a parabolic profile being obtained at this latter point.
The proximity of the results obtained with the Newtonian and Carreau model (shown in Figs. 10 and 13 for 50% stenosis degree) wasn’t observed, in the region of the atheroma, when testing the channel with 70% of stenosis degree. For that region and channel, the results obtained with the power-law and Carreau models were almost the same and different from the ones obtained with the Newtonian model. This fact can be explained by the magnitude of shear rates developed in the referred region.
The shear rate profiles were qualitatively the same for the distinct channels and rheological models, as happens with the velocity profiles. In Figs. 14a, 14b, 14c it is possible to observe that the shear rate maximums were obtained in the top edge of the atheroma, this behaviour being observed with all the channels.
(a)
(b)
(c)
Figure 14: Shear rate profile (s-1) in the central plane of the channel C3 for the distinct rheological
Numerical Analysis of Blood Flow STP Flows on Chemical and Biomedical Engineering 505
The maximum shear rate, , developed in a generic duct can be estimated by [19]:
(10)
where n is the flow index (power-law model) and ξ and geometrical parameters of the duct, given by and . For parallel infinite plates these geometrical values are and since for the referred geometry.
The numerical results allow the calculation of the maximum shear rate along the top wall of the channels. The maximums obtained numerically were compared with the predictions of equation 10 for Newtonian (n = 1) and power-law fluid (n
= 0.6) considering that the studied channels are from the flat infinite parallel plates type (Figs. 15a and 15b). It was found a good agreement between the numerical results and equation 10, the maximum deviation being obtained with channel C5 (6.76% and 10.81% for Newtonian and power-law fluid, respectively). For stenosis degree lower than 50% the maximum shear rates developed considering blood a Newtonian (Fig. 15a) fluid and using the Carreau model (Fig.
15c) were very close and assume values in the range 0.15-0.20 s-1. The proximity of these results could be explained by the Newtonian behaviour predicted by the Carreau model in the referred range of shear rates, as can be observed in Fig. 16. For channel C5 (70% of stenosis degree) the maximum shear rates obtained with the two non-Newtonian models were located between 0.6 and 0.7 s-1. Once again, the dependence of viscosity on shear rate explains these results since for
the Carreau model predicts a similar behaviour to the one predicted by the power-law model (Fig. 16).
The initial lesion of an atheroma formation can trigger due to the turbulence of the flow. Most of the times, the formation of an atheroma is accomplished by a thrombus formation. It is thought that the location of higher pressures and velocities-in the top of the atheroma-promote the endothelium lesion and hence the formation of a thrombus, which normally conduce to a thromboembolism due to the high speeds and pressures.
max
max 1 2 1 e n u n D Re 2 f 24
12
2 f R e 2 4
1 1
506 STP Flows on Chemical and Biomedical Engineering Ferreira et al.
(a)
(b)
(c)
Figure 15: Shear rate along the wall of the different channels for the distinct rheological models. (a) Newtonian; (b) Power-law model; (c) Carreau model. (●) Channel C1; (○) Channel C2; (●) Channel C3; (●) Channel C4; (●) Channel C5; (---) equation (10) with n = 1 (a) and n = 0.6 (b).
0 0.1 0.2 0.3 0.4 0.5 0.6 0.7
0 0.046 0.092 0.138 0.184 0.23
(s -1) x(m)
.
0 0.1 0.2 0.3 0.4 0.5 0.6 0.7 0.80 0.046 0.092 0.138 0.184 0.23
(s -1) x(m)
.
0 0.1 0.2 0.3 0.4 0.5 0.6 0.70 0.046 0.092 0.138 0.184 0.23
(s
-1)
x(m)
Numerical Analysis of Blood Flow STP Flows on Chemical and Biomedical Engineering 507
Figure 16: Blood viscosity vs. Shear rate.
The pressure distribution (Fig. 17) in all the channels and with the different rheological models was analyzed and, once again, it was observed that, qualitatively, the distinct rheological models provided similar results.
Figure 17: Pressure distribution (Pa) for the channel C1 and power-law model.
In Fig. 18 it is presented the pressure profiles along the intersection of the central plane (z = 6.25 mm) with the plane x = 0.1 m, this latter plane (x = 0.1 m) including the left lateral wall of the atheroma (x = 0.1 m). As suggested also by Fig. 17, the pressure increased slightly along the left lateral wall of the atheroma and had a steepest increase close to the corner of the different atheromas. Above the different atheromas the pressure had a sudden decrease. These trends were observed with the different rheological models.
0.001 0.01 0.1 1
0.01 0.1 1 10 100 1000
(P
a s
)
(s-1)
Newtonian
Carreau model
Power-law model
508 STP Flows on Chemical and Biomedical Engineering Ferreira et al.
Figure 18: Pressure along the intersection of the central plane (z = 6.25 mm) and plane x = 0.1 m for all the channels and power-law model. (—) Channel C1; (—) Channel C2; (—) Channel C3; (—) Channel C4; (—) Channel C5.
From the figure shown above, it was confirmed that the maximum of the pressure is achieved close to the top of the atheroma, this fact being in agreement with the explanation found in literature [11] for the thrombus formation and consequent thromboembolism.
The pressure distribution along the top wall of the channels was also analysed (Figs. 19a, 19b and 19c) and it was observed that the pressure had, as expected, a sudden decrease along the atheroma (the atheroma begins in the plane x = 0.1 m) and reaches an asymptotic value near the end of the atheroma.
The blood flow rate decreases when several atheromas are present in the human organism. This decrease will cause ischaemia, i.e., an impairment of organs due to lack of irrigation and the consequent lack of oxygen. Consequences of this are the myocardial infarction (heart attack), cerebral infarction (stroke), aneurysms and gangrene.
0.05 0.1 0.15 0.2 0.25 0.3
0 0.01 0.02 0.03 0.04 0.05
y (m)
P
(P
Numerical Analysis of Blood Flow STP Flows on Chemical and Biomedical Engineering 509 (a)
(b)
(c)
Figure 19: Pressure along the top wall of the different channels and distinct rheological models. (a) Newtonian; (b) Power-law model; (c) Carreau model. (●) Channel C1; (○) Channel C2; (●) Channel C3; (●) Channel C4; (●) Channel C5.
0 0.005 0.01 0.015
0 0.046 0.092 0.138 0.184 0.23
x (m)
P
(P
a)
0 0.1 0.2 0.3
0 0.046 0.092 0.138 0.184 0.23
x (m)
P
(P
a)
0 0.05 0.1 0.15 0.2
0 0.046 0.092 0.138 0.184 0.23
x (m)
P
(P
510 STP Flows on Chemical and Biomedical Engineering Ferreira et al.
CONCLUSIONS
In the present work, blood flow in stenosed channels was numerically studied using the commercial finite element code POLYFLOW®. The governative equations were solved using different constitutive models-Newtonian fluid, power-law model and Carreau model. Additionally, different computational domains were also analysed.
The used geometrical domains were 3D channels with a rectangular cross sectional area and different stenosis degrees were tested. For the construction of the referred geometries, two symmetry planes were considered in the lateral walls of the channels. Hence, the model validation was performed by using the analytical solutions for infinite parallel plates-local velocity profiles and coefficient a from the f-Re relation. The good agreement found between numerical and analytical solutions was useful in order to validate the numerical model.
The impact of the different rheological models in the velocity profiles were analysed and it was observed that velocities obtained with the power-law model were slightly different from the ones predicted when the blood was considered a Newtonian fluid or when Carreau model was used to describe the rheological behaviour of blood. However, in the region of the atheroma, the channel with a stenosis degree of 70% provided different velocity results when the Carreau model was used. In the latter channel, the velocities obtained with the power-law and Carreau models were similar and higher than the ones obtained assuming the blood as a Newtonian fluid.
Numerical Analysis of Blood Flow STP Flows on Chemical and Biomedical Engineering 511
0.7 s-1 for both non-Newtonian models and values lower than 0.6 s-1 were obtained for the Newtonian fluid. These different trends were explained having in mind the behaviour of the rheological models with the variation of shear rate.
When the walls of the atheromas are submitted to large pressures, it is possible to generate an endothelium disruption andconsequently lead to the formation of a new thrombus. The numerical results revealed that the pressure developed in the walls of the atheromas was higher in a region close to their top, fact that can explain the referred clinical problem.
CONFLICT OF INTERES
None declare.
ACKNOWLEDGEMENTS
The authors acknowledge the financial support provided by: PTDC/SAU-BEB/108728/2008 and PTDC/SAU-BEB/105650/2008 from the FCT (Science and Technology Foundation) and COMPETE, Portugal.
REFERENCES
[1] Williams PL, Warwick R, Dyson M, Bannister LH, Eds. Grays anatomy of the human body. 38th edition. London: Churchill Livingstone 1995.
[2] Fox RW, MC Donald AT. Introdução a mecânica dos fluidos. 4a ed. Rio de Janeiro: Livros Técnicos e Científicos 1992.
[3] Guyton AC, Hall JE. Textbook of medical physiology. 10th ed. Philadelphia: WB Saunders 2000.
[4] Junqueira LC, Carneiro J. Histologia básica. 9ª ed. Rio de Janeiro: Guanabara Koogan 1999.
[5] Koury MJ, Prem P. New insights in erythropoiesis: roles of folate, vitamine B12 and iron.
Ann Rev Nutr 2004; 24: 105-31.
[6] Hoffbrand AV, Petit JE, Moss PAH. Essential hematology. 4th ed. Massachussets: Blackwell Science 2001.
[7] Dintenfass, L. Thixotropy of blood and proneness to thrombus formation. Circulation Res 1962; 11: 233-39.
[8] Meier MA. Reologia do sangue. Revista Brasileira de Anestesiologia 1967; 3: 290-97. [9] Johnston BM, Johnston PR, Corney S, Kilpatrick D. Non-Newtonian blood flow in human
right coronary arteries: steady state simulations. J Biomech2004; 37: 709-20.
512 STP Flows on Chemical and Biomedical Engineering Ferreira et al.
[11] Robbins SL, Cotran RS, Kumar V, Collins T. Fundamentos de Robbins-Patologia estrutural e functional. 6ª ed. Rio de Janeiro: Editora Guanabara Koogan 2000.
[12] Metwally HM, Manglick RM. Enhanced heat transfer due to curvature-induced lateral vortices in laminar flows in sinusoidal corrugated-plate channels. Int J Heat Mass Transf 2004; 47: 2283-92.
[13] Fernandes CS, Dias RP, Nóbrega JM, Maia JM. Laminar flow in chevron-type plate heat exchangers: CFD analysis of tortuosity, shape factor and friction factor. Chem Eng Proc 2007; 46: 825-33.
[14] Fujiwara H., Ishikawa T., Lima R., et al. Red blood cell motions in high-hematocrit blood flowing through a stenosed microchannel. J Biomech 2009; 42: 838-43.
[15] Dias RP, Fernandes CS, Teixeira JA, Mota M, Yelshin A. Starch analysis using hydrodynamic chromatography with a mixed-bed particle column. Carbohydr Polym 2008; 74: 852-57.
[16] Fernandes CS, Dias R, Nóbrega JM, Afonso IM, Melo LF, Maia JM. Simulation of stirred yoghurt processing during cooling in plate heat exchangers. J Food Eng 2005; 76: 433-39. [17] Fernandes CS, Dias RP, Nóbrega JM, Maia JM. Friction factors of power-law fluids in
chevron-type plate heat exchangers. J Food Eng 2008; 89: 441-47.
[18] Versteeg HK, Malalasekera W. An introduction to computational fluid dynamics. Harlow: Pearson Prentice Hall 1995.