14ª Conferência da Associação Portuguesa de Sistemas de Informação (CAPSI 2014) 03 e 04 de Outubro de 2014, Évora, Portugal
ISSN 2183-489X
DOI http://dx.doi.org/10.18803/capsi.v14.162-173
162 Paulo João, NOVA School of Statistics and Information Management, ISEGI-UNL, Portugal,
Victor Lobo, Portuguese Naval Academy – NOVA School of Statistics and Information Management, Portugal [email protected]
Abstract
Detecting small clusters in a large amount of data is a difficult problem, mainly when there are only a few samples to be detected. There are general purpose solutions for small cluster detection, but many times they are not adequate for specific data. Artificial Intelligence techniques have been proposed, because they present the advantage of requiring little or no
a priori assumption on the data distributions. The amount and higher dimensional nature of
big data makes it too complex to be processed and analyzed by traditional methods. Hierarchical Self Organizing Maps, (HSOM) can improve the decision making with an approach based on specialization of Self Organizing Maps (SOM), dimensionality reduction and visualization of clusters. The goal is to propose a methodology to detect and visualize small clusters in the data with a toy case, where traditional human based approaches are not possible or are too complex to process, and the results clearly demonstrate that the HSOM based method outperforms the most widely adopted traditional methods revealing a number of small clusters hidden in data.
Keywords: Outlier detection, data mining, SOM, HSOM, cluster, big data.
1. INTRODUCTION
Big data describe the exponential growth and availability of data, both structured and unstructured and may be as important to society because more data involves more accurate analyses, such as cluster detection, and may lead to more confident decision making, better decisions can mean greater operational efficiencies, cost reductions and reduced risk.
Detect small clusters in big data, are usually associated with detecting unusual observations or outliers. Outlier detection has become a major focus of concern and a political, social and economic issue in the big data analysis. The requirement to meet public demand for quality and technology services is real and this is likely to become more widespread and intense [Yang and Hwang 2006]. The amount of data along with their high dimensional nature requires sophisticated statistical methods to extract new and unexpected patterns or clusters embedded in that data [Li, Huang, Jin and Shi 2008].
To detect outlier, first we analyze the available data and then we must detect the outlier data or unusual observations. This requires an understanding of the mathematical properties of data and
14ª Conferência da Associação Portuguesa de Sistemas de Informação (CAPSI 2014) 163 relevant knowledge in the domain context where the outliers occur [Ilango, Subramanian and Vasudevan 2012]. Detection methods can be divided between: univariate methods, where each variable is explored separately; and multivariate methods, where many variables are explored together. We can also find two different approaches in each case: parametric methods, that assume characteristics or parameters on the data, e.g. Gaussian distribution and non-parametric methods that don’t assume such characteristics or parameters [Ben-Gal 2005].
The problem of detection of multidimensional outliers is a fundamental and important problem in big data. It involves a lot of computation time and dimensionality reduction. Despite this, most known algorithms for detecting outliers are not fast enough when the underlying probability distribution is unknown, the size of the dataset is large and the number of dimensions is high [Chaudhary, Szalay and Moore 2002].
1.1. Outliers overview
Outliers are unusual observations on data. They are also known as: novelty; noise; extreme values; outlier, anomaly; defect data; skewed data; rare case or noisy data. The difference is not methodological but related to the involved subject.
Outliers have been informally defined as rare observations in a dataset that seem to be inconsistent with the rest of the data, or deviate so much from other observations to arouse suspicions that they were generated by a different mechanism. [Ferdousi and Maeda 2006], [Hodge and Austin 2004], [Ahmed and Funk 2011], [He, Xu, Huang and Deng 2004].
Another approach, refers outlier to criminal activities or fraudulent behavior occurring in commercial organizations such as banks, insurance agencies, mobile companies, etc., and it is assumed that these activities are rare and generate data which differs from normal activities. Thus, small clusters in data can be due to outliers, and it makes sense to look for outliers mainly amongst these clusters, even though they are not necessarily outliers.
1.2. Outlier detection
Applications such as small cluster detection need the detection of outliers, but most of the known algorithms (e.g. Parametric statistical models) for detecting outliers are not fast enough when the underlying probability distribution (a formula that gives the probability for each value of the random variable) is unknown, the size of the dataset (number of observations) is large, and the number of dimensions (number of variables) is high [Chaudhary et al. 2002].
Sometimes, detect a small cluster involves several entities and may show outlier behavior or small clusters of data among entities and deserves a close analysis of the situation.
14ª Conferência da Associação Portuguesa de Sistemas de Informação (CAPSI 2014) 164
1.3. Self Organizing Maps
A Self Organizing Map (SOM) is a neural network with feed-forward topology and an unsupervised training algorithm that uses a self-organizing process to configure its output neurons, according to the topological structure of the input data [Wasserman 1989].
SOM were first proposed by Tuevo Kohonen in the beginning of the eighties [Kohonen 1982]. He draws some inspiration from the way we believe the human brain works. Research has shown that the cerebral cortex of the human brain is divided into functional subdivisions and that the neural activity decreases as the distance to the region of first activation increases [Kohonen 2001]. Traditional SOM converts the nonlinear statistical relationships that exist in the data into geometric relationships, able to be represented visually [Kohonen 1998, 2001], it can be considered as a visualization method for multidimensional data especially adapted to display the clustering structure [Himberg, 2000], [Kaski et al. 1999], or as a diagram of clusters, [Kohonen 1998].
To detect multiple outliers in multidimensional datasets, a SOM produces a topology preserving mapping of the multidimensional data onto a lower dimensional visualizable plane [Chandola, Banerjee and Kumar 2007]. The objective is to extract the essential structures in a dataset, through a map resulting from an unsupervised learning process [Kaski and Kohonen, 1996], [Kaski, Nikkilä and Kohonen 1998]. Each input data is mapped to one of a large (but fixed) number of nodes, and groups of these nodes (or even just a single one) represent a cluster. The basic SOM training algorithm can be described as follows [Lobo, Cabral and Bação 2007]:
Let:
x be the set of n training patterns x1, x2, ...xn
W be a pxq grid of units wij where i and j are their coordinates on that grid
α be the learning rate, assuming values in the interval ]0,1[, initialized to a given first learning rate r be the radius of the neighborhood function h[wij, wmn, r], initialized to a given first radius Do
1 Repeat 2 For k=1 to n
14ª Conferência da Associação Portuguesa de Sistemas de Informação (CAPSI 2014) 165 4 Select the unit that minimizes dij as the winner wwinner
5 Update each unit wij ЄW: wij = wij + αh[wwinner, wij, r] ||xk - wij|| 6 Decrease the value of α and r
7 Until α reaches 0
The main advantage of SOM is that it allows us to have some idea of data structure and outliers by observing a two dimensional map. This is possible mainly due to preservation of topological relations (e.g. Patterns that are close in the input space will be mapped to units that are close in the output space). In most implementations this is a rectangular grid of units with hexagonal polygons [Kohonen 2001]. Single dimensional SOM is also common to solve problems where an ordering is necessary (e.g. Travelling salesman problem).
1.4. Hierarchical SOM
One approach to improve the small cluster detection is using a Hierarchical SOM (HSOM). HSOM changes the normal interconnections between units. They are often used in application fields where a structured decomposition into smaller and layered problems is convenient (e.g. Data with many variables, grouped by themes). With this method [figure 1] one or more than one lower level SOM are located at each layer, usually operating on different thematic variables [Bação, Lobo and Painho 2008].
HSOM can have several lower level SOM as partial maps that cluster the data according to different characteristics and then pass the results to an upper high level SOM or they may have a lower level global SOM, that acts as a gate mechanism to activate one of several higher level SOM that specialize in a certain area of the input space [Bação et al. 2008].
With the detailed view of clusters found by the low level SOM, we can apply specific measures and solutions. This allows us to know better the problem and prepare the best data treatment.
14ª Conferência da Associação Portuguesa de Sistemas de Informação (CAPSI 2014) 166 Figure 1: Structure of a HSOM (adapted from Bação et al., 2008)Data visualization with SOM
The SOM is a very effective method for clustering via visualization [Flexer 2001]. Is generally based on two-dimensional abstractions such as the U-mat, one of the most used methods [Skupin and Agarwal 2008], or the Kohonen projection method that allows visualizing the data structure. The idea is to use color as a mean of representing distances between reference vectors associated with the SOM units. Units that are near their neighbors are usually represented in a white (or red hot color), units distant from their neighbors are represented in black (or dark blue) [Kohonen 2001].
1.5. Quality of data
The dataset where small clusters are to be detected is the starting point of any outlier detection technique. Input is generally treated as a collection of data objects or data instances [also called a record, point, vector, pattern, event, case, sample, observation, or entity] [Chandola et al.
2007]. Raw data for cluster detection comes mostly from government records and must be pre- processed into a form that is acceptable by a statistical method (e. g. normalization and variable selection) [Li, J., Huang, K. Y., Jin, J., and Shi, J. 2008].
The general approach is by now a familiar one: use historical facts to build a model of outlier behavior and then use data mining techniques to find similar instances of this behavior and cluster them [Cabena, P., Hadjinian, P., Stadler, R., Verhees, J., and Zanasi, A. 1998]. Missing values and incomplete information are common in big data. Some data elements are not collected due to
14ª Conferência da Associação Portuguesa de Sistemas de Informação (CAPSI 2014) 167 omission, irrelevance, excess risk, human error, personal information protection or inapplicability in a specific clinical context. [Li et al. 2008]
2. TOY CASE
The dataset for the case study has some pre-processing to fill in incomplete or missing data. These types of approach require certain properties of the data being used. As a result, it is important to have at least a basic understanding of the different types of data and information that might be met, and how this might guide the choice of a particular analytical approach.
For instance, continuous variables can take an unlimited number of values between lowest and highest values, are very desirable in inferential statistics (parametric statistical methods), but tend to be less useful in data mining; discrete variables have a limited number of possible values. Binary data are a type of discrete data where the information is confined to two possible options (e.g. Male or female, yes or no, 0 or 1). Categorical variables are not easy to use with SOM if not converted to a binary or continuous variable. Understanding the different types of data and variables is important because some of the methods have been designed for particular types of information and may be inappropriate for another type.
To test the model we use a pre-processing dataset with 10.000 random observations of ePrescription database records from January 2012, restricted to the Lisbon Council with 4 relevant variables [all the others are categorical variables or not possible to use without transformation]: Prescription day, dispensing day, medicine final sale value and value pay by patient with the follow descriptive statistics [table 1]:
Type Min Max Var Std Dev Med n DISPENSINGDAY day 1 31 66,531 8,157 19,000 10000 PRESCRIPTIONDAY day 1 31 65,503 8,093 12,000 10000 PATIENTACCEPT value 0 36 23,703 4,869 2,480 10000 SALEPRICE value 0 34 24,664 4,966 3,880 10000
Table 1: Dataset variable statistics
In table 2 we found the Pearson correlation matrix among variables, some of them strongly correlated with others or could indict outlier or unusual observation within variables and this is enough motive for a deeper research on this subject because involves big amounts of money spend by the NHS (National Health Care Service) in reimbursements to pharmacies (and, is some cases, also to patients).
14ª Conferência da Associação Portuguesa de Sistemas de Informação (CAPSI 2014) 168 DI S P E NS IN GD A Y P R ES C R IP T IO N D A Y PA T IE N T A CC E P T SA L E P R IC E DISPENSINGDAY 1 PRESCRIPTIONDAY 0,71 1 PATIENTACCEPT -0,03 -0,01 1 SALEPRICE -0,03 -0,01 0,98 1
Table 2: Pearson correlation matrix
2.1. Results with GeoSOM suite
To get some results with the previously described dataset, we used a SOM variant, the GeoSOM suite. This tool implements the GeoSOM algorithm, which is based on SOM, and has the potential to organize the SOM output space according to the geographic proximities of the input patterns. This way, areas of the geographic map with similar characteristics will warrant a smaller number of units than the areas of the map where characteristics differ a lot. GeoSOM can be viewed as an exploratory technique to build zones, contrary to most zone design algorithms [Horn 1995], [Mehrotra, A., Johnson, E. L., and Nemhauser, G. L. 1998], [Macmillan and Pierce 1994], [Alvanides and Openshaw 1999]. The GeoSOM suite is implemented in Matlab and uses the public domain SOM toolbox [Vesanto, Himberg, Alhoniemi, and Parhankangas 1999],
The GeoSOM suite is freely available at www.isegi.unl.pt/labnt/geosom. It allows multiple analyses to be shown at the same time. For example, one may use several different SOM on the same dataset with different variables, and visually compare the results or create a HSOM as we do in the follow analyses represented on the follow table 3. We can see a lower quantization error on the lower level SOM value and day compare with the SOM all, due to the specialization of the variables used.
SOM Variables Train Neigh Lattice Normalize U-mat Q-error T-error
All all variables Batch Gaussian Hex Variance 40x30 0.1323 0.1851
Value saleprice, patientaccept Batch Gaussian Hex Variance 40x30 0.0014 0.3018
Day dispensingday, prescriptionday Batch Gaussian Hex Variance 40x30 0.0095 0.1289
Hsom SOM value, SOM day Batch Gaussian Hex None 30x20 --- ---
Table 3: SOM details used
We start by training the SOM with 10 interactions using all the variables in the dataset (SOM all). After this first analysis, we can clearly visualize nine clusters of data, one of them with a
14ª Conferência da Associação Portuguesa de Sistemas de Informação (CAPSI 2014) 169 large number of hits [figure 2]. Now we cannot be sure of the presence of more small cluster or outlier of data, because we need more detail. To do that, we need specialized SOM with specific and related variables, and then aggregate the SOM in a hierarchical way (HSOM).
Figure 2: U-mat view of SOM with all variables
The component plans, also show us, the distribution of clusters for each variable [figure3].
Figure 3: Components plans of variables
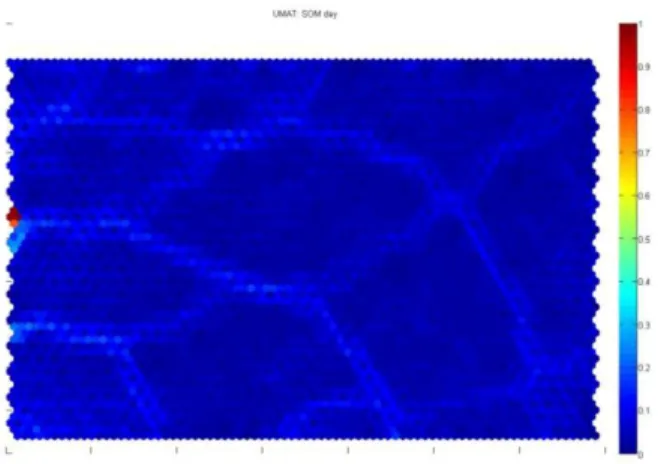
We start the HSOM by creating two low level SOM. In figure 4, we have a U-mat of a SOM with variables dispensing day and prescription day. Just one small cluster detected on left side.
14ª Conferência da Associação Portuguesa de Sistemas de Informação (CAPSI 2014) 170 Figure 4: U-mat view of SOM with day variables
Then we create the second lowest level SOM on figure 5 where we can see the U-mat of a SOM with the variables: sale price and patient accepted pay. Small cluster is detected, but not well defined.
Figure 5: U-mat view of SOM with value variables
In figure 6, we have the final result of the higher level SOM on the HSOM structure resulting from the two previous lower SOM, which indicate a big amount of small cluster of data due to outlier or error observations. We cannot observe those clusters on figures 4 and 5 because the variables are correlated, but when we mix them, new clusters appear, and that indicates outliers observations and should be better investigated.
14ª Conferência da Associação Portuguesa de Sistemas de Informação (CAPSI 2014) 171 Figure 6: U-mat of Hsom with some clusters detected and hits (in purple)
3. CONCLUSIONS AND FUTURE WORK
HSOM applications to detect small clusters can have tremendous potential and usefulness and many of limitations of the past, such as problems with computation power, are no longer so serious. Nevertheless, we need other tools to deeply explore the small clusters detected and identify individual observations, the success of detection hinges on the availability of clean data. In this respect, it is critical that the people consider how data can be better captured, stored, prepared, and mined. Possible directions of further work include the standardization of vocabulary and the sharing of data across organizations to enhance the benefits of this kind of applications. How to detect false positive errors and avoid them is a main issue to save computational time and deserves more attention from researchers. Another problem is the border effect of the SOM, we need to evaluate the quality of the clusters and separation among them.
REFERENCES
Ahmed, M. U., & Funk, P. (2011). Mining rare cases in post-operative pain by means of outlier detection. In Signal Processing and Information Technology (ISSPIT), 2011 IEEE International Symposium, pp. 035-041.
Alvanides, S. & Openshaw, S. (1999). Geographical Information and Planning (Eds, Stillwell, J. C. H., Geertman, S. & Openshaw, S.) Springer-Verlag, pp. 299-315.
14ª Conferência da Associação Portuguesa de Sistemas de Informação (CAPSI 2014) 172 Bação, F., Lobo, V., & Painho, M. (2008). Applications of different self-organizing map variants to geographic information science problems. Self Organizing Maps: applications in geographic information science, pp. 21-44.
Ben-Gal, I. (2005). Outlier detection. Data Mining and Knowledge Discovery Handbook, pp. 131-146.
Cabena, P., Hadjinian, P., Stadler, R., Verhees, J., & Zanasi, A. (1998). Discovering data mining: from concept to implementation. Prentice-Hall, Inc.
Chandola, V., Banerjee, A., & Kumar, V. (2007). Outlier detection: A survey. ACM Computing Surveys, to appear.
Chaudhary, A., Szalay, A. S., & Moore, A. W. (2002). Very fast outlier detection in large multidimensional datasets. In Proceedings of the ACM SIGMOD Workshop in Research Issues in Data Mining and Knowledge Discovery (DMKD).
Ferdousi, Z., & Maeda, A. (2006). Unsupervised outlier detection in time series data. In Data Engineering Workshops, 2006. Proceedings. 22nd International Conference on IEEE. Flexer, A. (2001). On the use of self-organizing maps for clustering and visualization. Intelligent
Data Analysis. Vol. 5 (5), pp. 373-384.
He, Z., Xu, X., Huang, J. Z., & Deng, S. (2004). A frequent pattern discovery method for outlier detection. In Advances in Web-Age Information Management, Springer, Berlin Heidelberg, pp. 726-732.
Himberg, J. (2000). A SOM based cluster visualization and its application for false coloring. In Neural Networks, 2000. IJCNN 2000, Proceedings of the IEEE-INNS-ENNS International Joint Conference. Vol. 3, pp. 587-592.
Hodge, V., & Austin, J. (2004). A survey of outlier detection methodologies. Artificial Intelligence Review. Vol. 22 (2), pp. 85-126.
Horn, M. E. (1995). Solution techniques for large regional partitioning problems. Geographical Analysis. Vol. 27 (3), pp. 230-248.
Ilango, V., Subramanian, R., & Vasudevan, V. (2012). A Five Step Procedure for Outlier Analysis in Data Mining. European Journal of Scientific Research. Vol. 75 (3), pp. 327-339.
Kaski, S., & Kohonen, T. (1996). Exploratory data analysis of the self-organizing map: Structures of welfare and poverty in the world. Neural networks in financial engineering. Proceedings of the third international conference on neural networks in the capital markets.
14ª Conferência da Associação Portuguesa de Sistemas de Informação (CAPSI 2014) 173 Kaski, S., Venna, J., & Kohonen, T. (1999). Coloring that reveals high-dimensional structures in data. In Neural Information Processing, 1999. Proceedings. ICONIP'99. 6th International Conference. Vol. 2, pp. 729-734.
Kaski, S., J. Nikkilä & T. Kohonen (1998). Methods for interpreting a Self Organizing Maps in data analysis. Proceedings of ESANN'98, 6th European Symposium on Artificial Neural Networks, Bruges, Belgium, D-Facto.
Kohonen, T. (1982). Self-organizing formation of topologically correct feature maps. RecMap: rectangular map approximations. Vol. 43 (1), pp. 59-69.
Kohonen, T. (1998). The self-organizing map. Neurocomputing. Vol. 21 (1), pp. 1-6. Kohonen, T. (2001). SOM, Vol. 30. Springer Verlag.
Li, J., Huang, K. Y., Jin, J., & Shi, J. (2008). A survey of statistical methods for health care outlier detection. Health care management science. Vol. 11 (3), 275-287.
Lobo, V., Cabral, P., & Bação, F. (2007). Self Organizing Maps for urban modelling. In Proceedings. 9th International Conference on Geocomputation.
Macmillan, W. D. & Pierce, T. (1994) In Spatial Analysis and GIS (Eds, Fotheringham). Mehrotra, A., Johnson, E. L., & Nemhauser, G. L. (1998). An optimization based heuristic for political districting. Management Science. Vol. 44 (8), pp. 1100-1114.
Skupin, A., & Agarwal, P. (2008). Introduction: What is a Self‐Organizing Map?. Self-organizing maps: Applications in geographic information science, pp. 1-20.
Vesanto, J., Himberg, J., Alhoniemi, E., & Parhankangas, J. (1999). Self-organizing map in Matlab: the SOM Toolbox. In Proceedings of the Matlab DSP conference. Vol. 99, pp. 16-17. Wasserman, P. D. (1989). Neural computing: Theory and practice. Van Nostrand Reinhold, New
York, pp. 44-54
Yang, W. S., & Hwang, S. Y. (2006). A process-mining framework for the detection of health care outlier and abuse. Expert Systems with Applications. Vol. 31 (1), pp. 56-68.