Ensaios Econômicos
EPGE Escola Brasileira de Economia e Finanças N◦ 820 ISSN 0104-8910Social Distancing, Temperature, BCG and
the Evolution of Covid-19: A Panel-Model
Analysis
Eduardo Lima Campos, Rubens Penha Cysne, Alexandre Madureira
October de 2020
Social Distancing, Temperature,
BCG and the Evolution of Covid-19: A Panel-Model
Analysis/ Eduardo Lima Campos, Rubens Penha Cysne,
Alexandre Madureira – Rio de Janeiro: FGV EPGE, 2020
12p. - (Ensaios Econômicos; 820) Inclui bibliografia.
1
Social Distancing, Temperature, BCG and the Evolution of Covid-19: A Panel-Model Analysis
Eduardo Lima Campos
1Rubens Penha Cysne
2Alexandre Madureira
3Abstract
Background: This work presents results concerning the impact of some variables mentioned in
the literature on the daily variation rate of cases (per million inhabitants) of COVID-19, based on a large sample of countries and an empirical model with appropriate control factors. We also propose indicators for measuring social distancing and BCG (Bacilo Calmette-Guérin) vaccine immunization.
Methods: A statistical panel-model was applied to daily data for 165 countries from January 22
to July 31, 2020. Besides, two indicators are constructed for each country in the sample. The first of them measures social distancing, based on percentage of people circulating on transport stations, as a proportion of the circulation in a period before pandemic. The second indicator proposed estimates the current percentage of people immunized by BCG vaccine, based on the historical coverage and demographic factors.
Results: We estimate that a strict social distancing may be associated with a reduction of around
6 percentage points in the daily variation rate of cases per million of COVID-19. Besides, the effects of temperature and BCG immunization proved to be statistically significant at the usual levels, indicating that lower temperatures and a low (or a lack of) BCG immunization may be related to increases in the daily variation rate of cases (per million inhabitants) of COVID-19.
Conclusions: The analysis made clear the role of social distancing to control the pandemic. In
addition, the method used did not allow to exclude the hypothesis that the evolution of COVID-19 may be positively associated with lower temperatures and a low (or a lack of) BCG immunization.
Keywords:
COVID-19
, Pandemic, Growth Rate, Temperature, Social Distancing, BCG. JEL classification codes: C13; C33; I18Background
Introduction and Objective
The governments of several countries affected by COVID-19 (Coronavirus Disease 2019) have been introducing social distancing policies on different levels. Considering the negative economic impacts of these policies, it is important to measure how important is the level of social distancing to control the pandemic.
Additionally, some empirical studies indicate that the incidence of the H3N2 and H1N1 viruses and other variants of influenza would be greater in regions and/or periods of lower temperature
* Eduardo Lima Campos – email: [email protected]
1 EPGE Brazilian School of Economics and Finance (FGV EPGE) and National School of Statistical Sciences
(ENCE/IBGE), Rio de Janeiro, Brasil.
2 EPGE Brazilian School of Economics and Finance (FGV EPGE), Rio de Janeiro, Brasil.
3 EPGE Brazilian School of Economics and Finance (FGV EPGE) and National Scientific Computing Laboratory
2 and humidity. Then, it is also worthwhile to investigate whether or not a similar pattern is observed, concerning the transmission of COVID-19.
Another hypothesis raised in the literature is whether the BCG vaccine would be able to offer some protection against COVID-19. If this is true, countries with no BCG vaccination programs tend to present more cases of the disease. This aspect was also investigated in this study.
The objective of the present work is to investigate and measure the possible association between the above variables and the daily variation rate of cases of COVID-19, using a statistical model for panel data. This study adds to the correlated literature by proposing indicators for social distancing and BCG immunization; by using a wide set of control variables and, regarding the sample, by covering data for 165 countries over 192 days, a larger scope than other related works. The study makes clear the importance of social distancing in the mitigation or suppression of the pandemic. Additionally, the results suggest that lower temperatures and/or less BCG vaccination immunization may be related to an increase in the daily variation rate in registered cases per million. It is worth mentioning that these results were reached by using controls for a variety of other possible variables that, according to the literature, might also affect the evolution of COVID-19.
Finally, one must keep in mind that, given the absence of underlying epidemiological models for our analysis, the results obtained here should not be used for the definition of policies without being complemented by additional studies in related areas.
Bibliographic Review
Below we present the bibliographic review detailing the effects of each one of the main variables considered in this work on the evolution of COVID-19.
Effects of Social Distancing
Several recent studies investigate the effect of social distancing on the evolution of COVID-19. They use different kinds of measures. [3] incorporate the effects of social distancing by the basic reproduction number4, evaluating the outcomes from different simulated conditions, allowing to
assess how the mortality rate changes when the social distancing is more effective. [2] use a variable that represent the use of air transport system, considering information on 122 airports in Brazil. [16] construct their social distance measure with the American Time Use Survey (ATUS), only for the U.S. citizens across American states, which accounts for the number of minutes they spend time in activities that could potentially expose them to crowds. [10] use census data to get the distribution of workplaces, households and school, and make assumptions about these variables, using them to parameterize the patterns of contact of people among themselves. [21] study the growth changes in COVID-19 cases before and after the implementation of social distancing measures in the U.S., by using data on school closures, closures of workplaces, cancellation of public events, etc. [14] use the variation of circulation in work places, from Google COVID-19 Community Mobility Reports database.[1] use a binary variable that indicates if a country has implemented partial or complete lockdown measure for its population, and also consider a variable that represents the number of days since implementation of the policy. Effects of Climate Variables
The influence of temperature and humidity on the evolution of the pandemic is addressed in several studies. Some examples are [11], [23], [5], [20] and [4]. A general result of these works is that a reduction in the variation rate of COVID-19 cases per million may be associated with an
3 increase in temperature. The present work intends to investigate this relationship further, using selected control variables that allows to isolate their impacts from those of other confusion factors. Effects of BCG
Some authors investigate the relation between BCG vaccination immunization with the COVID-19 evolution. [17] and [19] categorize the BCG coverage as a binary variable: countries with universal policies of BCG vaccination and countries that never had this program. [13] make a comparison with the number of cases of the disease (per 100 thousand inhabitants) between an Israeli generation that was vaccinated and another that was not. [7] mention mechanisms by which BCG immunization reduces the severity of infections caused by other viruses, from controlled studies. These authors recommend randomized studies to investigate a relationship between COVID-19 and BCG immunization. [12] merged country-age-level case statistics with the start/termination years of BCG vaccination policy and their respective types of strains used, and conducted a regression discontinuity and a difference-in-difference analysis to verify the hypothesis of the BCG effect.
A common aspect of all these works is that they only verify whether or not a country has a current BCG vaccination program. However, there are countries that have recently interrupted their programs, so that a large part of the population that had been vaccinated would still be immune. Then, [15] use a third category in their study: countries that interrupted the vaccination program. A remaning problem, nevertheless, is that this variable classifies countries with very different percentage of BCG immune population in the same level. For example, countries that had stopped their vaccination programs decades ago or more recently would be in the same category. It is important to mention that preliminary studies by World Health Organization [(24)] do not corroborate, but neither rule out, a relationship between BCG immunization and COVID-19.
Our Contribution
The present study estimates the impacts of some variables mentioned in the literature on the evolution of COVID-19 by a statistical panel-data model, using appropriate control factors. Besides, we contribute with the definition of two indicators: the first measures social distancing, based on the percentage of people circulating on transport stations in relation to the period before pandemic (obtained from GPS data mapping). The other indicator proposed estimates the percentage of people immunized by the BCG vaccine in each country, based on the historical coverage in the last year in which the vaccination program was effective, properly updated by demographic projections.
Methods
Data
We present below the variables considered in the study and, in the case of social distancing and BCG immunization, the specific indicators constructed.
Cases of COVID-19 (per Million of Inhabitants)
The daily number of new cases of COVID-19 (per million5) was obtained from the World Health
Organization website6, for 165 of the 202 countries that had registered cases up to July 31, 2020.
5Cases per million = (Number of Cases/Population) *1,000,000. We consider cases per million of inhabitants, since a
country X with the same growth rate as another country Y, but with a larger population, will tend to present more cases.
4 Climate Variables
The data were taken from the National Centers for Environmental Information (NOAA NCEI)7,
by using the Global Summary of the Day dataset. Daily average temperature, daily dew point temperature8 and total precipitation for each weather station of each country were collected. Then,
the daily average temperature, average dew point temperature and total precipitation for each country (in general) was calculated by taking the simple average of these weather stations. The relative humidity was calculated with the formula presented by [5].
Social Distancing
In the present work, the social distancing measure used data collected from the Google COVID-19 Community Mobility Reports database, whichrepresents daily percentage variations of some variables, compared to a baseline given by a pre-pandemics period in early 2020, from 03/01 to 06/029. For example, if in the day t, there is a value -5% in the mobility, it means that there are
5% less people on the streets, in relation to the baseline value (the median in the baseline period). The data is divided into six categories, useful for social distancing efforts, as well as the access for essential services. They are as follows: markets and grocery, parks, public transport stations, recreation, residential and work places. For the purpose of this work, the public transport stations category, which captures the trend of mobility through public transport terminals, was chosen as the best proxy for social distancing10. This was done because of the strong relation observed in the sample between this proxy and the distancing measures effectively announced by the countries. In fact, the more people use public transportation, the more they go to places of work, recreation or residential places, for instance, so this proxy is expected to be related with most of the others.
The next step was to create a variable called Circulation Index, CIit,defined as the inverse measure of social distancing (the greater the distancing, the lower the circulation)11. After a sequence of
statistical tests, the clearest effects were observed when the variable was divided into two categories: circulation less than 40% and greater or equal to 40%, assuming value 1 in the first case and 0 in the second. Thus, we created the following binary variable, called strict distancing:
SDit= {
1, if CIit< 40% 0, if CIit≥ 40%.
To illustrate, Figure 1 presents the case of Italy, showing the evolution of cases per million and the Circulation Index, that, in a certain period, dropped to levels below than 40%.
7 https://www.ncdc.noaa.gov/cdo-web/datatools/selectlocation. 8
The dew point temperature is the one at which air is saturated with water vapor. In other words, relative humidity is 100% when the dew point temperature is equal to the actual temperature.
9 https://www.google.com/covid19/mobility/. The availability of these data is limited by the Locating History tool on
Google accounts, which must be turned on for this purpose, and they are anonymized.
10 [14] use the same dataset, however they consider the work places category.
11 This variable was considered with a 21-day lag time, that was the period identified, after a careful study, as the best
suited to start reflecting the impact of the distancing measures on registers of COVID-19. Then, CIit denotes the
5
Fig. 1 COVID-19 (cases per million) x Circulation Index (CI) - The Case of Italy
In the beginning of the sample, we note a clear relation between the strict social distancing (CI falling below 40%, in mid-March) and a fall, after a certain time lag, of the number of cases of COVID-19 (end of March and the beginning of April). Nevertheless, as the distancing measures relax (early May), the circulation index returns to levels above 40%, with increasing trajectory. The rate of change in cases per million, then, stop decreasing and stabilizes (with an expected time lag) in positive values, reaching a slight growth trend at the end of the sample, when the circulation index approaches 90%. It is important to highlight that a positive rate of variation, although stable, means a continuous increase in the number of cases per million of COVID-19. BCG Vaccine Immunization
As highlighted in the bibliographic review, in order to investigate the relation between BCG immunization and COVID-19, it is not enough to verify whether or not a country has a current BCG vaccination program, since, in countries that have recently interrupted their programs, a large part of the population that had already been vaccinated would still be immune. In the present study, we created a variable “BCG immunization” to reflect the current proportion of immunized people.
To construct this variable, we initially attributed a value of zero to countries that have never had public vaccination policy for BCG (examples: USA and Italy)12. Next, for countries that have an
active vaccination program (Brazil and China), the historical average percentage of BCG coverage was used13. Finally, we consider the countries with a vaccination program that had been
interrupted as of some point in time (Australia and a large number of European countries). In these cases, the proportion of people currently immunized was estimated using the historical average coverage recorded up to the year the program was interrupted and demographic factors. For example, Portugal interrupted its vaccination campaign in 2016, and in that year the average historical coverage for the BCG vaccine was 86%. The total population of Portugal in 2016 was 10.36 million people, of which 8.91 million people had been vaccinated. The next step was to estimate the number of immunized people who died since then, applying the death rate for each year14. It led to approximately 281 thousand immune people died. Subtracting this number from
12 http://www.bcgatlas.org. 13 https://www.who.int/data/gho/indicator-metadata-registry/imr-details/2442. 14 https://data.worldbank.org/indicator/SP.DYN.CDRT.IN. 0 0.2 0.4 0.6 0.8 1 1.2 0 20 40 60 80 100 120 1 5 /fe b 2 6 /fe b 0 8 /m a r 1 9 /m a r 3 0 /m a r 1 0 /a p r 2 1 /a p r 0 2 /m a y 1 3 /m a y 2 4 /m a y 0 4 /j u n 1 5 /j u n 2 6 /j u n 0 7 /j u l 1 8 /j u l 2 9 /j u l CI ca se s p e r m ill io n
6 the 8.91 million people who had been received the BCG vaccine, we estimated that 8.63 million people are still immune in Portugal. On the other side, over the same period, the total population of Portugal decreased from 10.36 million to 10.28 million people, now. Finally, to get the proportion of people still immune in the country, we divide 8.63 by 10.28, thus finding 83.89%. An important point in the present study is the incorporation of adequate control variables, or confusion factors: the proportion of elderly people in the population, days after the first case, the capacity of the healthcare system, climate variables and others, all of which are described below. Proportion of Elderly People (> 65 Years Old)
Many references indicate the greater effect the disease has on elderly people, resulting in a higher recording of cases of COVID-19 in populations with a higher elderly percentage (see, for example, [22]). A control variable was used for the proportion of elderly people (people over 65, in relation to the total population) registered in each country, according to World Bank data15. Days Since First Case
This variable refers to the number of days counting from the first day that a case of COVID-19 was recorded in each country until the last day of the sample16.
The objective of incorporating this variable into the model is to control for the effect of the natural advance of the disease over time, independent of variations in the values of the other explanatory variables. For example, a reduction in the average temperature in a country, followed by an increase in the growth rate of COVID-19, would lead to a spurious association between transmission and temperature. This is because a natural elevated growth rate is expected in the initial stages of the pandemic - right after the first case registered - independent of any variation in temperature. [6], for example, establish that infection by COVID-19, in its initial phase, manifests in a very fast evolution, in which the pandemic presents transmission patterns similar to those of influenza, where the contagious phase occurs right after the first symptoms appear. Capacity of the Healthcare system
Here we consider the number of hospital beds17, obtained from the World Bank website18. To
enable a comparison between countries with different populations, we used a metric that considers the quantity of beds per thousand inhabitants. It is conjectured that, the better prepared the healthcare system of a country, the better it will be able to treat people and reduce contagion. Other Variables
Additional variables considered included: testing capacity, income, pollution levels, rainfall, range of transportation system, and whether or not the country had experienced an epidemic recently. However, none of these variables proved to be statistically significant, at the usual levels.
Model
We used a statistical model for panel data. The dependent variable is the logarithmic variation rate of the number of new cases per million inhabitants, between the days t-1 and t, registered in the country i, this being: Yit = ln (
Cit
Ci,t−1), in which Cit is the number of cases per million of
15 https://data.worldbank.org/indicator/SP.POP.65UP.TO.ZS.
16 https://ourworldindata.org/grapher/daily-cases-covid-19?tab=map&year=2020-05-11.
17 Beds for admission into hospitals and public, private, general and specialized rehabilitation centers. 18 https://data.worldbank.org/indicator/SH.MED.BEDS.ZS
7 COVID-19 registered in the country i on day t19. Studies that employ similar dependent variables
are, for example, [21], [8], [2], [18] and [9]. The equation for the model is presented as follows:
Y
it= γ
i+ γ
i𝐭 + ϕ
t+ θ’𝐗 + ε
it (2)where i is the country index (i = 1 to 165); t is the index that represents the day (t = 1 to 192, where t = 1 corresponds the January 22, 2020, t = 192 corresponds to July 31, 2020); γi, ϕt and γi𝐭 represent the effects between countries (intercept and trend) and over time, respectively20; 𝐗 and θ contain, respectively, all the variables described in data sub-section and their coefficients. Initially, a procedure for the selection of variables was implemented via F tests, using a backwise methodology (general to specific) and considering a level of significance of 0.05 as a reference. In all steps, we applied the usual correction for heteroscedasticity and serial autocorrelation errors. The following variables were significant at the 0,05 level: Tempit = average temperature in
country i and on day t; BCGi = estimated proportion of the population current immunized by BCG
in country i; FCit = number of days since the first case of COVID-19 was registered in the country
i; SDit = binary variable that indicates whether or not there is strict social distancing, as previously
described21; EP
i = proportion of elderly people (aged 65 or greater) in country i; HMit = average
humidity (103 hPA Kg/Kg); HB
i = number of ICU (intensive care units) beds per thousand people,
in addition to interaction (TempitSDit, FCitSDit, EPitBCGi) and non-linear (Tempit2) effects.
Results
The final estimated model is as follows22:
Yit =0,01097 - 0,000093Tempit + 0,00002Tempit2 - 0,06024SDit + 0,00027FCit + 0,00024TempitSDit+ 0,00008FCitSDit + 0,03541EPi
- 0,00196BCGi + 0,0207EPitBCGi - 0,00007HMit - 0,00102HBi
d
(3)
where Cit is the number of cases per million in country i and day t and Yit = ln (
Cit
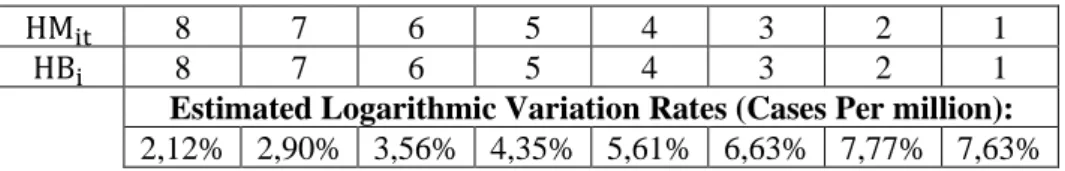
Ci,t−1) is its logarithmic growth rate between days t-1 and t. We analyze the effects of each variable below. Tables 1 and 2 below compare the estimated log-variation rates for countries with and without strict social distancing, according to the definition adopted here, considering different scenarios23.
Table 1 - Estimated Growth Rates - Countries/Periods without Social Distancing Scenarios (Possible Values for the Explanatory Variables)
Tempit 25 20 15 10 5 0 -5 -10
EPi 0.02 0.06 0.1 0.14 0.18 0.22 0.26 0.3
BCGi 1 0.8 0.7 0.6 0.5 0.4 0.2 0
FCit 30 50 70 90 120 140 160 180
19 The logarithmic rate is a proxy for: Y
it = (Cit− Ci,t−1)/Ci,t−1. 20 The effects γ
i, invariant over time, allow for capturingdifferences between countries that have not been explicitly
incorporated in the modelling (for example, because they are not possible to observe or difficult to measure). Examples include habits related to hygiene and social interaction. The fixed effects ϕt, which do not vary among countries, allow
for capturingglobal changes over time, such as information about the disease and meteorological conditions.
21 Remember that SD
it = 1, if the people circulating on streets in relation to the level prior to the pandemic is less than
40%, in country i and t-21 days before (a 21-day lag time is considered, see footnote 10); and SDit = 0, otherwise. 22 Only the results relevant for the discussion of the theme of the work are reported. It is worth mentioning that, in
addition to the fixed effects, a weekend dummy was also used to correct the effects of underreporting on these dates.
8
HMit 8 7 6 5 4 3 2 1
HBi 8 7 6 5 4 3 2 1
Estimated Logarithmic Variation Rates (Cases Per million):
2,12% 2,90% 3,56% 4,35% 5,61% 6,63% 7,77% 7,63%
Table 2 - Estimated Growth Rates - Countries/Periods with Strict Distancing Scenarios (Possible Values for the Explanatory Variables)
Tempit 25 20 15 10 5 0 -5 -10 EPi 0.02 0.06 0.1 0.14 0.18 0.22 0.26 0.3 BCGi 1 0.8 0.7 0.6 0.5 0.4 0.2 0 FCit 30 50 70 90 120 140 160 180 HMit 8 7 6 5 4 3 2 1 HBi 8 7 6 5 4 3 2 1
Estimated Logarithmic Variation Rates (Cases Per million):
-3,06% -2,65% -2,10% -1,43% -0,30% 0,61% 1,63% 2,80%
Discussion
Coefficients Interpretation
The magnitude of the temperature effect depends on the values of SDit and Tempit, since both
interaction and non-linear terms (TempitSDit and Tempit2) were significant. Besides, for most of the values in sample, it follows that lower temperatures might favor the epidemic evolution. The negative coefficient for the BCGi variable indicates the expected effect of BCG vaccination
immunization on the growth rate of COVID-19, meaning that, all things being equal, the data used here make it impossible to deny the hypothesis that populations with a higher percentage of immunization experience a milder evolution of the disease. Nevertheless, just as in the case of temperature, the calculation of the impact is not direct, and depends, in this case, on the EPi value,
since the coefficient of EPitBCGi is significant. Particularly, the effect of BCG is attenuated as the population ages. This result makes sense, since the vaccine is applied to children and, after many years, the elderly may no longer be immunized.
The coefficient of the variable EPi indicates that, the greater the elderly population, the greater the growth rate for COVID-19. Despite the fact that a greater number of records in elderly people is expected, the presence of this variable in the model is essential for isolating the estimation of the other impacts. In particular, the BCG effect depends directly on the value of EPi.
The two remaining control variables that proved to be significant were humidity and the number of ICU beds (per thousand people), HBi. The first one indicates that the evolution of the disease is more severe in drier climates. This result is in line with [23] (see also [11])24. The significance
and signal of the HBi coefficient indicates that, as expected, the greater the capacity of the healthcare system is, the more prepared the country will be to isolate and treat contaminated people, thus reducing the probability of transmission. The variable HBi is also correlated with income, which may explain the exclusion of this variable in the final model25.
24 On the other hand, [4] and [20] do not find evidence that the humidity level of the air will have an effect on the
growth rate of COVID-19.
9 It is worth mentioning the importance of specifying a model with adequate control variables. In addition to those mentioned above, the variable FCit plays also a very important role: controlling
for the fact that different countries in sample are, each day, in distinct phases of the pandemic26.
Effects of Social Distancing on the Evolution of COVID-19
Concerning the effects of social distancing policies, as already mentioned, the expected causal impact is confirmed, but only when the circulation variable is categorized in two levels: circulation less than 40% and greater or equal to 40% (in relation to the value prior to the pandemic)27.
We observe, in table 2, a strong reduction in the log-variation rates, as compared to those in table 1, suggesting a potential effect of a strict social distancing. For example, considering the scenario in column 4, the rate decreases from 4.35% to -1.43%, a drop of almost 6 percentage points. From equation (3), we see that the effect of a strict social distancing depends on the temperature and the number of days since the first registered case of COVID-19. This is because of the significance of the TempitSDit and FCitSDit coefficients. It is also worth mentioning that, for all cases in sample, independent from Tempit and FCit values, we observed a reduction effect of the strict social distancing on the variation rate of cases per million of COVID-19. In addition, the positive coefficient of TempitSDit indicates that the strict social distancing not only may contribute to reduce the growth rate of the disease, but also to reduce the impact of temperature on this rate.
Specifically, with a strict social distancing (as defined here), may be associated a reduction of 100*(0,06024 - 0,00008FCit - 0,00024Tempit) percentage points in the variation rate of cases per million of the disease.
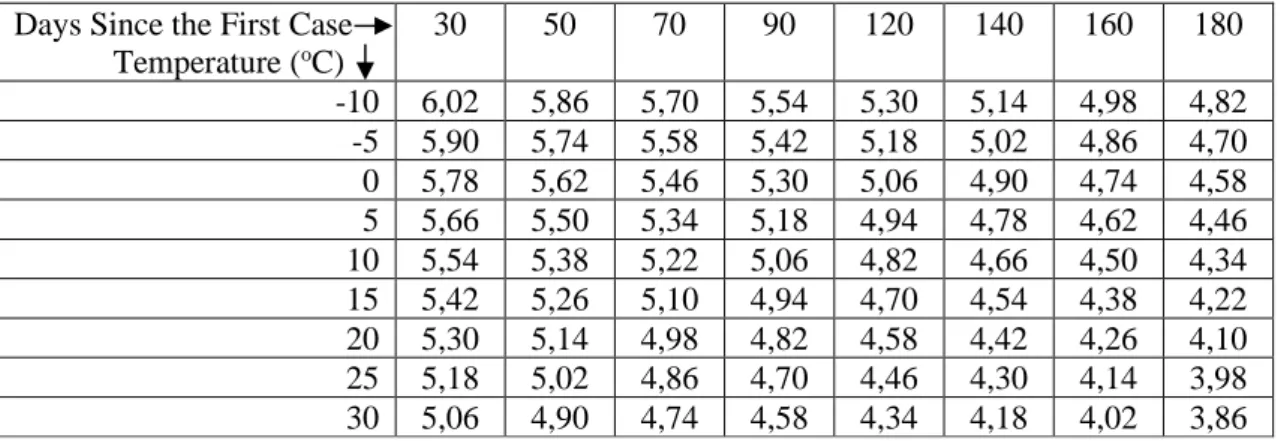
Table 3 reports the effects of strict social distancing, considering different values for temperature and the number of days since the first case.
Table 3 - Reduction (p.p.) in the Daily Growth Rate of COVID-19, Associated with a Strict Social
Distancing Days Since the First Case
Temperature (oC) 30 50 70 90 120 140 160 180 -10 6,02 5,86 5,70 5,54 5,30 5,14 4,98 4,82 -5 5,90 5,74 5,58 5,42 5,18 5,02 4,86 4,70 0 5,78 5,62 5,46 5,30 5,06 4,90 4,74 4,58 5 5,66 5,50 5,34 5,18 4,94 4,78 4,62 4,46 10 5,54 5,38 5,22 5,06 4,82 4,66 4,50 4,34 15 5,42 5,26 5,10 4,94 4,70 4,54 4,38 4,22 20 5,30 5,14 4,98 4,82 4,58 4,42 4,26 4,10 25 5,18 5,02 4,86 4,70 4,46 4,30 4,14 3,98 30 5,06 4,90 4,74 4,58 4,34 4,18 4,02 3,86 To illustrate, a country with average temperature of 25oC, where the first case was registered 90
days ago, may have, associated with a strict social distancing, a reduction of 4.7 percentage points in the variation rate of cases per million of COVID-19. The effects vary from 3,86 to 6,02.
26 The omission of relevant control variables leads to inconsistent estimators for the model coefficients, so that the
respective estimates would not have a practical application. A quadratic term was also considered to capture the drop in the growth rate in some countries at the end of the sample, but it was not statistically significant at the usual levels.
27
10 Considering the mean values in sample, we estimate that a strict distancing may be associated with a reduction of 5.97 percentage points in the growth rate of cases per million of COVID-19.
Conclusions
The main result of this work is the potential association between a strict social distancing (defined here as a people circulation less than 40%) and a reduction in the evolution of cases of COVID-19, in accordance with the current debate about the importance of social distancing for controlling the pandemic. We estimate that a strict social distancing may be associated with a reduction of around 6 percentage points in the log-variation rate of cases per million of the disease. Besides, the data and the method adopted do not allow to exclude the hypothesis that the evolution of cases of COVID-19 may be positively related with low temperatures and a low BCG immunization. The results presented here reflect the use of statistical techniques, as there is no underlying model of an epidemiological nature to allow more specific conclusions. In the absence of this type of complementary information, these results are insufficient for the formulation of public policies. The authors suggest that it may be worthwhile to give continuity to this work in the future, with more recent data. This is particularly important in view of the new geographic characteristics where the pandemic has spread, with a strong impact, for example, in Brazil.
Declarations
Acknowledgements
The authors thank Carlos Henrique Dias for research assistance.
Ethics approval and consent to participate
No ethics approval was required for this study. The data were obtained from a publicly accessible database.
Consent for publication
Not applicable.
Abreviation
BCG: Bacille Calmatte-Guérin; ICU: intensive care unit;WHO = World Health Organization;
Covid-19 = Coronavirus Disease 2019; BCG (Bacilo Calmette-Guérin).
Competing Interests
The authors (Eduardo Campos, Rubens Cysne and Alexandre Madureira) hereby declare that there is no competing Interests
Funding
This study was financed in part by the Coordenação de Aperfeiçoamento de Pessoal de Nível Superior - Brasil (CAPES) - Finance Code 001.The funding organization had no role in the designing, implementation or interpretation of the study.
Availability of data and materials
The datasets used and/or analyzed during the current study are available from the corresponding author on reasonable request.
Authors’ contributions
11
References
1. Alfano V, Ercolano, S. The Efficacy of Lockdown Against COVID-19: A Cross-Country Panel Analysis. Applied Health Economics and Health Policy. 2020;18:509-517.
2. Baumgartner MT, Lansac-Toha FM, Coelho MTP, Dobrovolski R, Diniz-Filho JAF. Social distancing and movement constraint as the most likely factors for COVID-19 outbreak control in Brazil. medRxiv. 2020; https://doi.org/10.1101/2020.05.02.20088013
3. Cano OB, Moralles SC, Bendtsen C. COVID-19 Modelling: the Effects of Social Distancing. medRxiv. 2020; https://doi.org/10.1101/2020.03.29.20046870
4. Carleton T, Meng KC. Causal empirical estimates suggest COVID-19 transmission rates are highly seasonal. medRxiv. 2020; https://doi.org/10.1101/2020.03.26.20044420.
5. Chen N, Zhou M, Dong X, Qu J, Gong F. Epidemiological and clinical characteristics of 99 cases of 2019 novel coronavirus pneumonia in Wuhan, China: a descriptive study. The Lancet. 2020;395:507-513.
6. Cowling BJ, Leung GM. Epidemiological research priorities for public health control of the ongoing global novel coronavirus (2019-nCoV) outbreak. Eurosurveillance.2020;25:1–5.
7. Curtis N, Sparrow A, Ghebreyesus TA, Netea MG. Considering BCG vaccination to reduce the impact of COVID-19. The Lancet. 2020;6736:19–20.
8. Ding W, Levine R, Lin C and Xie W. Corporate immunity to the COVID-19 pandemic. National Bureau of Economic Research. 2020; http://dx.doi.org/10.2139/ssrn.3578585
9. Dropkin G. COVID-19 UK Lockdown Forecasts and R0. Frontiers in Public Health. 2020; 8:256. 10. Ferguson N Laydon D, Nedjati Gilani G, Imai N, Ainslie K, Baguelin M, Dighe A. Report 9: Impact
of non-pharmaceutical interventions (NPIs) to reduce COVID19 mortality and healthcare demand, 2020. https://doi.org/10.25561/77482. Imperial College COVID-19 Response Team]
11. Fredericks B. Top DHS scientists says heat, humidity slow coronavirus. In: New York Post. 2020. https://nypost.com/2020/04/23/top-dhs-scientists-says-heat-humidity-slow-coronavirus/. Accessed 5 aug 2020.
12. Fukui M, Kawaguchi K, Matsuura H. Does TB Vaccination Reduce COVID-19 Infection?: No Evidence from a Regression Discontinuity Analysis. SSRN Electronic Journal. 2020; http://dx.doi.org/10.2139/ssrn.3572090.
13. Hamiel U, Kozer E; Youngster I. SARS-CoV-2 Rates in BCG-Vaccinated and Unvaccinated Young Adults. JAMA. 2020; doi:10.1001/jama.2020.8189.
14. Maloney WF, Taskin T. Determinants of Social Distancing and Economic Activity during COVID-19: A Global View (English). Policy Research working paper; no. WPS 9242; COVID-19 (Coronavirus). Washington, D.C.: World Bank Group, 2020;1.
15. Miller A, Reandelar MJ, Fasciglione K, Roumenova V, Li Y, Otazu GH. Correlation
between universal BCG vaccination policy and reduced morbidity and mortality for COVID-19: an epidemiological study. 2020; doi:10.1101/2020.03.24.20042937.
16. Price GN, VAN HOLM E. The Effect of Social Distancing On the Spread of Novel Coronavirus: Estimates from Linked State-Level Infection and American Time Use Survey Data, 2020. ResearchGate 10.13140/RG.2.2.30632.32007.
17. Sala G, Miyakawa T. Association of BCG vaccination policy with prevalence and mortality of COVID-19. medRxiv. 2020; https://doi.org/10.1101/2020.03.30.20048165.
18. Sevi S, Aviña MM, Péloquin-Skulski G, Heisbourg E, Vegas P, Coulombe M, Arel-Bundock V, Loewen PJ, Blais A . Logarithmic versus Linear Visualizations of COVID-19 Cases Do Not Affect Citizens’ Support for Confinement. Canadian Journal of Political Science/Revue Canadienne De Science Politique. 2020; https://doi.org/10.1017/S000842392000030X.
12
19. Shet A, Ray D, Malavige N, Santosham M, Bar-Zeev N. Differential COVID-19-attributable mortality and BCG vaccine use in countries. medRxiv. 2020; https://doi.org/10.1101/2020.04.01.20049478. 20. Shi P, Dong Y, Yan H, Li X, Zhao C, Liu W, He M, Tang S, Xi S. The impact of temperature and
absolute humidity on the coronavirus disease 2019 (COVID-19) outbreak - evidence from China. medRxiv. 2020; https://doi.org/10.1101/2020.03.22.20038919.
21. Siedner MJ, Harling G, Reynolds Z, Gilbert RF, Haneuse S, Venkataramani A, Tsai AC. Social distancing to slow the U . S . COVID-19 epidemic : interrupted time-series analysis. medRxiv. 2020; https://doi.org/10.1101/2020.04.03.20052373.
22. Singhal TA. Review of Coronavirus Disease-2019 (COVID-19). Indian Journal of Pediatrics. 2020;87:281–286.
23. Wang J, Tang K, Feng K, Lin X, Lv W, Chen K, Wang F. High Temperature and High Humidity Reduce the Transmission of COVID-19. SSRN Electronic Journal. 2020; http://dx.doi.org/10.2139/ssrn.3551767.
24. Bacille Calmette-Guérin (BCG) vaccination and COVID-19. In: WHO. 2020, http://www.who.int/news-room/commentaries/detail/bacille-calmette-guérin-(bcg)-vaccination-and-covid-19. Accessed 8 May 2020.
Os artigos publicados são de inteira responsabilidade de seus autores. As
opiniões neles emitidas não exprimem, necessariamente, o ponto de vista da
Fundação Getulio Vargas.
EPGE Escola Brasileira de Economia e Finanças
Diretor Geral: Rubens Penha Cysne Vice-Diretor: Aloisio Araujo
Coordenador de Graduação: André Arruda Villela
Coordenadores de Pós-graduação Acadêmica: Humberto Moreira & Lucas Jóver Maestri Coordenadores do Mestrado Profissional em Economia e Finanças: Ricardo de Oliveira Cavalcanti & Joísa Campanher Dutra