Repositório ISCTE-IUL
Deposited in Repositório ISCTE-IUL:
2019-03-26
Deposited version:
Post-print
Peer-review status of attached file:
Peer-reviewed
Citation for published item:
Vicente, P. & Reis, E. (2016). Profiling public transport users through perceptions about public transport providers and satisfaction with the public transport service. Public Transport. 8 (3), 387-403
Further information on publisher's website:
10.1007/s12469-016-0141-z
Publisher's copyright statement:
This is the peer reviewed version of the following article: Vicente, P. & Reis, E. (2016). Profiling public transport users through perceptions about public transport providers and satisfaction with the public transport service. Public Transport. 8 (3), 387-403, which has been published in final form at
https://dx.doi.org/10.1007/s12469-016-0141-z. This article may be used for non-commercial purposes in accordance with the Publisher's Terms and Conditions for self-archiving.
Use policy
Creative Commons CC BY 4.0
The full-text may be used and/or reproduced, and given to third parties in any format or medium, without prior permission or charge, for personal research or study, educational, or not-for-profit purposes provided that:
• a full bibliographic reference is made to the original source • a link is made to the metadata record in the Repository • the full-text is not changed in any way
Title: Profiling public transport users through perceptions about public transport providers and
satisfaction with the public transport service
Authors: Paula Vicente and Elizabeth Reis
Affiliation (common to both authors): Instituto Universitário de Lisboa (ISCTE-IUL), Business
Research Unit (BRU-IUL), Lisboa, Portugal
e-mail: [email protected] e-mail: [email protected]
Corresponding author: Paula Vicente Postal address:
ISCTE-IUL Av. Forças Armadas
1649-026 Lisboa
Portugal
1. Introduction and background
The dominance of motor vehicles in land transportation has resulted in many serious environmental and social problems such as air pollution and traffic congestion. Public transport includes all passenger services provided to the public on a non-discriminatory basis with pre-established tariffs, routes and timetables, and designed to meet users’ mobility requirements on a small (urban) or medium (inter-urban) territorial scale (Zatti 2011). Currently, public transport in most cities is increasingly required to meet a range of objectives – from providing mobility for disadvantaged citizens through to alleviating traffic congestion and parking difficulties and reducing the environmental impact of commuting by private car – while also making efficient use of financial resources (Mees et al. 2010). Many countries have made major investments in public transport systems in order to make them more attractive and competitive with other means of transport, most notably private cars (Laconte 2002). However, an improved supply (either qualitatively or quantitatively) does not per se lead to a corresponding increase in the adoption of public transport (Mackett and Edwards 1998, Fujii and Kitamura 2003). Recent research emphasises the importance of strategies promoting behaviours in favour of boosting public transport usage and discouraging the use of private cars (Marshall and Banister 2000, Gärling and Schuitema 2007, European Commission 2013, Wardman 2014).
There is general consensus in the literature that a strategy that strives to change travel behaviour of specific market segments is likely to be more effective than a “one size fits all” approach (e.g. Elmore-Yalch 1998, Anable et al. 2006a) and hence a number of studies have investigated how to encourage citizens to use public transport by taking a segmentation approach. Most of the segmentations of urban travellers are based either on attitudes towards public transport and car or on patterns of public transport and car use (e.g. Cameron and Kingma 2002, Hamilton 2005, cited by Sullivan and O’Fallon 2009, Krizek and El-Geneidy 2007). The segmentation of Cameron and Kingma (2002), for example, encompasses six segments of urban passengers: (1) strider customers, those who prefer to walk or cycle rather than use public transport, (2) stranded
customers for whom there is no affordable transport available, (3) survival customers, confined to the cheapest mode of public transport, (4) sensitive customers who look for the best option of public transport, (5) selective customers who can afford a car but are willing to use public transport and (6) stubborn customers, who will only use the car.
Other studies create typologies of urban travellers that encompass not only attitudes and behaviours regarding urban travel, but also concerns towards the environment and well-being (e.g. Anable 2005, Thornton et al. 2011, Anable 2013). The SEGMENT project of the European Union (Anable 2013) is one such example, suggesting a typology of eight segments: (1) devoted drivers, people that use the car and feel a very low moral obligation to the environment, (2) image improvers who see the car as a way of expressing themselves, and have neutral or moderate environmental attitudes, (3) malcontented motorists, those who find driving stressful but do not want to reduce driving and have a low level of environmental awareness, (4) active aspirers with a strong sense of moral obligation to the environment, highly motivated to use active transport modes, and to walk and cycle for fitness, (5) practical travellers, those who only use the car when necessary, (6) car contemplators, who see cars as status symbols, and believe that people should be allowed unrestricted car use; have a neutral or moderate attitude towards the environment and cycling, (7) public transport dependents who use public transport and do not like driving, and (8) car-free choosers, who think cars lead to unhealthy lifestyles and believe car use should be reduced; they feel a strong sense of moral obligation to the environment and are keen to frequently use public transport.
Based exclusively on habits of transport use, Krizek and El-Geneidy (2007) suggest eight segments that result from the combination of four usage profiles – captive users, choice users, potential users and auto users – with two commuter profiles – regular and irregular. Cools et al. (2012) focus their approach on car use and present a four segment typology based on travellers’ acceptance of strategies to reduce car use: (1) travellers in favour of traffic calming policy
measures, (2) travellers against hard push measures, (3) travellers in favour of demand-restricting measures, and (4) travellers against innovative measures.
Although attitudes towards public transport, private car and environmental change are important to distinguish urban travellers, existing evidence suggests that travelling patterns are not strongly determined by attitudes – correlations between attitudes and behaviours in the area of travel and transport are relatively weak, creating a so-called “attitude-behaviour gap” (Anable et al. 2006b, Sullivan and O’Fallon 2009, Thornton et al. 2011). As such, a purely attitudinal segmentation of urban travellers may lead to a model which does not differentiate between behaviours in the resulting segments. Moreover, public transport systems need to become more market oriented and competitive if they want to retain existing passengers as well as attract new ones from other modes (e.g. Fujii and Kitamura 2003, Beirão and Cabral 2007, Friman and Fellesson 2009, Lai and Chen 2010, Sumaedi et al. 2012). From this approach, travellers are regarded as customers and understanding their feelings after experiencing the public transport services is crucial to operators in order to design effective strategies to meet passenger needs. A marketing oriented approach is therefore likely to bring new insights on how to make people increase public transport use. Additionally, if marketing campaigns are designed towards specific groups, namely those more motivated or keen to use public transport, better results are likely to be achieved (Anable 2005, Steg 2005, Thogersen 2006); this underlines the relevance of profiling urban travellers in line with their perception of the public transport system. This paper contributes to this topic by presenting a segmentation of public transport users based on their perceptions about public transport operators and satisfaction with the service provided. Such a segmentation allows critical issues related to the operators and the service itself to be identified within specific groups and thus supports informed policy decisions targeted to each “audience”.
1.1. Travelling in the Metropolitan Area of Lisbon
The Metropolitan Area of Lisbon (MAL) is the biggest metropolitan area in Portugal encompassing 18 municipalities spread over nearly 3000 km2 with 2.8 million inhabitants (Statistics Portugal 2011). The public transport service in this area is made up of road, railway (which includes subway, train and tram) and fluvial transport. The bus is the mode with most users – in 2010 more than 50% of public transport users commuted by bus – followed by the subway (22% of transport users) (MALT 2014).
The public transport system in MAL has a mixture of public and market governance. The public authority holds control over network design and service offered and delegates only some specific parts of the service to private firms. Since 1995, considerable investments have been made to improve MAL’s public transport system, namely the extension of the subway network, the creation of the railway service to connect the two margins of the Tagus River and the modernisation of the bus fleet. However, the changes in mobility patterns into and within the MAL have not accompanied the improvements made to the transport system. From 1991 to 2011 the number of commuting trips from, to and within the Metropolitan Area of Lisbon increased from 1,253,701 to 1,648,889, though commuting trips using public transport service (bus, underground, tram or train) decreased from 46% in 1991 to 27% in 2011. Moreover, while in 1991 25% of all commuting and/or local trips were by car, in 2011 the figure rose to 54%. Additionally, whereas 21% of commuting and/or local trips in 1991 were made on foot, in 2011 this decreased to 15% (Statistics Portugal 1991, 2011).
The Strategic Plan for Transport and Infrastructures - Horizon 2014-2020 foresees that the Metropolitan Area of Lisbon will extend the subway network, improve the existing railway network and implement a communication and information strategy from the operators (namely online) aiming to provide better public transport service to the actual and potential users (Silva 2014). However, these improvements are likely to produce better results if complemented with policies to
promote individual and societal behaviours that foster public transport usage (e.g. European Commission 2013).
2. Methodology
2.1. Sample and data collection
In 2014, a survey on the adult population of public transport users living in the Metropolitan Area of Lisbon was conducted at the request of the Metropolitan Transport Authority of Lisbon with the aim of describing travel behaviour of public transport users (modes used, trip purposes, trip frequency) and evaluate their satisfaction with the public transport service and operators.
The sample was allocated proportionally to the 18 municipalities of MAL. Within each municipality, sampling areas were chosen in order to guarantee adequate geographical coverage of the municipality. Respondents were chosen on the street, at different times of the day and days of the week, and interviewed after confirming quotas of municipality, sex and age. A total of 1166 valid questionnaires was obtained.
To assist the questionnaire design, focus group interviews were conducted with regular and occasional users of public transport. In total, 6 focus groups involving 42 regular and occasional users were formed, which enabled us to gain insight into travel behaviour and customer perceptions about public transport in the Metropolitan Area of Lisbon (Passos et al. 2014). The survey questionnaire had four sections: (1) public transport usage, (2) image of public transport operators, (3) satisfaction with public transport service and (4) socio-demographics. Questions on public transport use included frequency of use of public transport, modes of transport used and reasons for using public transport. Frequency of public transport usage categorises the respondents into two categories – regular users (daily or weekly basis), and occasional users (do not currently use public transport regularly but did so in the last 5 years). The image of public transport operators was measured by asking respondents to rate their level of agreement with 10 items concerning the public transport operator they use most frequently on a ten-point Likert-type scale (1=totally disagree to
10=totally agree). The items were constructed using the results of the focus groups and The European Customer Satisfaction Index (Johnson et al. 2001). The section on satisfaction with public transport service included a set of 26 items intended to measure the level of perceived satisfaction with specific attributes of the public transport most frequently used by respondents, i.e. respondents rated each item based on their perception of satisfaction after experiencing the public transport service (Cronin and Taylor 1992). These items were constructed using the results of the focus groups and the literature on customer satisfaction (e.g. Edvarson 1998, Friman and Gärling 2001, Hensher et al. 2003, Vilares et al. 2005, Eboli and Mazzulla 2007, Fellesson and Friman 2008, Del Castillo and Benitez 2012, Mokonyama and Venter 2013, Iman 2014) and were measured by a ten-point Likert-type scale (1=totally dissatisfied to 10=totally satisfied); this section also included an item to measure the overall level of satisfaction with the public transport service, rated on the same scale. The option for ten-point Likert-type scales is in line with the recommendation by Wittink and Bayer (2003): it offers higher data dispersion, higher degree of measurement precision and better opportunity to detect changes in attitudes. Table A.1 and Table A.2 in the Appendix contain the list of items. The last section of the questionnaire was on socio-demographics with questions on educational level, employment status, respondent’s household income, household size and car ownership. Respondents were not asked directly about social grade, but an indicator of social level was built by combining household income, educational level and profession of the household member that most contributes to household income. The questionnaire was pre-tested by means of cognitive interviews conducted face-to-face with a sample of 15 respondents with diverse ages and educational levels.
2.2. Statistical data analysis
A Cluster Analysis was applied after two Principal Components Analyses (PCA) were carried out – one on the 10 items used to assess image of public transport operators and the other on the 26 items used to measure satisfaction. We decided not to perform the Cluster Analysis with the
initial variables, but to reduce them in order to make the cluster characterisation easier and more understandable. To assess the adequacy of PCA to both sets of initial variables, the Kaiser-Meyer-Olkin (KMO) statistic was computed and the Bartlett test was performed (Hair et al. 2010). The reliability of the new dimensions was measured by means of Cronbach’s Alpha Coefficient.
The segmentation followed three sequential stages: (1) hierarchical cluster analysis in order to identify the number of segments via dendrogram and agglomeration coefficient graphics, (2) non-hierarchical K-means clustering to segment the public transport users in the number of clusters suggested by hierarchical analysis, and (3) segment characterisation. We adopted Squared Euclidean Distance as a dissimilarity measure and Ward method in the hierarchical analysis.
3. Results
3.1. Respondents’ characteristics
Socio-demographics to describe the respondents include household size, the educational level, employment status, social grade (i.e., social-economic classification) and car ownership. Travel pattern includes frequency of public transport use, most frequently used mode of public transport and travel mode(s) used in the last local trip (i.e. non long-distance travelling) (Table 1).
Table 1: Respondents’ socio-demographic profile and travel pattern Characteristic Percentage Household size 1 person 18.2 2 persons 31.0 3 persons 25.2 4 or more persons 25.6 Educational level
No formal education (less than 4 years at school) 7.8
Elementary (9 years at school) 36.4
Secondary (12 years at school) 27.2
University 28.6 Employment status
Self employed 7.7
Employed by a third party 40.6
Student 16.0 Unemployed 9.0 Retired or inactive 26.7 Social grade D-Lower 33.3 C2-Lower middle 40.1 C1-Middle 21.6 A/B-Upper/Upper middle 5.0 Has car 53.0
Frequency of public transport use
Regular user 72.2
Occasional user 27.8
Most frequently used mode of public transporta, b
Bus 77.9 Train 26.6 Boat 3.8 Subway 43.9
Travel mode in last local tripa:
Bus 42.2 Train 14.9 Boat 1.9 Subway 10.8 Car 44.1 Other 11.1
a More than one answer was allowed.
b Travelling by car, bicycle, or walking not included.
Most of the respondents have completed elementary school (36.4%), are employed (either self-employed or by a third party) (48.2%), live in households of two persons (31%), and belong to social grade C2 (40.2%). The majority have a car (53%) and are regular users of public transport (72.2%). The most frequently used modes of public transport are the bus (77.9%) and subway (43.9%). When asked about the transport modes used in their last local trip most respondents
referred to the car (44.1%) and the bus (42.2%). Among those that mentioned the “other” mode, more than 85% made their trip on foot.
3.2. Dimensions of operators’ image and service quality
The PCA performed with the 10 items on image of the operators of public transport service allowed 3 new dimensions to be found (Table 2).
Table 2: Results of principal components analysis of public transport operators’ image Dimensions of image a Loadingsb % variance explained
α’s Cronbach
CP1-Loyalty 26.2% 0.848
I intend to remain a client of this operator 0.773 This operator offers a service that meets my personal needs 0.736 I recommend this operator to family and friends 0.686
CP2-Confidence 24.9% 0.822
This operator is able to avoid errors and failures 0.800
This operator is reliable 0.748
This operator is stable and is deployed in society 0.684 This operator offers a service that meets my quality
expectations 0.594
CP3- Societal and environmental commitment 19.9% 0.773
This operator is concerned about energy and environment 0.874 This operator is innovative and forward looking 0.689 This operator contributes positively to society 0.552
a Items with loadings less than 0.5 were omitted. b After Varimax Rotation.
According to the highest loadings in each dimension, the new dimensions of operators’ image are labelled as follows: CP1–Loyalty, CP2–Confidence and CP3– Societal and environmental
commitment. The three components together account for 71% of the initial variance (KMO = 0.907; Bartlett’s test p-value <0.001). The values for α’s Cronbach – all above 0.7 – suggest the new dimensions have high levels of internal consistency (Hair et al. 2010).
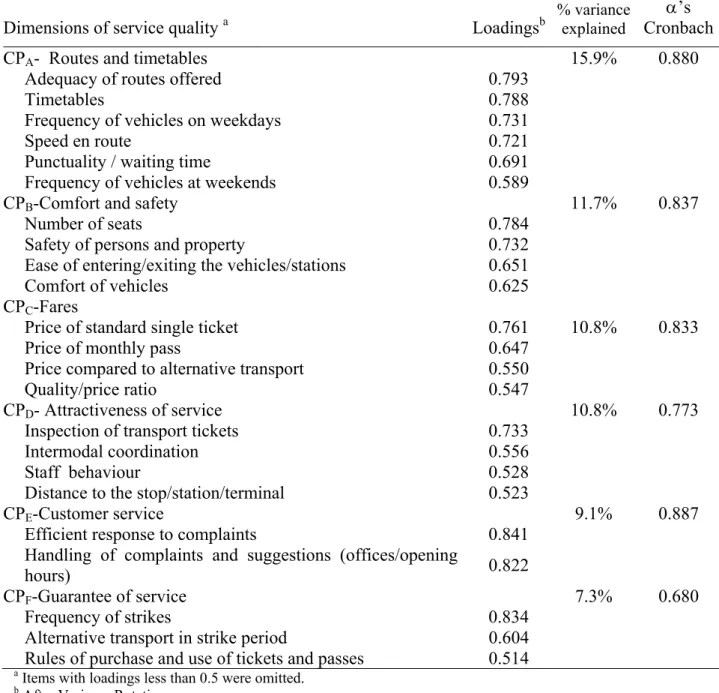
Table 3: Results of principal component analysis of public transport service quality Dimensions of service quality a Loadingsb % variance explained
α’s Cronbach
CPA- Routes and timetables 15.9% 0.880
Adequacy of routes offered 0.793
Timetables 0.788
Frequency of vehicles on weekdays 0.731
Speed en route 0.721
Punctuality / waiting time 0.691
Frequency of vehicles at weekends 0.589
CPB-Comfort and safety 11.7% 0.837
Number of seats 0.784
Safety of persons and property 0.732
Ease of entering/exiting the vehicles/stations 0.651
Comfort of vehicles 0.625
CPC-Fares
Price of standard single ticket 0.761 10.8% 0.833
Price of monthly pass 0.647
Price compared to alternative transport 0.550
Quality/price ratio 0.547
CPD- Attractiveness of service 10.8% 0.773
Inspection of transport tickets 0.733
Intermodal coordination 0.556
Staff behaviour 0.528
Distance to the stop/station/terminal 0.523
CPE-Customer service 9.1% 0.887
Efficient response to complaints 0.841
Handling of complaints and suggestions (offices/opening
hours) 0.822
CPF-Guarantee of service 7.3% 0.680
Frequency of strikes 0.834
Alternative transport in strike period 0.604 Rules of purchase and use of tickets and passes 0.514
a Items with loadings less than 0.5 were omitted. b After Varimax Rotation.
Note: The items “Quality of stops and stations”, “Behaviour of other passengers” and “Availability and clarity of information of information on lines, timetables and tariffs” are not presented because their coefficients are inferior to 0.5; however their strongest correlations were with CPD.
The PCA performed with the 26 items on service attributes allowed 6 new dimensions to be identified (Table 3). The new dimensions are as follows: CPA– Routes and timetables, CPB–
Comfort and safety, CPC– Fares, CPD– Attractiveness of service, CPE–Customer service and CPF–
Guarantee of service. The six components together account for 65.6% of the initial variance (KMO = 0.944; Bartlett’s p-value <0.001; α’s Cronbach from 0.680 to 0.887).
3.3. Segments of public transport users
Public transport users were grouped using the image dimensions – Loyalty, Confidence and Societal and environmental commitment – and the service quality dimensions – Routes and timetables, Comfort and safety, Fares, Attractiveness of service, Customer service and Guarantee of service. These dimensions are all metric-type variables, standardised, with mean equal to zero and variance equal to one. Given the dendrogram and the agglomeration coefficient graphics, we chose 4 clusters. We then applied the non-hierarchical K-means method to this 4 cluster solution. The contingency table with the solution from the hierarchical Ward method and the non-hierarchical method revealed a strong association between the two solutions (Contingency coefficient=0.611), thus indicating a good consistency of the segmentation structure found in our data.
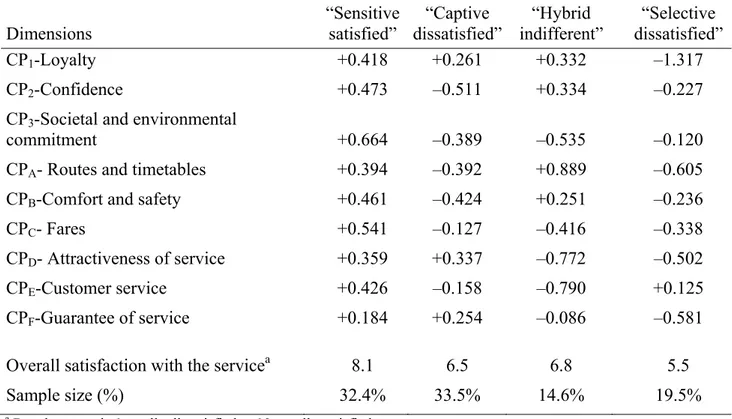
Table 4: Mean value of dimensions of image and of service quality and overall satisfaction per segment Dimensions “Sensitive satisfied” “Captive dissatisfied” “Hybrid indifferent” “Selective dissatisfied” CP1-Loyalty +0.418 +0.261 +0.332 –1.317 CP2-Confidence +0.473 –0.511 +0.334 –0.227
CP3-Societal and environmental
commitment +0.664 –0.389 –0.535 –0.120
CPA- Routes and timetables +0.394 –0.392 +0.889 –0.605
CPB-Comfort and safety +0.461 –0.424 +0.251 –0.236
CPC- Fares +0.541 –0.127 –0.416 –0.338
CPD- Attractiveness of service +0.359 +0.337 –0.772 –0.502
CPE-Customer service +0.426 –0.158 –0.790 +0.125
CPF-Guarantee of service +0.184 +0.254 –0.086 –0.581
Overall satisfaction with the servicea 8.1 6.5 6.8 5.5
Sample size (%) 32.4% 33.5% 14.6% 19.5%
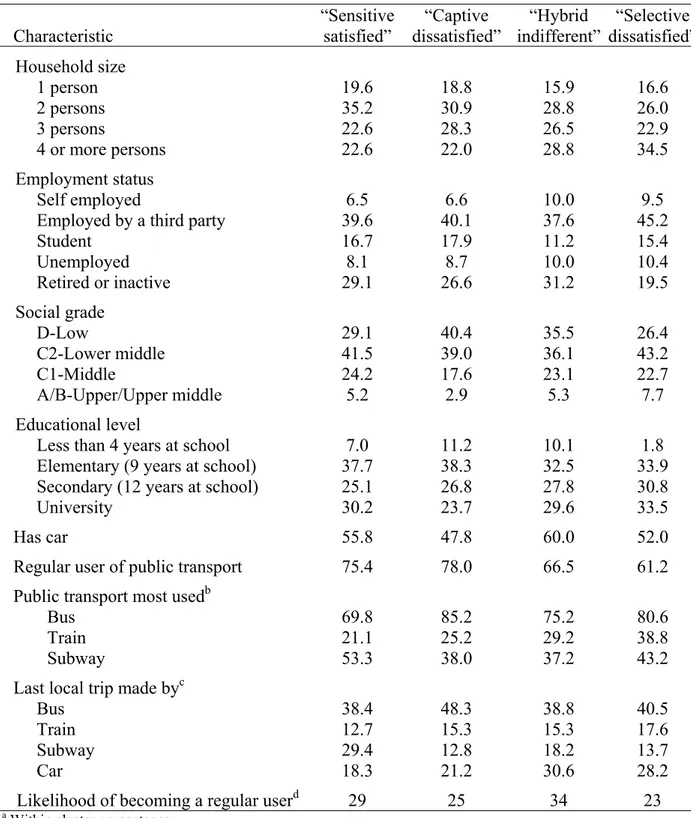
Table 5: Socio-demographics and pattern of transport use per segment (%)a Characteristic “Sensitive satisfied” “Captive dissatisfied” “Hybrid indifferent” “Selective dissatisfied” Household size 1 person 19.6 18.8 15.9 16.6 2 persons 35.2 30.9 28.8 26.0 3 persons 22.6 28.3 26.5 22.9 4 or more persons 22.6 22.0 28.8 34.5 Employment status Self employed 6.5 6.6 10.0 9.5
Employed by a third party 39.6 40.1 37.6 45.2
Student 16.7 17.9 11.2 15.4 Unemployed 8.1 8.7 10.0 10.4 Retired or inactive 29.1 26.6 31.2 19.5 Social grade D-Low 29.1 40.4 35.5 26.4 C2-Lower middle 41.5 39.0 36.1 43.2 C1-Middle 24.2 17.6 23.1 22.7 A/B-Upper/Upper middle 5.2 2.9 5.3 7.7 Educational level
Less than 4 years at school 7.0 11.2 10.1 1.8
Elementary (9 years at school) 37.7 38.3 32.5 33.9 Secondary (12 years at school) 25.1 26.8 27.8 30.8
University 30.2 23.7 29.6 33.5
Has car 55.8 47.8 60.0 52.0
Regular user of public transport 75.4 78.0 66.5 61.2
Public transport most usedb
Bus 69.8 85.2 75.2 80.6
Train 21.1 25.2 29.2 38.8
Subway 53.3 38.0 37.2 43.2
Last local trip made byc
Bus 38.4 48.3 38.8 40.5
Train 12.7 15.3 15.3 17.6
Subway 29.4 12.8 18.2 13.7
Car 18.3 21.2 30.6 28.2
Likelihood of becoming a regular userd 29 25 34 23
a Within cluster percentages.
b Only regular users answered this question; more than one answer was allowed. c More than one answer was allowed.
d
Rated on the scale: 0% to 100%. Mean value is reported. Only occasional users answered this question.
As seen in Table 4 and Table 5, the average profile of the four segments can be described as follows. The “Sensitive satisfied” segment corresponds to 32.4% of the sample; has a strong positive image about public transport operators, is highly satisfied with all six dimensions of service
quality and with the public transport service overall (mean=8.1); it is a segment with a high percentage of regular users of public transport (75.4%), and the subway is the most relevant transport mode; 55.8% of this segment owns a car; social grade C2-lower middle is the most frequent in this segment; they show the highest percentages of those living in households with 1 or 2 persons. We name this segment as “Sensitive satisfied” because of the positive feeling towards public transport operators and satisfaction with the service and, despite having the second highest percentage of car ownership, they choose to use public transport, mostly the subway.
The “Captive dissatisfied” segment includes the users who, despite their dissatisfaction with the service, use public transport because it is the affordable travel alternative. It is striking that this segment has the highest percentage of individuals with lower levels of education (49.5%) and belonging to the D-lower class (40.4%). It is the biggest segment, representing 33.5% of the sample; it has a positive perception of operator’s loyalty but a negative image of the operator’s confidence and societal and environmental commitment. This segment is dissatisfied with the core attributes of the public transport service – routes and timetables, comfort and safety of vehicles, fares and customer service (negative mean values). It has the highest percentage of regular users (78%) and the bus is the most relevant mode: 85.2% of regular users in this segment use the bus and 48.3% used it in their last local trip. This segment has the lowest percentage of car owners (47.8%).
The “Hybrid indifferent” represents 14.6% of the sample; individuals in this segment agree that the public service operator instills confidence and loyalty but do not consider the operator to be committed to society or the environment. Despite their medium/high overall level of satisfaction (mean=6.8), they are only satisfied with Routes and timetables and Comfort and safety; they are dissatisfied with everything else. This segment has the most car owners (60.0%) and presents the second lowest percentage of regular users of public transport (66.5%). Among the current users of public transport, it is the segment that uses the subway least (37.2%) and that most used the car in their last local trip (30.6%); it has the highest percentage of self-employed people (10.0%) and
retired or inactive (31.2%). The occasional users in this segment are the most likely to become regular users (34%).
The “Selective dissatisfied” represents 19.5% of the sample and has a striking profile of dissatisfaction, with mean values below the overall average in all dimensions except the Customer Service dimension; the overall level of satisfaction with the public transport service (mean=5.5) is the lowest of all segments. It has a low percentage of regular users (61.2%) and a low percentage of car owners (52.0%). This segment has the highest percentage of train users (38.8%); compared to the other segments, it is the one that most used the train in the last local trip (17.6%); it also has the highest percentage of people employed by a third party (45.2%), unemployed (10.4%), with secondary or university education (63.4%) and belonging to the A/B social grade (7.7%). This segment is named as “Selective dissatisfied” due to their negative feeling towards public transport operators and service, because they are the least regular users of public transport, and occasional users in this segment are the least likely to become regular users (23%).
4. Discussion
The research undertaken can be resumed as follows (a) a survey of public transport users (regular and occasional users) in the Metropolitan Area of Lisbon was conducted, (b) dimensions of operators’ image and of service quality were identified based on public transport users’ experiences with the transport service, (c) non-hierarchical clustering was used to segment public transport users according to dimensions of operators’ image and of service quality, and (d) four segments of public transport users were identified and named: “Sensitive satisfied”, “Captive dissatisfied”, “Hybrid indifferent” and “Selective dissatisfied”.
The “Sensitive satisfied” can briefly be described as follows: have a positive image of public transport providers and are satisfied with the service provided, and their frequent use of public transport is a positive reflection of this image. The “Captive dissatisfied” and the “Selective dissatisfied” are not satisfied either with the service or the operators, but while one is captive of the
public transport system because there is no affordable alternative, the other alternates between using public transport and the car. The “Hybrid indifferent” have a mixed profile with no strong positive perceptions about the public transport system and no clear preference for a specific transport mode. The “Hybrid indifferent” and “Selective dissatisfied” show the lowest percentages of regular users and should therefore be the main targets of future mobility programmes.
The “Hybrid indifferent” segment is where the occasional users were on average the most likely to become frequent users of public transport; this segment therefore has potential for increasing regular users if the barriers to using public transport are eliminated or reduced. The aspects this group dislikes most are Customer Service (that is, how the operators deal with customers’ complains), Attractiveness of service (encompassing aspects such as inspection of tickets, connectivity and waiting time) and Fares. They are not strongly associated to a specific mode of public transport. This group has the second highest percentage of occasional users (33.5%) and their feeling of dissatisfaction may be due partly to a lack of up to date knowledge about the service because considerable changes have been made in the last five years to the public transport service, namely: tickets on the bus, subway and train are now validated electronically thus reducing the fraud and speeding up entry to transport; and complaints can be made about road, railway and fluvial transport at ticket offices or online thus facilitating the reporting of any unpleasant occurrence on public transport. However, this segment's dissatisfaction with Attractiveness of Service is probably due to weak intermodal coordination because the public transport system in the Metropolitan Area of Lisbon has both private and public operators, which makes it more difficult to design efficient and convenient routes and timetables and improve connectivity. Despite efforts made to improve the range of mode specific and intermodal tariff plans for regular users, this segment remains dissatisfied with Fares.
The “Selective dissatisfied” group is probably more difficult to work on because of its very negative perception about operators and dissatisfaction towards the service. Nothing pleases this group except for Customer Service and they are extremely dissatisfied with Routes and timetables,
Attractiveness of Service and Guarantee of Service. The social category of the “Selective dissatisfied” is high as it has a strong representation of the A/B social grade as well as the two upper educational levels (22.0% and 22.8%); we therefore believe that this group demands service quality. They use the car more than they use the train because they feel “forced” to use the car due to the poor train service provided. This segment is also the least likely to go from occasional to regular users probably due to the poor perception and satisfaction with the system. The train service can only compete with the car if it offers the quality desired by regular and occasional users. The upgrading in the railway service foreseen in the Strategic Plan for Transport and Infrastructures-Horizon 2014-2020 (Silva 2014) is likely to improve railway coverage but dimensions like Routes and timetables and Guarantee of service – which is related to strikes – are also determinants of transport mode decisions and must be appropriately addressed. Namely, timetables and frequency of public transport for work/school related journeys are of the utmost importance but are disrupted by strikes. Additionally, most regular users have monthly tickets and find it very frustrating to be deprived of access to the service on some days due to strikes. Although this group considers that passenger complaints are adequately addressed, this is not enough to mitigate their negative perception of all other factors. Their very strong negative perception about loyalty to the operator implies they do not intend to remain a client or recommend the operator to others; therefore, word-of-mouth advertising – which that can play an important role in public transport use (e.g. Taniguchi and Fujii 2007) – from this group will be negative rather than positive.
“Captive dissatisfied” users are mostly users of the bus and train and their main complaints are related to Routes and timetables and Comfort and Safety. Although it is undoubtedly important to resolve these issues, these users' lack of confidence in the operators cannot be ignored; this group strongly disagrees with the fact that the operator is reliable, stable and able to avoid failures and does not consider the service provided meets their expectations. Despite being “captive” users, it is important to provide quality service that addresses their needs as they are regular users (36.2%); in addition, it is essential to improve passengers’ confidence in the service as a perception of a reliable
public transport system is a sure way to increase use. Public transport dependents tend to be from a low social level (Polzin et al. 2000), a profile consistent with our “captive dissatisfied” segment.
Although a significant investment has been made to improve public transport in the Metropolitan Area of Lisbon over the last decade, strategies underpinned by empirical knowledge grounded on intensive and extensive research must be pursued to improve service design. Increased car use does not only raises CO2 emissions but also entails other negative consequences such as
traffic accidents, noise and inhibiting people’s freedom of movement; these problems can be reduced by switching to alternative modes. Different types of travel demand management measures (Kitamura et al. 1997) have been developed in order to reduce car use. Increased fuel prices and road tolls – the so called hard policy measures – have been used in Portugal in recent years. The effectiveness of such measures is yet to be proved, and such high prices can hardly be maintained in the future. As a result, soft measures need to be implemented such as travel planning and marketing (including personalised travel planning, incentives and motivating information, awareness campaigns on alternative travel modes), setting up car clubs or cooperatives (to promote employee and student car pools), working or shopping from home (Cairns et al. 2008). Friman et al. (2013) summarises the personalised travel planning programmes in several countries and while recognising their positive effects, they point out that different implementations and targets make comparisons difficult and many questions regarding cost-effectiveness remain unanswered.
The key findings of our study indicate that in order to increase public transport use, the service should be designed and customised to each segment to accommodate the level of service required by customers and, therefore, increase frequency of use. Specifically, greater use of public transport might be achieved among “Hybrid indifferent” if this segment is enticed to experience public transport and get to know the improvements made. Lessons could be learned from successful initiatives elsewhere to induce experience, such as free trips or reduced fares, (e.g. Fujii and Kitamura 2003, De Witte et al. 2008). Among the “Selective dissatisfied” frequency of public transport use might be achieved if operators – and above all train operators – first evaluate the
service and reasons for passengers’ disillusion so they can take step to address the issues raised. Secondly, a communication strategy is required to raise awareness of the improvements in public transport and convince people to use it more frequently as well as to build a positive image of public transport and the operators' commitment to society and the environment.
Future studies could focus on specific areas of the Metropolitan Area of Lisbon, specific transport modes or on one specific operator, and may try to position the market segments of public transport users geographically or by mode of transport in order to permit the definition of a mobility programme customised to the specificities of each area or mode. Although excluding non-users of public transport the study undertaken allowed to get the “real” picture of public transport service performance because it was based on the experience reported by users themselves. However, future research may be designed to include non-users of public transport and to study reasons for not using public transport and disclosure incentives to change that status.
References
1) Anable, J. (2005). ”Complacent car addicts” or ”Aspiring environmentalists”? Identifying travel behaviour segments using attitude theory, Transport Policy, 12, 65-78.
2) Anable, J. (2013). The SEGMENT toolkit: segmented marketing for energy efficient transport
(Final report). Available at: http://www.segmentproject.eu/hounslow/segment.nsf/Files/SFF-321/$file/SEGMENT%20FINAL%20PUBLISHABLE%20REPORT.pdf. Accessed 20th January 2016.
3) Anable, J., Lane, N., and Kelay, T. (2006a). A review of public attitudes to climate change
and transport: Summary report. London: Department of Transport. Available at: http://webarchive.nationalarchives.gov.uk/+/http:/www.dft.gov.uk/adobepdf/163944/A_revie w_of_public_attitude1.pdf. Accessed 15th January 2016.
4) Anable, J., Lane, N., and Kelay, T. (2006b). An evidence base review of public attitudes to
climate change transport behavior. London: Department of Transport. Available at: http://www.china-up.com:8080/international/case/case/1457.pdf. Accessed 22nd January 2016.
5) Beirão, G. and Cabral, J. (2007). Understanding attitudes towards public transport and private car: a qualitative study. Transport Policy, 14, 478-489.
6) Cairns, S., Sloman, L., Newson, C., Anable, J., Kirkbride, A. and Goodwin, P. (2008). Smarter choices: assessing the potential to achieve traffic reduction using “soft measures”,
Transport Reviews, 28(5), 593-618. doi: 10.1080/01441640801892504
7) Cameron, J. and Kingma, R. (2002). Public transport in Cape Town: market segmentation
and policy tests to give effect to modal shifts, 21st Annual South African Transport
Conference. Available at:
http://repository.up.ac.za/bitstream/handle/2263/7842/060.pdf?sequence=1. Accessed 20th
8) Cools, M., Brijs, K., Tormans, H., De Laender, J. and Wets, G. (2012). Optimizing the implementation of policy measures through social acceptance segmentation, Transport Policy, 22, 80–87.
9) Cronin, J. and Taylor, S. (1992). Measuring service quality: A reexamination and extension.
Journal of Marketing, 56, 55–68.
10) De Witte, A., Macharis, C., and Mairesse, O. (2008). How persuasive is 'free' public transport? A survey among commuters in the Brussels Capital Region. Transport Policy, 15, 4, 216-224.
11) Del Castillo, J. and Benitez, F. (2012). A methodology for modelling and identifying users satisfaction issues in public transport systems based on users surveys, Procedia - Social and
Behavioral Sciences, 54, 1104-1114. doi: 10.1016/j.sbspro.2012.09.815
12) Eboli, L, and Mazzulla, G. (2007). Service quality attributes affecting customer satisfaction for bus transit. Journal of Public Transport, 10(3), 21-34.
13) Edvarson, B. (1998). Causes of customer dissatisfaction – Studies of public transport by critical incident method. Managing Service Quality, 8(3), 189-197.
14) Elmore-Yalch, R. (1998). A handbook: using market segmentation to increase transit
ridership (TCRP Report 36). National Academy Press: Washington D.C.
15) European Commission (2013). Special Eurobarometer 406: Attitudes of Europeans towards
urban mobility. European Commission, Brussels. Available at: http://ec.europa.eu/public_opinion/archives/ebs/ebs_406_en.pdf . Accessed 14th September 2015.
16) Fellesson, M. and Friman, M. (2008). Perceived satisfaction with public transport service in nine European cities. Journal of Transportation Research Forum, 47(3), 93-103.
17) Friman, M. and Fellesson, M. (2009). Service supply and customer satisfaction in public transportation the quality paradox. Journal of Public Transportation, 12(4), 57-69.
18) Friman, M. and Gärling, T. (2001). Frequency of negative critical incidents and satisfaction with public transport services. II, Journal of Retailing and Consumer Services, 8, 105-114.
19) Friman, M., Larhult, L. and Gärling, T. (2013). An analysis of soft transport policy measures implemented in Sweden to reduce private car use, Transportation, 40, 109-129. doi: 10.1007/s11116-012-9412-y
20) Fujii, S. and Kitamura, R. (2003). What does a one-month free bus ticket do to habitual drivers? An experimental analysis of habit and attitudes change. Transportation, 30(1), 81-95. 21) Gärling, T., and Schuitema, G. (2007). Travel Demand Management Targeting Reduced
Private Car Use: Effectiveness, Public Acceptability and Political Feasibility, Journal of
Social Issues, 63(1), 139–153.
22) Hair, Jr, J., Black, W., Babin, B. and Anderson, R. (2010). Multivariate data analysis: a
global perspective (7th Edition). New Jersey: Prentice-Hall
23) Hamilton, B. (2005). Dunedin modal change market research project. Dunedin: Otago Regional Council.
24) Hensher, D., Stopher, P. and Bullock, P. (2003). Service quality – developing a service quality index in the provision of commercial bus contracts, Transportation Research Part A, 37, 499-517. doi: 1016/S0965-8564(02)00075-7.
25) Iman, R. (2014). Measuring Public Transport Satisfaction from User Surveys, International
Journal of Business and Management, 9(6), 106-114.
26) Johnson, M., Gustafsson, A., Andreassen, T., Lervik, L., and Cha, J. (2001). The evolution and future of national customer satisfaction index models. Journal of Economic Psychology, 22, 217-245.
27) Kitamura, R., Fujii, S. And Pas, E.I. (1997). Time-use data, analysis and modelling: toward the next generation of transportation planning methodologies, Transport Policy, 4(4), 225-235.
28) Krizek, K. and El-Geneidy, A. (2007). Segmenting preferences and habits of transit users and non-users. Journal of Public Transportation, 10, 71-92.
29) Laconte, P. (2002). Smart segments for urban public transportation: a international survey of practices. Japan Railway & Transport Review, 32, 4-11.
30) Lai, W. and Chen, C. (2010). Behavioral intentions of public transit passengers – the role of service quality, perceived value, satisfaction and involvement, Transport Policy, 18 (2), 318– 325.
31) Mackett, R. and Edwards, M. (1998). The impact of new public transport systems: will the expectations be met? Transportation Research Part A: Policy and Practice, 32, 231-245. 32) MALT (Metropolitan Authority of Lisbon Transport) (2014). Organization, tariffs and
financing of public transport system of metropolitan area of Lisbon. Unpublished report.
33) Marshall, S., and Banister, D. (2000). Travel reduction strategies: intentions and outcomes,
Transportation Research Part A: Policy and Practice, 34(5), 321–338.
34) Mees, P., Stone, J., Imran, M., and Nielson, G. (2010). Public transport network planning: a
guide to best practice in NZ cities. New Zealand Transport Agency research report 396.
Available at: http://www.nzta.govt.nz/assets/resources/research/reports/396/docs/396.pdf. Accessed 11th September 2015.
35) Mokonyama, M. and Venter, C. (2013). Incorporation of customer satisfaction in public transport contracts – A preliminary analysis, Research in Transportation Economics, 39, 58-65. doi: 10.1016/j.retrec.2012.05.024
36) Passos, A., Ramos, S. and Costa, P. (2014). Estudo de Satisfação dos Utilizadores dos
Transportes Públicos da Área Metropolitana de Lisboa 2013 – Final Report of Focus Groups. Instituto Universitário de Lisboa (ISCTE-IUL): Lisbon. (unpublished report).
37) Polzin, S., Chu, X and Rey, J. (2000). Density and captivity in public transit success: Observations from the 1995 nationwide personal transportation study. Transportation
Research Record, 1735, 10-18.
38) Silva, R. (2014). Strategic Plan for Transport and Infrastructures Horizon 2014 – 2020
(PETI3+). Available at: http://www.transportespublicos.pt/o-plano-estrategico-de-transportes-e-infraestruturas-e-o-transportespublicos-pt/. Accessed 6th May 2015.
40) Statistics Portugal (2011). Population Mobility. Census Population Report. Statistics Portugal, 31-37.
41) Steg, L. (2005). Car use: lust and must. Instrumental, symbolic and affective motives for car use. Transportation Research Part A: Policy and Practice, 39, 147-162.
42) Sullivan, C. and O’Fallon, C. (2009). Segmentation research for sustainable transport: do’s and don’ts. Proceedings of the 32nd
Australasian Transport Research Forum. Auckland, New
Zealand.
43) Sumaedi, S., Bakti, I. and Yarmen, M. (2012). The empirical study of public transport passenger’s behavioural intentions: the roles of service quality, perceived sacrifice, perceived value and satisfaction. International Journal for Traffic and Transport Engineering, 2(1), 83 – 97.
44) Taniguchi, A. and Fujii, S. (2007). Promoting public transport using marketing techniques in mobility management and verifying their quantitative effects, Transportation, 34(1), 37-49. 45) Thogersen, J. (2006). Understanding repetitive travel mode choices in a stable context: a
panel study approach, Transportation Research Part A: Policy and Practice, 40(8), 621-638. 46) Thornton, A., Evans, L., Bunt, K., Simon, A., King, S. and Webster, T. (2011). Climate
Change and Transport Choices: A framework for reducing CO2 emissions from personal
travel. Available at:
https://www.gov.uk/government/uploads/system/uploads/attachment_data/file/49971/ climate-change-transport-choices-full.pdf. Accessed 14th January 2016.
47) Vilares, M., Coelho, P. and Cadilhe, M. (2005). Satisfação e lealdade do cliente:
Metodologias de avaliação, gestão e análise. Lisboa: Escolar Editora.
48) Wardman, M. (2014). Valuing convenience in public transport. International Transport
Forum. Available at:
http://www.internationaltransportforum.org/jtrc/DiscussionPapers/DP201402.pdf. Accessed 14th September 2015.
49) Wittink, D. and Bayer, L. (2003). The Measurement Imperative, Marketing Research, 6 (4), 14-22.
50) Zatti, A. (2011). New organizational models in European Local Public Transport: from Myth
to Reality, Working paper CIRIEC 2011/06. Available at: http://www.ciriec.ulg.ac.be/
Acknowledgements
This article is part of the project Estudo de Satisfação dos Utilizadores dos Transportes
Públicos da Área Metropolitana de Lisboa 2013, a joint project of Metropolitan Transport
Appendix
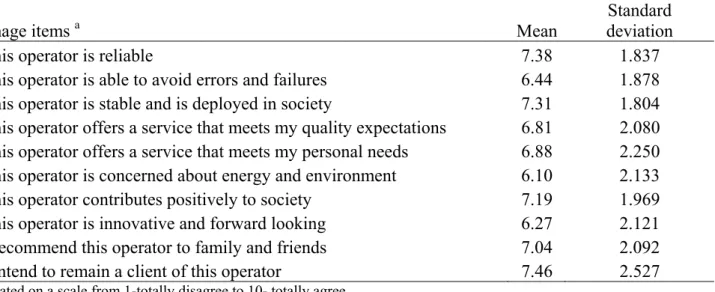
Table A.1: Descriptive statistics of operators’ image items
Image items a Mean
Standard deviation
This operator is reliable 7.38 1.837
This operator is able to avoid errors and failures 6.44 1.878 This operator is stable and is deployed in society 7.31 1.804 This operator offers a service that meets my quality expectations 6.81 2.080 This operator offers a service that meets my personal needs 6.88 2.250
This operator is concerned about energy and environment 6.10 2.133 This operator contributes positively to society 7.19 1.969
This operator is innovative and forward looking 6.27 2.121
I recommend this operator to family and friends 7.04 2.092
I intend to remain a client of this operator 7.46 2.527
Table A.2: Descriptive statistics of service quality items
Service quality items a Mean
Standard deviation
Punctuality/waiting time 6.67 2.258
Speed en route 7.15 1.909
Adequacy of routes offered 6.86 1.990
Timetables 6.54 2.093
Frequency of vehicles on weekdays 6.83 2.058
Frequency of vehicles at weekends 5.02 2.285
Comfort of vehicles 6.52 1.912
Number of seats 6.47 1.956
Safety of persons and property 6.52 2.074
Ease of entering/exiting the vehicles/stations 6.81 1.871
Price of standard single ticket 4.23 2.420
Availability and clarity of information on lines, timetables and tariffs 6.55 2.166
Behaviour of other passengers 6.22 1.984
Distance to the stop/station/terminal 6.98 1.902
Price of monthly pass 4.55 2.379
Frequency of strikes 5.30 2.586
Alternative transport in strike period 4.39 2.497
Rules of purchase and use of tickets and passes 6.51 2.166
Handling of complaints and suggestions (offices/opening hours) 5.70 2.222
Efficient response to complaints 5.44 2.199
Quality/price ratio 5.52 2.141
Quality of stops and stations 5.91 2.175
Inspection of transport tickets 6.19 2.319
Price compared to alternative transport 6.00 2.088
Intermodal coordination 6.56 2.067
Staff behaviour 6.93 1.999
Overall satisfaction with the service 6.86 1.691