Energetics of Transport through the Nuclear
Pore Complex
Ali Ghavami, Erik van der Giessen, Patrick R. Onck*
Zernike Institute for Advanced Materials, University of Groningen, Groningen, the Netherlands
Abstract
Molecular transport across the nuclear envelope in eukaryotic cells is solely controlled by the nuclear pore complex (NPC). The NPC provides two types of nucleocytoplasmic trans-port: passive diffusion of small molecules and active chaperon-mediated translocation of large molecules. It has been shown that the interaction between intrinsically disordered pro-teins that line the central channel of the NPC and the transporting cargoes is the determin-ing factor, but the exact mechanism of transport is yet unknown. Here, we use coarse-grained molecular dynamics simulations to quantify the energy barrier that has to be over-come for molecules to pass through the NPC. We focus on two aspects of transport. First, the passive transport of model cargo molecules with different sizes is studied and the size selectivity feature of the NPC is investigated. Our results show that the transport probability of cargoes is significantly reduced when they are larger than*5 nm in diameter. Secondly, we show that incorporating hydrophobic binding spots on the surface of the cargo effectively decreases the energy barrier of the pore. Finally, a simple transport model is proposed which characterizes the energy barrier of the NPC as a function of diameter and hydropho-bicity of the transporting particles.
Introduction
Molecular transport between the cytoplasm and the nucleoplasm is gated by highly selective nuclear pore complexes (NPCs). The NPC is embodied in the nuclear envelope membranes and provides bidirectional pathways for passive transport of small molecules and active (facili-tated) transport of larger molecules [1–4]. Small molecules and ions are passively transported
through the pore by free diffusion, but large molecules are barred to enter the pore. The trans-port of large macromolecules requires binding to soluble transtrans-port factors, generally known as karyopherins or Kaps. During active import or export the Kap binds to cargo with a nuclear import or export signal, upon which the Kap-cargo complex is translocated through the NPC.
The NPC of yeast, as a model system, is composed of approximately 30 different proteins called nucleoporins (Nups) which are arranged with an eight fold-symmetrical pattern inside the pore [5,6]. The Nups that line the central channel of the pore have been found to be intrin-sically disordered and contain many phenylalanine-glycine (FG) repeats [7]. These FG-Nups OPEN ACCESS
Citation:Ghavami A, van der Giessen E, Onck PR (2016) Energetics of Transport through the Nuclear Pore Complex. PLoS ONE 11(2): e0148876. doi:10.1371/journal.pone.0148876
Editor:Eugene A. Permyakov, Russian Academy of Sciences, Institute for Biological Instrumentation, RUSSIAN FEDERATION
Received:September 7, 2015
Accepted:January 25, 2016
Published:February 19, 2016
Copyright:© 2016 Ghavami et al. This is an open access article distributed under the terms of the Creative Commons Attribution License, which permits unrestricted use, distribution, and reproduction in any medium, provided the original author and source are credited.
Data Availability Statement:All relevant data are within the paper and its Supporting Information files.
Funding:This research was funded by the Zernike Institute for Advanced Materials at the University of Groningen. The authors thank SURFsara (www. surfsara.nl) for the support in using the Lisa Compute Cluster. The funders had no role in study design, data collection and analysis, decision to publish, or preparation of the manuscript.
are essential for the viability of yeast and presumably all eukaryotes but their function in regu-lating the active and passive transport is not yet understood [8]. Several models have been pro-posed to explain the role of FG-Nups and Kaps during transport but no consensus has been reached so far on a prevailing model [3,9–14].
The permeability barrier of the NPC has been characterized by studying the passive trans-port of a wide range of inert molecules of different size. Single molecule studies have revealed that cargoes up to 29 kDa can smoothly diffuse through the pore, while transport of cargoes larger than 61 kDa is prohibited [15]. Early experiments have estimated a diameter of 4.5–5.4
nm for the diffusion channel of the NPC [16,17], which was refined to a diameter of5.3 nm in more recent experiments [18]. In addition to the size, the shape of the transporting species has been shown to be an important factor in passive transport. It has been observed that elon-gated non-spherical cargoes diffuse faster than spherical ones with the same mass [18]. Passive and active transport pathways have been widely discussed in the literature [12,15,18,19]. Sev-eral studies have suggested that passive and active transport take place through different spa-tially-separated pathways across the pore [15,19,20]. Recently, it has been demonstrated that passive transport mostly occurs through the central region of the pore [15,21].
Mutational analyses of Kaps suggest that the interaction between Kaps and FG-repeats is necessary for active transport [22,23]. It has been shown that Kaps have a greater surface hydrophobicity compared to other cytoplasmic proteins [24]. In addition, structural analyses have demonstrated that, during interaction, hydrophobic side chains of the FG-Nups closely interact with hydrophobic pockets on the surface of the Kap [22,25]. Naim and co-workers [26] have shown that a cargo that is normally blocked, can be triggered to enter by modification of its surface with hydrophobic amino acids. This suggests that a certain amount of surface hydrophobicity is necessary for cargo to actively translocate through the pore. Molecular dynamics simulations and experiments have revealed several binding spots on the surface of Kaps [27–30]. Recently, the effect of electrostatic interactions on active and passive transport
has been studied through a high resolution fluorescence microscopy technique [31]. The results of this experiment suggest that electrostatic interactions are less important than hydrophobic interactions in nuclear transport through the NPC.
In addition to experimental studies, several theoretical and computational studies have been conducted to elucidate the mechanism of nuclear transport. These studies include investiga-tions of single FG-Nups [12,32], their collective behavior in brush-like structures [33,34] and in the transport channel of the NPC [35–37] as well as modeling transport through the nuclear
pore [38–41]. Regarding nuclear transport, Mincer et al. [38] have used a super-resolution
We have previously investigated the distribution of disordered FG-Nups in the transfer con-duit of the NPC by means of coarse-grained implicit solvent molecular dynamics sumulations [37]. The developed one-bead-per-amino-acid model distinguishes between all 20 amino acids of the FG-Nups and takes into account hydrophobic and electrostatic interactions between the amino acids, the backbone stiffness of the Nups as well as the screening effect of free ions and polarity of the solvent through a modified Coulomb equation. The model has been calibrated against experimental Stokes radii of a wide range of FG-Nup segments [12]. Since the model is parametrized against the equilibrium properties of FG-Nups, it cannot be directly used to study kinetic aspects of nuclear transport. The goal of the present work is to use this model to study the energetics of passive and active transport through the disordered domain of the nuclear pore complex. We examine the size selectivity of the NPC by calculating the energy barrier for passively transporting cargoes. In addition, we elucidate the active transport mecha-nism by studying how the number of binding spots and their spacing on the surface of model Kaps affect the energy barrier.
Methods
Molecular dynamics simulations are performed using a one-bead-per-amino acid coarse-grained (CG) model [37]. The distance between neighboring beads is fixed at 0.38 nm using a harmonic potential and an average mass of 120 Da is assigned to each CG bead. The backbone stiffness of the FG-Nups is controlled through bending and torsion potentials extracted from the Ramachandran data of the coiled regions of protein structures [42]. The Gromacs molecu-lar dynamics software [43] is used to perform Langevin dynamics simulations. The tempera-ture is set to 300 K and the cut-off distance for Van der Waals and Coulombic interactions are set to 2.5 nm and 5.0 nm, respectively. A time-step of 0.02 ps is chosen and the Langevin fric-tion coefficient is set to 50 ps−1which is similar to the collision frequency of water molecules [44]. For details of the model the reader is referred to Ghavami et al. [37].
A simplified geometrical model of the NPC is built based on the geometry of the core scaf-fold of the yeast NPC and the FG-Nups are anchored at the predicted positions inside the pore [45,46]. The scaffold is modeled using hard-sphere beads with a diameter of 5.0 nm which are assumed to have no interaction with the FG-nups (seeFig 1A).
Passively transporting cargoes are modeled as rigid spheres with diameterD. Inert cargoes smaller than 5.0 nm in diameter are modeled as a single neutral bead with a purely repulsive potential at distances smaller thanσc=D/2+rb, whererb= 0.3 nm is the radius of the CG-beads
for the FG-Nups (seeFig 1B). Cargoes larger than 5.0 nm in diameter are constructed with a number of neutral beads each having a repulsion distance ofσc= 2.5 nm as shown inFig 1C.
These overlaping beads are centered at a distance ofrc=D/2−(σc−rb) from the center of the composite cargo. A schematic representation of the inert cargoes used in this work is presented inFig 1E.
Kaps are elongated boat-like proteins with FG-Nup binding spots on their convex surface [3,13], while their concave surface is used to attach to the cargo. In view of this, the Kap-cargo complex is modeled as a rigid sphere ofD= 10 nm with several binding spots on its surface. Since binding spots and FG-repeats are reported to have similar affinities with FG-Nups [47], the binding spots are represented by hydrophobic beads that are similar to Phenylalanin (F) amino acids (with a maximum interaction energy of−5.2 kJ.mol−1) and are distributed on the
surface of the sphere along a stripe at a spacingd(seeFig 1D and 1E) [27].
the umbrella sampling method, the reaction coordinate is subdivided into several overlapping windows. The system is then simulated in the presence of a bias potential to enhance the sam-pling in each window. Ultimately, the information from the separate simulations are unbiased and recombined to obtain the PMF along the reaction coordinate (see theS1 Text).
Results and Discussions
Size selectivity of the NPC
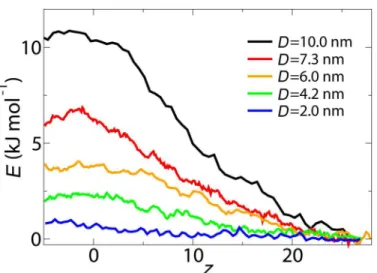
First, the PMF curve along the central axis of the NPC is calculated for inert cargoes of different size as shown inFig 2. In all cases the PMF curve increases as the cargo relocates from its start-ing position inside the cytoplasm (z= 27 nm) to the center of the NPC and a peak value is observed near the central plane of the NPC. This continuous increase in PMF already starts inside the cytoplasm (i.e.,z>15.4 nm, seeFig 1), which indicates that some of the FG-Nups extend to the cytoplasmic environment and repel large cargo molecules by their entropic motion. This is consistent with our previous study showing that the FG-Nups located at the peripheries of the NPC have more conformational freedom and are spread over a larger volume compared to the FG-Nups located near the symmetry plane of the NPC [37].
Fig 1. The geometrical model of the NPC and cargoes.(A) (left) The core scaffold of the NPC, reconstructed based on the structural model proposed in [45], (right) a snapshot taken from an umbrella sampling simulation for a cargo withD= 10 nm. (B) Geometrical representation of a model cargo smaller than 5.0 nm in diameter and (C), composite cargoes larger than 5.0 nm. (D) Geometrical representation of a model Kap-cargo complex with 7 binding spots. (E) The inert cargoes with different diameters and a Kap-cargo complex as used in the simulations.
In order to study the size selectivity of the NPC, the free energy barrier corresponding to dif-ferent cargo diameters is calculated and plotted inFig 3. The energy barrier is defined as the difference between the mean PMF at -5.0 nm<z<5.0 nm and 20 nm<z<27 nm and is an
indication of the work required to translocate the cargo from the cytoplasm to the core of the NPC. The results show that the energy barrier of the NPC for passively transporting cargoes decreases as the diameter of the cargo decreases. The size selectivity threshold of the pore is cal-culated by comparing the energy barrier of the pore with the thermal energykBT. If the energy barrier experienced by the cargo is larger thankBT, the probability that a cargo passes through the pore decreases. Thus, by definingkBTas a soft limit for transport, we find that cargoes larger thanD= 5.0 nm have a small probability to pass through. This is within the experimen-tal estimates in the range 4.5–5.4 nm for the size selectivity of the NPC [16–18].
Fig 2. Potential of mean force curves along the central axis of the NPC (r= 0) for cargoes withD= 10, 7.3, 6.0, 4.2 and 2.0 nm.
doi:10.1371/journal.pone.0148876.g002
Fig 3. The energy barrierGversus diameterDof the cargoes.The dashed line is a quadratic fit to the data and the error bars indicate the standard deviation of the data for the interval -5.0 nm<z<5.0 nm and 20
nm<z<27 nm.
A comparison between the energy barrier of the wildtype and a minimal viable NPC for a cargo withD= 10 nm is made inFig 3. The minimal viable NPC corresponds to an NPC that has the least amount of FG-nups according to Strawn et al. [8], yet is viable. In the minimal via-ble NPC Nup42, Nup159, Nup1, Nup60, Nup100, Nsp1 and Nup145 are removed (see [37]). The results indicate that the minimal viable NPC is also able to screen large non-specific car-goes from entering the pore. However, the energy barrier has decreased by 22% in the minimal NPC compared to the wildtype NPC, which is probably due to the removal of half of the mass of the FG-Nups in the minimal viable NPC.
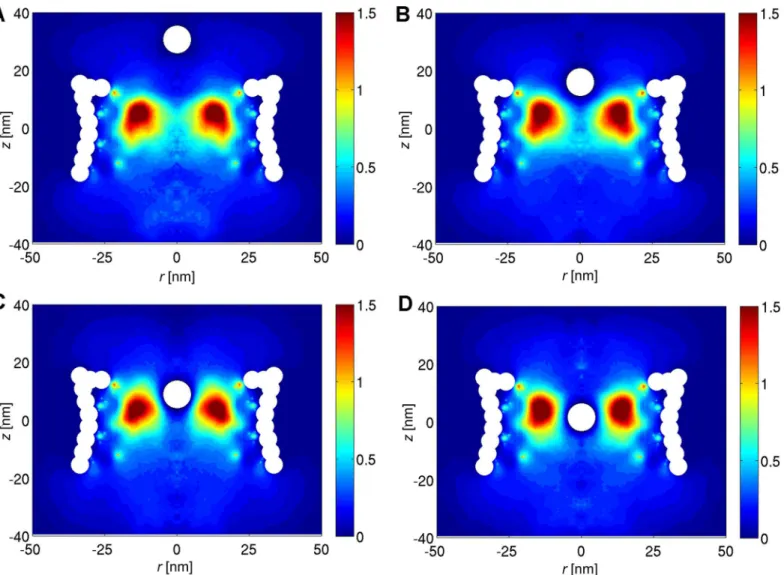
In order to gain more understanding on the energy barrier of the NPC, the density distribu-tion of the FG-Nups is studied in the presence of a cargo with diameter ofD= 10 nm at differ-ent vertical distances from the cdiffer-entral plane of the NPC (seeFig 4). The two-dimensional density plots are obtained by averaging the density distribution of the FG-Nups in the circum-ferential direction for the umbrella simulations [37]. The results show that once the cargo approaches the center of the NPC, it has to push the high density FG-Nup region aside in order to pass through the pore. This will result in a high energetic penalty for the cargo to pass through the central region of pore, resulting in a total energy barrier of 10.5 kJ/mole (Fig 2).
Fig 4. The 2D density plots of the FG-Nups taken from the umbrella simulations.The vertical distance from the center of the cargo to the central plane of the NPC is (A) 30 nm, (B) 15.6 nm, (C) 8.3 and (D) 1.1 nm, respectively.
Possible pathways
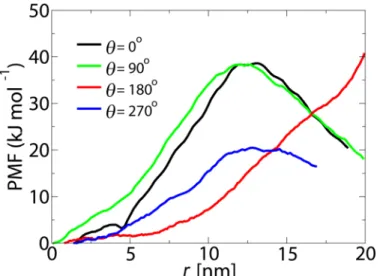
The calculated PMF curves inFig 2are obtained along the central axis of the pore (r= 0). In order to check whether the lowest energy route for passive transport passes through the center, radial PMF curves have been calculated. This is done by comparing radial free energy profiles for a cargo withD= 10 nm at the maximum point of the axial PMF curve (i.e.,z=−2.5 nm, see Fig 2). The radial energy profiles are obtained in four different directions,θ= 0°, 90°, 180° and
270° (see Figs1and5).
The difference between the PMF curves can be rationalized by the non-uniform distribution of the FG-Nups in the pore (see [37]). For all orientations the lowest energy pathway for an inert cargo withD= 10 nm passes through the center of the pore. This is consistent with single molecule tracking experiments which suggest that passively transporting particles pass through the center [15].
Lowering the barrier
The energetics of active transport is investigated by calculating PMF curves for Kap-cargo com-plexes through the central axis of the NPC (r= 0 nm). The Kap-cargo complex is modeled as a sphere of diameterD= 10 nm with 7 binding spots on its surface, but at different spacingsd(see Figs1and6). When the binding spots are spaced atd= 4.94 nm,Fig 6shows that a reduction is observed in the energy barrier of the NPC from 10.5 kJ/mol in the absence of any binding spots (cf.Fig 2) to 7.3 kJ/mol. However, this reduction is not enough for transport of the model Kap-cargo complex. When the spacing between the binding spots is further decreased to 2.5 nm, the energy barrier does not show a considerable difference fromd= 4.9 nm. However, when the spacing is decreased tod= 1.3 nm, the obtained PMF curve shows a large reduction of the energy barrier to the order ofkBT(seeFig 6). These trends are consistent with the experimental findings of Naim and co-workers [26], who showed that large inert cargoes were able to transport through the pore when hydrophobic amino acid side chains were attached to the surface of the cargo.
In addition, the critical spacing of 1.3 nm is in close agreement to the reported values of
d= 1.1 ± 0.3 nm andd= 1.4 ± 0.3 nm for the distance between binding spots on the surface of Importin-βand NTF2, respectively [27].
Fig 5. The potential of mean force along the radial direction of the NPC (atz=−2.5 nm) for a cargo with D= 10 nm.
Effect of the number of binding spots
In order to quantify the effect of hydrophobicity of the Kap-cargo surface on active transport, PMF curves for Kap-cargo complexes are computed for a fixed spacing (d= 1.3 nm), but with varying number of binding spots (i.e.,n= 3, 7 and 11), seeFig 7. The addition of 3 binding spots decreases the energy barrier from 10.5 kJ/mol (no binding spots, seeFig 2) to 7.3 kJ/mol. Forn= 7, the energy barrier is on the order ofkBT. Interestingly, by increasing the number of binding spots ton= 11, the barrier completely disappears and the NPC forms a potential well for the Kap-cargo complex. In this case the complex is attracted towards the pore and tends to stay in the central region of the NPC. Clearly, the probability for transport would be strongly reduced compared to a complex with 7 binding spots.
Fig 6. The free energy curves along the central axis of the NPC (r= 0), for a Kap-cargo complex of diameterD= 10 nm with different spacingsdbetween the binding spots on its surface.The inset shows the energy barrier versus spacingd. The interaction energy between individual binding spots and the FG-repeats is−5.2 kJ.mol−1.
doi:10.1371/journal.pone.0148876.g006
Fig 7. The free energy curves along the central axis of the NPC (r= 0), for a Kap-cargo complex of diameterD= 10 nm with different number of binding spotsn.The inset shows the energy barrier versus the number of binding spotsd. The interaction energy between individual binding spots and the FG-repeats is
−5.2 kJ.mol−1.
The energy barrier versus the number of binding spotsnis plotted in the inset ofFig 7. The results suggest that there is an optimum number of binding spots for efficient transport of a Kap-cargo complex through the pore. It must be noted, however, that our simulations are for a cargo withD= 10 nm and the optimum number of binding spots might be different for a cargo with different size.
Transport model
Earlier theoretical and experimental studies propose that the free energy of insertion of parti-cles into grafted polymer brush scales with either the volume (in high grafting densities or bad solvent conditions) or the surface area of the particle (in low grafting density or good solvent conditions) [49–52]. Since the density of the FG-nups is low in the central channel of the NPC,
the free energy penalty for passage of cargoes scales with their surface areaG*D2(seeFig 3). Upon addition of binding spots on the surface of the cargo, the free energy barrier will be reduced by an attractive energy gain [53] proportional to the contact area of the cargo and the FG-nups. Based on these considerations, a simple transport model is proposed, which describes the energy barrier of the NPC,G, as a function of the diameter and hydrophobicity of the Kap-cargo complex,
GðD;nÞ ¼fðD0Þ gðXÞ; ð1Þ
whereD0=D/Lis the diameter of the cargo complex normalized by the diameter of the NPC (L= 60 nm), andX=na/(πD) is a measure of the hydrophobic contact area of the cargo in
terms of the number of hydrophobic binding spots,n, and the diameter of the binding spots
a= 0.6 nm. The dependence on cargo size forn= 0 is included through a quadratic functionf
(D0) =a1D02which is obtained byfitting the results ofFig 3. The functiong(X) indicates the reduction of the free energy barrier as the hydrophobic contact area of the Kap-cargo complex is increased and is obtained byfitting the results ofFig 7for a cargo withD= 10 nm to a qua-dratic functiong(X) =b2X2+b1X+b0(the constantsaiandbican be found in theS2 Text). The accuracy of the model is verified by comparing the predicted and calculated energy barriers for a Kap-cargo complex withD= 7.3 nm andn= 5 and 8 hydrophobic binding spots (seeS3 Fig), showing good agreement.
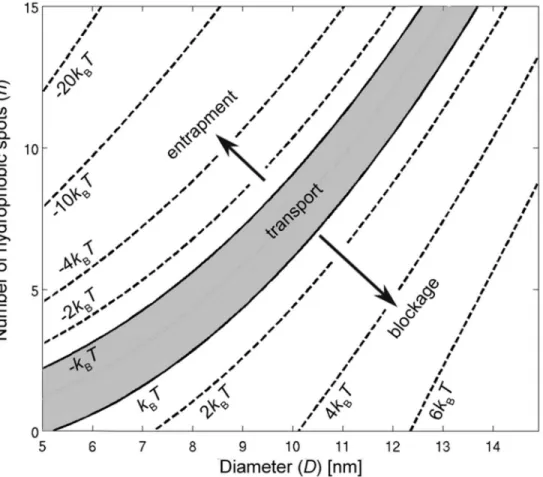
Using the proposed model, the energy barrier of the NPC is characterized for Kap-cargo complexes with different sizes and number of hydrophobic binding spots inFig 8. The calcu-lated energy map suggests that efficient transport occurs in a strip confined between two iso-lines of +kBTand−kBTwhich is shown as a gray area inFig 8. The region below the +kBTline corresponds to the situation in which the number of hydrophobic bindings spots is too small to reduce the free energy barrier enough for transport to be possible. The area above the−kBT line represents a state in which the NPC turns into an energy well due to the presence of a large number of hydrophobic binding spots on the cargo. These spots have a high affinity to the FG-nups which results into entrapment of the cargo inside the pore.
Conclusion
PMF curves of Kap-cargo complexes show that the attachment of several hydrophobic binding spots to the surface of the cargo complex lowers the energy barrier belowkBT, facilitating the transport of large cargo molecules. In addition, the effect of surface hydrophobicity and spacing between binding spots on active transport has been analyzed. Our results show that in addition to the number of hydrophobic spots the spacing between binding spots is a key feature in facili-tated transport through the NPC. Additionally, we show that there is an optimal number of hydrophobic binding spots for efficient transport of Kap-cargo complexes of a certain size. Depending on the number and spacing of binding spots, a cargo can be expelled from, trans-ported through or trapped inside the pore.
Supporting Information
S1 Text. The umbrella sampling procedure.
(PDF)
S2 Text. Parametrization of the transport model.
(PDF)
S1 Fig. PMF curves along the central axis of the minimal viable NPC forD= 10 nm
obtained for a spacing ofdz= 2.0 nm and 1.5 nm between umbrella windows and with 1X
and 2X sampling.
(EPS)
Fig 8. Contour plot of the energy barrierGof the NPC as a function of cargo diameterDand number of hydrophobic binding spotsn.
S2 Fig. The convergence of the PMF curve with increasing sampling (1X, 2X and 3X) for
the wildtype NPC withD= 10 nm. The spacing between the umbrella windows is set to
dz= 1.5 nm.
(EPS)
S3 Fig. The predicted and calculated energy barrierGfor Kap-cargo complexes ofD= 10
nm andD= 7.3 nm with different number of hydrophobic binding spotsn.
(EPS)
Acknowledgments
This research was funded by the Zernike Institute for Advanced Materials at the University of Groningen. We thank SURFsara (www.surfsara.nl) for the support in using the Lisa Compute Cluster.
Author Contributions
Conceived and designed the experiments: AG EVDG PRO. Performed the experiments: AG. Analyzed the data: AG. Wrote the paper: AG EVDG PRO.
References
1. Peters R. Nucleo-cytoplasmic flux and intracellular mobility in single hepatocytes measured by fluores-cence microphotolysis. The EMBO Journal. 1984; 3(8):1831. PMID:6207019
2. Feldherr C, Akin D. The location of the transport gate in the nuclear pore complex. Journal of Cell Sci-ence. 1997; 110(24):3065. PMID:9365276
3. Peters R. Translocation through the nuclear pore: Kaps pave the way. Bioessays. 2009; 31:466–477.
doi:10.1002/bies.200800159PMID:19274657
4. Terry LJ, Shows EB, Wente SR. Crossing the nuclear envelope: hierarchical regulation of nucleocyto-plasmic transport. Science. 2007; 318(5855):1412–1416. doi:10.1126/science.1142204PMID: 18048681
5. Yang Q, Rout MP, Akey CW. Three-dimensional architecture of the isolated yeast nuclear pore com-plex: functional and evolutionary implications. Molecular Cell. 1998; 1(2):223–234. doi:10.1016/ S1097-2765(00)80023-4PMID:9659919
6. Rout MP, Aitchison JD, Suprapto A, Hjertaas K, Zhao Y, Chait BT. The yeast nuclear pore complex: composition, architecture, and transport mechanism. Journal of Cell Biology. 2000; 148(4):635. doi:10. 1083/jcb.148.4.635PMID:10684247
7. Denning DP, Patel SS, Uversky V, Fink AL, Rexach M. Disorder in the nuclear pore complex: the FG repeat regions of nucleoporins are natively unfolded. Proceedings of the National Academy of Sciences of the United States of America. 2003; 100(5):2450. doi:10.1073/pnas.0437902100PMID:12604785
8. Strawn LA, Shen T, Shulga N, Goldfarb DS, Wente SR. Minimal nuclear pore complexes define FG repeat domains essential for transport. Nature Cell Biology. 2004; 6(3):10–206. doi:10.1038/ncb1097
9. Frey S, Richter RP, Görlich D. FG-rich repeats of nuclear pore proteins form a three-dimensional mesh-work with hydrogel-like properties. Science. 2006; 314(5800):815. doi:10.1126/science.1132516
PMID:17082456
10. Rout MP, Aitchison JD, Magnasco MO, Chait BT. Virtual gating and nuclear transport: the hole picture. Trends in Cell Biology. 2003; 13(12):622–628. doi:10.1016/j.tcb.2003.10.007PMID:14624840
11. Lim RYH, Fahrenkrog B, Koser J, Schwarz-Herion K, Deng J, Aebi U. Nanomechanical basis of selec-tive gating by the nuclear pore complex. Science. 2007; 318(5850):640. doi:10.1126/science.1145980
PMID:17916694
12. Yamada J, Phillips JL, Patel S, Goldfien G, Calestagne-Morelli A, Huang H, et al. A bimodal distribution of two distinct categories of intrinsically-disordered structures with separate functions in FG nucleopor-ins. Molecular & Cellular Proteomics. 2010;. doi:10.1074/mcp.M000035-MCP201
14. Wälde S, Kehlenbach RH. The Part and the Whole: functions of nucleoporins in nucleocytoplasmic transport. Trends in cell biology. 2010; 20(8):461–469. doi:10.1016/j.tcb.2010.05.001PMID: 20627572
15. Ma J, Goryaynov A, Sarma A, Yang W. Self-regulated viscous channel in the nuclear pore complex. Proceedings of the National Academy of Sciences. 2012; 109(19):7326–7331. doi:10.1073/pnas. 1201724109
16. Paine PL, Moore LC, Horowitz SB. Nuclear envelope permeability. Nature. 1975; 254(5496):109–114.
doi:10.1038/254109a0PMID:1117994
17. Keminer O, Peters R. Permeability of single nuclear pores. Biophysical journal. 1999; 77(1):217–228.
doi:10.1016/S0006-3495(99)76883-9PMID:10388751
18. Mohr D, Frey S, Fischer T, Güttler T, Görlich D. Characterisation of the passive permeability barrier of nuclear pore complexes. The EMBO journal. 2009; 28(17):2541–2553. doi:10.1038/emboj.2009.200
PMID:19680228
19. Naim B, Brumfeld V, Kapon R, Kiss V, Nevo R, Reich Z. Passive and facilitated transport in nuclear pore complexes is largely uncoupled. Journal of Biological Chemistry. 2007; 282(6):3881–3888. doi: 10.1074/jbc.M608329200PMID:17164246
20. Fiserova J, Richards SA, Wente SR, Goldberg MW. Facilitated transport and diffusion take distinct spa-tial routes through the nuclear pore complex. Journal of Cell Science. 2010; 123(16):2773–2780. doi: 10.1242/jcs.070730PMID:20647373
21. Ma J, Yang W. Three-dimensional distribution of transient interactions in the nuclear pore complex obtained from single-molecule snapshots. Proceedings of the National Academy of Sciences. 2010; 107(16):7305. doi:10.1073/pnas.0908269107
22. Fribourg S, Braun IC, Izaurralde E, Conti E. Structural basis for the recognition of a nucleoporin FG repeat by the NTF2-like domain of the TAP/p15 mRNA nuclear export factor. Molecular Cell. 2001; 8 (3):645–656. doi:10.1016/S1097-2765(01)00348-3PMID:11583626
23. Bayliss R, Ribbeck K, Akin D, Kent HM, Feldherr CM, Görlich D, et al. Interaction between NTF2 and xFxFG-containing nucleoporins is required to mediate nuclear import of RanGDP. Journal of Molecular Biology. 1999; 293(3):579–593. doi:10.1006/jmbi.1999.3166PMID:10543952
24. Ribbeck K, Görlich D. The permeability barrier of nuclear pore complexes appears to operate via hydro-phobic exclusion. The EMBO journal. 2002; 21(11):2664–2671. doi:10.1093/emboj/21.11.2664PMID: 12032079
25. Bayliss R, Littlewood T, Stewart M. Structural basis for the interaction between FxFG nucleoporin repeats and importin-βin nuclear trafficking. Cell. 2000; 102(1):99–108. doi:10.1016/S0092-8674(00) 00014-3PMID:10929717
26. Naim B, Zbaida D, Dagan S, Kapon R, Reich Z. Cargo surface hydrophobicity is sufficient to overcome the nuclear pore complex selectivity barrier. The EMBO Journal. 2009; 28(18):2697–2705. doi:10. 1038/emboj.2009.225PMID:19680225
27. Isgro TA, Schulten K. Cse1p-binding dynamics reveal a binding pattern for FG-repeat nucleoporins on transport receptors. Structure. 2007; 15(8):977–991. doi:10.1016/j.str.2007.06.011PMID:17698002
28. Isgro TA, Schulten K. Binding dynamics of isolated nucleoporin repeat regions to importin-β. Structure. 2005; 13(12):1869–1879. doi:10.1016/j.str.2005.09.007PMID:16338415
29. Isgro TA, Schulten K. Association of nuclear pore FG-repeat domains to NTF2 import and export com-plexes. Journal of Molecular Biology. 2007; 366(1):330–345. doi:10.1016/j.jmb.2006.11.048PMID: 17161424
30. Morrison J, Yang JC, Stewart M, Neuhaus D. Solution NMR study of the interaction between NTF2 and nucleoporin FxFG repeats. Journal of Molecular Biology. 2003; 333(3):587–603. doi:10.1016/j.jmb. 2003.08.050PMID:14556747
31. Goryaynov A, Yang W. Role of Molecular Charge in Nucleocytoplasmic Transport. PloS one. 2014; 9 (2):e88792. doi:10.1371/journal.pone.0088792PMID:24558427
32. Krishnan V, Lau EY, Yamada J, Denning DP, Patel SS, Colvin ME, et al. Intramolecular Cohesion of Coils Mediated by Phenylalanine–Glycine Motifs in the Natively Unfolded Domain of a Nucleoporin.
PLoS Computational Biology. 2008; 4(8). doi:10.1371/journal.pcbi.1000145PMID:18688269
33. Miao L, Schulten K. Transport-Related Structures and Processes of the Nuclear Pore Complex Studied through Molecular Dynamics. Structure. 2009; 17(3):449–459. doi:10.1016/j.str.2008.12.021PMID: 19278659
35. Moussavi-Baygi R, Jamali Y, Karimi R, Mofrad M. Biophysical coarse-grained modeling provides insights into transport through the nuclear pore complex. Biophysical Journal. 2011; 100(6):1410–
1419. doi:10.1016/j.bpj.2011.01.061PMID:21402022
36. Ando D, Zandi R, Kim YW, Colvin M, Rexach M, Gopinathan A. Nuclear Pore Complex Protein Sequences Determine Overall Copolymer Brush Structure and Function. Biophysical journal. 2014; 106(9):1997–2007. doi:10.1016/j.bpj.2014.03.021PMID:24806932
37. Ghavami A, Veenhoff LM, van der Giessen E, Onck PR. Probing the Disordered Domain of the Nuclear Pore Complex through Coarse-Grained Molecular Dynamics Simulations. Biophysical Journal. 2014; 107(6):1393–1402. doi:10.1016/j.bpj.2014.07.060PMID:25229147
38. Mincer JS, Simon SM. Simulations of nuclear pore transport yield mechanistic insights and quantitative predictions. Proceedings of the National Academy of Sciences. 2011; 108(31):E351. doi:10.1073/ pnas.1104521108
39. Moussavi-Baygi R, Jamali Y, Karimi R, Mofrad MRK. Brownian dynamics simulation of nucleocytoplas-mic transport: a coarse-grained model for the functional state of the nuclear pore complex. PLoS Computational Biology. 2011; 7(6):e1002049. doi:10.1371/journal.pcbi.1002049PMID:21673865
40. Tagliazucchi M, Peleg O, Kröger M, Rabin Y, Szleifer I. Effect of charge, hydrophobicity, and sequence of nucleoporins on the translocation of model particles through the nuclear pore complex. Proceedings of the National Academy of Sciences. 2013; 110(9):3363–3368. doi:10.1073/pnas.1212909110
41. OsmanovićD, Ford IJ, Hoogenboom BW. Model inspired by nuclear pore complex suggests possible
roles for nuclear transport receptors in determining its structure. Biophysical journal. 2013; 105 (12):2781–2789. doi:10.1016/j.bpj.2013.11.013PMID:24359750
42. Ghavami A, van der Giessen E, Onck PR. Coarse-grained potentials for local interactions in unfolded proteins. Journal of Chemical Theory and Computation. 2012; 9(1):432–440. doi:10.1021/ct300684j
PMID:26589045
43. Hess B, Kutzner C, van der Spoel D, Lindahl E. Gromacs 4: Algorithms for highly efficient, load-bal-anced, and scalable molecular simulation. J Chem Theory Comput. 2008; 4(3):435–447. doi:10.1021/ ct700301qPMID:26620784
44. Izaguirre JA, Catarello DP, Wozniak JM, Skeel RD. Langevin stabilization of molecular dynamics. The Journal of Chemical Physics. 2001; 114:2090. doi:10.1063/1.1332996
45. Alber F, Dokudovskaya S, Veenhoff LM, Zhang W, Kipper J, Devos D, et al. The molecular architecture of the nuclear pore complex. Nature. 2007; 450(7170):695–701. doi:10.1038/nature06405PMID: 18046406
46. Alber F, Dokudovskaya S, Veenhoff LM, Zhang W, Kipper J, Devos D, et al. Determining the architec-tures of macromolecular assemblies. Nature. 2007; 450(7170):683–694. doi:10.1038/nature06404
PMID:18046405
47. Rangl M, Ebner A, Yamada J, Rankl C, Tampé R, Gruber HJ, et al. Single-Molecule Analysis of the Recognition Forces Underlying Nucleo-Cytoplasmic Transport. Angewandte Chemie. 2013; 125 (39):10546–10549. doi:10.1002/ange.201305359
48. Torrie GM, Valleau JP. Nonphysical sampling distributions in Monte Carlo free-energy estimation: Umbrella sampling. Journal of Computational Physics. 1977; 23(2):187–199. doi:10.1016/0021-9991 (77)90121-8
49. Milchev A, Dimitrov D, Binder K. Excess free energy of nanoparticles in a polymer brush. Polymer. 2008; 49(17):3611–3618. doi:10.1016/j.polymer.2008.04.032
50. Merlitz H, Wu CX, Sommer JU. Inclusion free energy of nanoparticles in polymer brushes. Macromole-cules. 2012; 45(20):8494–8501. doi:10.1021/ma301781b
51. Egorov S. Insertion of nanoparticles into polymer brush under variable solvent conditions. The Journal of chemical physics. 2012; 137(13):134905. doi:10.1063/1.4757017PMID:23039611
52. Ermilov V, Lazutin A, Halperin A. Colloids in brushes: the insertion free energy via Monte Carlo simula-tion with umbrella sampling. Macromolecules. 2010; 43(7):3511–3520. doi:10.1021/ma9027273
![Fig 1. The geometrical model of the NPC and cargoes. (A) (left) The core scaffold of the NPC, reconstructed based on the structural model proposed in [45], (right) a snapshot taken from an umbrella sampling simulation for a cargo with D = 10 nm](https://thumb-eu.123doks.com/thumbv2/123dok_br/16333094.188352/4.918.302.803.115.589/geometrical-scaffold-reconstructed-structural-proposed-umbrella-sampling-simulation.webp)