Bi-objective Evolutionary Heuristics for Bus Drivers
Rostering
Margarida Moz, Ana Respício and Margarida Vaz Pato
Bi-objective Evolutionary Heuristics for Bus Drivers Rostering
Margarida Moz1,3, Ana Respício2,3, Margarida Vaz Pato1,3
1 ISEG,Technical University of Lisbon, Rua do Quelhas, 6, 1200-781, Lisboa, Portugal. {mmoz;
2
FC, University of Lisbon, DI, Bloco C6, piso 3, Cidade Universitária, 1749-016 Lisboa, Portugal. [email protected]
3 Centro de Investigação Operacional, University of Lisbon
Abstract
The Bus Driver Rostering Problem refers to the assignment of drivers to the daily schedules of the company’s buses, during a planning period of a given duration. The drivers’ schedules must comply with legal and institutional rules, namely the Labour Law, labour agreements and the company’s specific regulations. This paper presents a bi-objective model for the problem and two evolutionary heuristics differing as to the strategies adopted to approach the Pareto frontier. The first one, the utopian strategy, extends elitism to include an unfeasible solution in the population, and the second one is an adapted version of the well known SPEA2 (Strength Pareto Evolutionary Algorithm). The heuristics’ empirical performance is studied with computational tests on a set of instances generated from vehicle and crew schedules. This research shows that both methodologies are adequate to tackle the instances of the Bus Driver Rostering Problem. In fact, in short computing times, they provide the planning department, with several feasible solutions, rosters that are very difficult to obtain manually and, in addition, identify among them the efficient solutions of the bi-objective model.
Keywords:
bus drivers rostering, bi-objective problems, genetic algorithms1. Introduction
Personnel scheduling and rostering has been in the operation researchers’ agenda since Dantzig’s paper on scheduling collectors at toll booths (Dantzig 1954).
The rostering problem may arise in several contexts, namely, in the transportation sector and in the health care sector. Transport operators, in particular, require very careful management of human resources in view of the increasing burden of costs and the need to provide a high quality service. All rosters must satisfy institutional and legal regulations, and a good roster should also comply with workers’ preferences. These are not only important for the workers themselves, but also for the employer, insofar as worker satisfaction lowers the incidence of professional illness, accidents and absenteeism. Consequently, bus driver rostering naturally calls for a multi-objective model.
studies are based on sequential heuristic procedures designed to tackle particular cases (Odoni et al. 1994).
The mathematical models for transit crew rostering found in the literature are either based on multilevel networks (Carraresi and Gallo 1984’ seminal work; Bianco et al. 1992); or within set covering/partitioning (Catanas and Paixão 1995). These approaches do not cope with some real world specificities, since transit crew rostering gives rise to high dimension instances. Multi-objective models have already been proposed for the air crew rostering problem (Lucic and Teodorovic 1999). But, to the authors’ knowledge, there is no work in the literature on multi-objective models for transit crew rostering. For a general survey on multi-objective issues for scheduling under different contexts see Silva, Burke and Petrovic, 2004.
Hence, new methodologies to efficiently tackle real instances of this class of highly constrained multi-objective problems are called for. In this paper, a bi-objective model for the Bus Driver Rostering Problem is presented in section 2 and two evolutionary heuristics are proposed in section 3, followed by computational results in section 4 and final comments in section 5.
2. Problem
Description
The Bus Driver Rostering Problem (BRP) consists of building a schedule for the company’s bus drivers over a planning period of length m (m – number of days, usually multiple of 7), the rostering period, so as to cover the demand of day t, dt (t=1,…, m), that is, to cover all the daily duties of the
period.
By the word ‘schedule’ one means a sequence of daily duties and days off with length m, while ‘duty’ refers to a set of pieces of work with breaks and idle times, to be performed by a single driver during a specific day. The set of all the drivers’ schedules in a planning period is called a roster. This problem takes as input the duties of each day of the rostering period, that is, the output of m crew scheduling problems.
Rosters must comply with the conditions and rules imposed by labour union contracts, institutional and legal requirements that establish the hard constraints, such as the number of days-off per week, specific days-off per week, a minimum and a maximum number of days for the length of a rest period, a minimum number of Sundays/weekends off in the planning period, a minimum number of rest hours between two consecutive work periods and a minimum and a maximum number of days for the length of a work period.
Rosters that cover the demand and satisfy the established conditions and rules may be distinguished by the different features that qualify them as good or bad, according to distinct interests or points of view. For example, good rosters are characterised by equity in the distribution of weekends/Sundays off among drivers, equity in the distribution of overtime work, equity in the distribution of late duties and, where company’ goals are concerned, low cost of assignments, and small gaps between each driver’s overall scheduled hours and the respective contracted hours per period. These requirements are generally taken as soft constraints, as distinct from hard ones.
Therefore, the BRP sets out to determine a roster capable of fulfilling the demand, besides satisfying the hard conditions, and of optimising one or more objectives defined from the soft constraints.
late duties that may start after 15:30 h until 24:00 h. For each rostering period of m days, the set of duties to be covered, as well as the respective type and length and also the ideal workforce size (ni), are known in advance.
The hard constraints of the BRP may be summarised as follows:
− each driver must have two or three consecutive days off;
− each driver must have at least two days off in each week;
− each driver must not work more than six consecutive days;
− drivers must, on average, work no more than eight hours per day;
− each driver must have at least one Sunday off in each rostering period;
− some drivers must have weekends off;
− drivers must rest eleven hours between two consecutive duties, meaning that an early duty in a day cannot be assigned to a driver that has worked on a late duty the previous day.
As soft constraints this problem considers that:
− overtime work should be fairly distributed among drivers;
− the number of scheduled drivers should be less than or equal to the ideal workforce size.
This rostering problem is formulated as a bi-objective optimisation model imposing the satisfaction of the two soft constraints as objectives and defining the feasible region by the hard constraints. Different measures to evaluate the satisfaction of the soft constraints can be used. Here, however, the option favoured, for the first soft constraint, the maximum of the individual overtime work, whereas, for the second, the scheduled workforce over the ideal dimension, in other words:
− objective 1: minimise max {f1, f2, …, fn}, where fj is the overtime of driver j during the
rostering period;
− objective 2: minimise max{nw-ni,0}, where nw is the number of drivers scheduled during the rostering period.
Note that, the two objectives in fact represent the interests of both entities involved in the problem: bus drivers and company’s administration. Minimising the scheduled workforce over the ideal number of drivers (objective 2) allows the assignment of nonscheduled workers to other departments, and at the same time increases the workload of the drivers scheduled. On the other hand, objective 1 not only reduces this extra work, but also distributes it equitably among drivers.
This is a highly complex problem, similar to crew rostering problems arising in air transport companies (Cappanera and Gallo 2004) and nurse rostering in hospital units that has been proved to be NP-hard (Moz and Pato 2006). Due to the high complexity of the problem and to the dimension of its real life instances, heuristics are generally appropriate, and particularly the evolutionary heuristics that have been successfully applied to other bi-objective problems, including the nurse (re)rostering issue (Pato and Moz 2006).
3. Evolutionary
Heuristics
3.1 Common Features
The encoding of individuals and the decoder (to obtain solutions from the individuals) are identical for both evolutionary algorithms being tested.
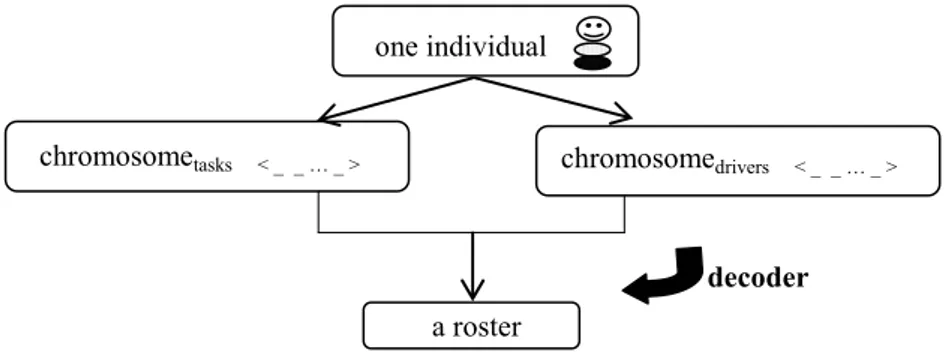
Each individual is characterised by a pair of chromosomes, one representing the list of tasks and the other the list of drivers. The two lists, with tasks and drivers taken randomly, are represented by integer vectors.
In order to obtain a solution for the BRP, i.e., an individual, one must take a pair of different type chromosomes and run the decoder that corresponds to a specific constructive heuristic, as shortly represented in figure 1. Briefly, the constructive heuristic has a main step where each non-assigned task is given to a driver according to hierarchically ordered rules which impose satisfaction of the hard constraints. It is important to stress that this simple heuristic may yield an unfeasible solution, that is, a roster that does not satisfy all hard constraints.
chromosometasks < _ _ … _ >
a roster one individual
decoder
chromosomedrivers < _ _ … _ >
Fig. 1. Encoding and decoding
The genetic operators act independently on the two types of chromosomes of individuals taken from the mating pool, previously created by selection. The crossover operator applies in the same way to the parents’ pairs of chromosomes of the same type (tasks or drivers). Then, two new individuals are generated by applying the decoder. For the mutation operator, one opted in favour of swapping the position of two genes of each chromosome of an individual that has just been selected for mutation. The crossover and the mutation probabilities are respectively 0.8 and 0.2.
All these features were developed for a single objective nurse rerostering problem by Moz and Pato (2006).
3.2 Utopic Genetic Heuristic
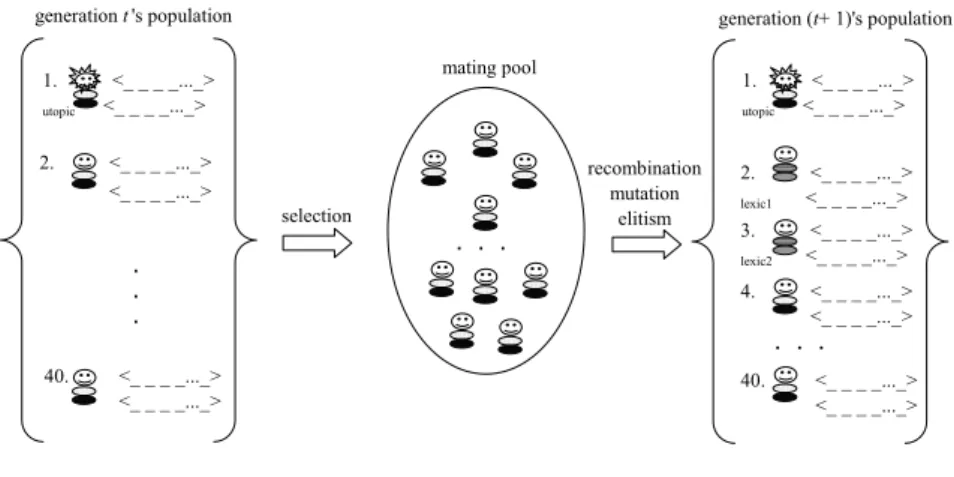
UGH includes the components of the abovementioned single objective genetic heuristic, although the fitness of the individuals comes from a Pareto genetic approach (Goldberg 1989) enhanced with a utopic elitism adapted from Pato and Moz (2006) for a nurse re-rostering issue involving different objectives than those tackled here. Several possibilities for the algorithm parameters were tested, in a real case from nurse rostering, and the option favoured the values that are used. In figure 2, the basic components of UGH are synthesised.
40. <_ _ _ _..._> <_ _ _ _..._>
. . .
1. <_ _ _ _..._>
utopic <_ _ _ _..._>
4. <_ _ _ _..._> <_ _ _ _..._> 40. <_ _ _ _..._> <_ _ _ _..._>
. . .
generation t's population generation (t+1)'s population
selection
mating pool
recombination mutation
elitism
. . .
1. <_ _ _ _..._>
utopic <_ _ _ _..._>
2. <_ _ _ _..._>
lexic1 <_ _ _ _..._>
2. <_ _ _ _..._>
<_ _ _ _..._>
3. <_ _ _ _..._>
lexic2 <_ _ _ _..._>
Fig. 2. The Utopic Genetic Heuristic
The fitness of each individual must reflect the bi-objective nature of the problem. Hence, as mentioned above, in the case of the UGH it is calculated according to the position of the respective point in the objectives’ space relatively to the Pareto frontier, the so-called Pareto rank. The fitness is defined as the inverse of the Pareto rank. For the rosters that do not satisfy all the hard constraints, the respective fitness value is penalised. As a result, those individuals belong to the last rank and obtain the least fitness value.
The selection operator is based on the roulette wheel procedure: the probability of an individual to enter the mating pool, in each generation being directly proportional to its fitness.
Then, the genetic operators act over the individuals of the mating pool, thus creating the population for the next generation. The recombination operator is a standard PMX crossover, specific for natural encoding, that randomly matches individuals from the mating pool.
Elitism is performed by forcing into the population, in each generation:
− two individuals corresponding to the lexicographic points, each registering the best value for one of the objectives;
− one individual corresponding to an ideal unfeasible solution, the utopic individual.
by the roulette wheel for the mating pool. Such a strategy not only enforces the search towards the exact Pareto frontier, attracting individuals to the optimal set, but also creates population diversity.
3.3 Adapted SPEA2
ASP is an adaptation of the SPEA2 – the improved Strength Pareto Evolutionary Algorithm (Zitzler et al. 2002). SPEA2 has been compared with other recent multi-objective heuristic techniques producing very good results. The main features of the algorithm include elitism, a fine-grained fitness assignment scheme and diversity of solutions in each generation. The elitism is enforced by keeping potentially non-dominated individuals in an archive of size equal to 10. As stated above, ASP embeds the main components of UGH, including the two chromosome representation of each individual, the decoder, and the initialisation procedure.
In each generation, the fitness value of each individual is computed in three steps. Firstly, the force of each individual counts the number of individuals it potentially dominates. Secondly, the raw fitness of each individual sums up the forces of all the individuals that potentially dominate it. Thirdly, an estimation for the diversity measure is added to the raw fitness aiming at penalising the solutions in
more crowded regions of the objectives’ space. This measure is given by 2 1
+
k
σ , where σk is the
distance to the kth nearest neighbour with k=7, the integer part of the square root of the total number of individuals in the generation (40+10). The algorithm searches for solutions with minimum fitness and potentially efficient solutions receive a fitness value below 1.
The mating pool is built by performing selection through a binary tournament over all the individuals. This operator consists of randomly choosing two individuals from the union of the current population with the current archive. The individual with the lowest fitness is introduced into the mating pool. The recombination operator is a standard OX crossover.
4. Computing Results
The proposed approaches were tested over 21 instances obtained from the output provided by the exact solutions of the integrated multi-depot vehicle and crew scheduling problem (Mesquita et al. 2005) and the institutional requirements and norms of a bus company in Lisbon, besides the Portuguese Labour Law and the drivers’ union contracts.
The main data of these instances is as follows:
− length of the rostering period, m=28 days;
− number of drivers, n=45, and ideal workforce size, ni;
− last day off and last duty assigned to each driver in the previous period;
− number of duties to cover in each day, dt (t=1,...,28), different for work days and weekend
days;
− starting time and duration of duties.
Tables 1, 2 and 3 present average results taken from the last generation of 10 runs per instance, identified in column 1. The BRP instances are grouped according to the size of the integrated multi-depot vehicle and crew scheduling instances from which they come. One set involves 80 trips (P0_80 to P10_80), and the other 100 trips (P1_100 to P10_100).
The following columns found in tables 1 and 2 show some absolute metrics for the quality of the population of the last generation of UGH and ASP respectively, whereas table 3 evaluates both evolutionary heuristics through a relative behaviour metric – the dominance metric – and the computing times in seconds. The computational experiment undertaken with UGH ran on a 2.6Ghz and 256Mb RAM Intel Pentium 4 processor and the respective procedures were coded in Pascal (Borland Delphi 5.0). ASP procedures were coded in C and ran on a 2.8Ghz and 512Mb RAM Intel Pentium 4 processor.
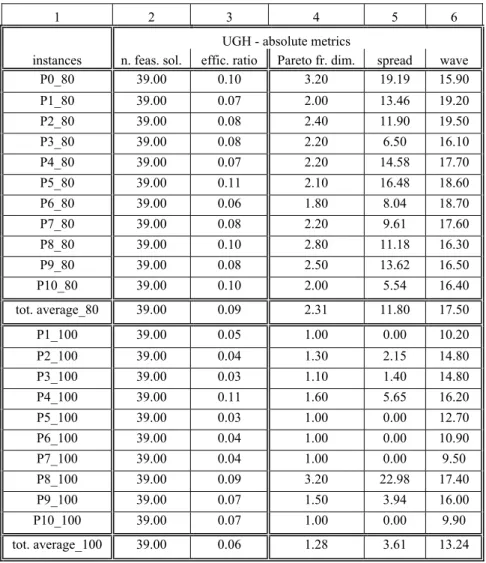
Table 1. Computational results of UGH – averages from 10 runs per instance
1 2 3 4 5 6
UGH - absolute metrics
instances n. feas. sol. effic. ratio Pareto fr. dim. spread wave
P0_80 39.00 0.10 3.20 19.19 15.90
P1_80 39.00 0.07 2.00 13.46 19.20
P2_80 39.00 0.08 2.40 11.90 19.50
P3_80 39.00 0.08 2.20 6.50 16.10
P4_80 39.00 0.07 2.20 14.58 17.70
P5_80 39.00 0.11 2.10 16.48 18.60
P6_80 39.00 0.06 1.80 8.04 18.70
P7_80 39.00 0.08 2.20 9.61 17.60
P8_80 39.00 0.10 2.80 11.18 16.30
P9_80 39.00 0.08 2.50 13.62 16.50
P10_80 39.00 0.10 2.00 5.54 16.40
tot. average_80 39.00 0.09 2.31 11.80 17.50
P1_100 39.00 0.05 1.00 0.00 10.20
P2_100 39.00 0.04 1.30 2.15 14.80
P3_100 39.00 0.03 1.10 1.40 14.80
P4_100 39.00 0.11 1.60 5.65 16.20
P5_100 39.00 0.03 1.00 0.00 12.70
P6_100 39.00 0.04 1.00 0.00 10.90
P7_100 39.00 0.04 1.00 0.00 9.50
P8_100 39.00 0.09 3.20 22.98 17.40
P9_100 39.00 0.07 1.50 3.94 16.00
P10_100 39.00 0.07 1.00 0.00 9.90
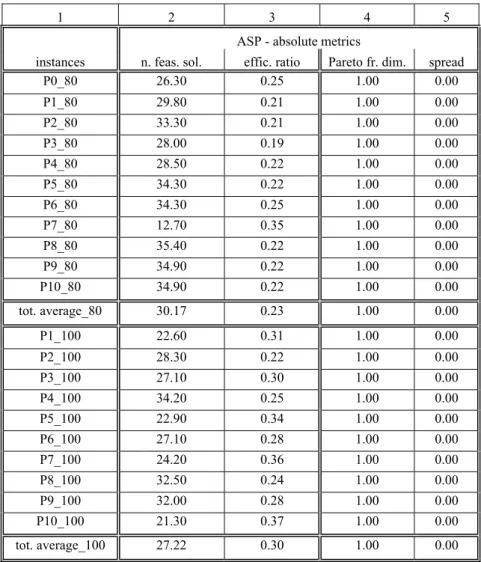
In tables 1 and 2, columns 2 and 3 present the average number of feasible solutions in the last population of each evolutionary process and the average values of the efficiency ratio – the proportion of efficient solutions in the total number of feasible solutions, for the respective heuristic.
Table 2. Computational results of ASP – averages from 10 runs per instance
1 2 3 4 5
ASP - absolute metrics
instances n. feas. sol. effic. ratio Pareto fr. dim. spread
P0_80 26.30 0.25 1.00 0.00
P1_80 29.80 0.21 1.00 0.00
P2_80 33.30 0.21 1.00 0.00
P3_80 28.00 0.19 1.00 0.00
P4_80 28.50 0.22 1.00 0.00
P5_80 34.30 0.22 1.00 0.00
P6_80 34.30 0.25 1.00 0.00
P7_80 12.70 0.35 1.00 0.00
P8_80 35.40 0.22 1.00 0.00
P9_80 34.90 0.22 1.00 0.00
P10_80 34.90 0.22 1.00 0.00
tot. average_80 30.17 0.23 1.00 0.00
P1_100 22.60 0.31 1.00 0.00
P2_100 28.30 0.22 1.00 0.00
P3_100 27.10 0.30 1.00 0.00
P4_100 34.20 0.25 1.00 0.00
P5_100 22.90 0.34 1.00 0.00
P6_100 27.10 0.28 1.00 0.00
P7_100 24.20 0.36 1.00 0.00
P8_100 32.50 0.24 1.00 0.00
P9_100 32.00 0.28 1.00 0.00
P10_100 21.30 0.37 1.00 0.00
tot. average_100 27.22 0.30 1.00 0.00
Columns 4 and 5 of the same tables display the average dimension of the Pareto frontier of the last generation – the number of non-dominated points in the objective’s space, and the average spread metric – the Euclidean distance between the two lexicographic points, whereas column 6 in table 1 refers to the wave metric – the average number of different ranks, again in the population of the last generation.
From the objective’s space perspective, the analysis of the last generation (columns 4 to 6 in table 1 and columns 4 and 5 in table 2) shows that ASP found one single non-dominated point, while the three metrics for UGH reveal a considerable diversity of points in the last population: the Pareto frontier dimension is, on average, 2.31 for all the runs with the 11 instances of 80 trips, and 1.28 in the case of 100 trips (column 4, table 1); the spread metric is, on average, 11.8 and 3.61, respectively (column 5, table 1); the wave metric per instance ranges, on average, from 9.5 different Pareto ranks (for P7_100) to 19.2 (for P2_80).
Table 3. Comparative computational results of the evolutionary heuristics – averages from 10 runs per instance
1 2 3 4 5
relative metrics time
dominated dominated (in seconds)
instances UGH ASP UGH ASP
P0_80 0.33 0.00 513.34 607.00
P1_80 0.66 0.00 427.80 369.15
P2_80 1.00 0.00 398.54 341.00
P3_80 0.50 0.00 437.33 399.55
P4_80 0.25 0.00 433.95 390.71
P5_80 0.00 1.00 436.19 366.05
P6_80 0.50 0.00 427.63 346.99
P7_80 0.66 0.00 443.58 390.75
P8_80 1.00 0.00 473.59 460.93
P9_80 1.00 0.00 431.16 377.50
P10_80 0.00 0.00 476.30 393.12
tot. average_80 0.54 0.09 445.40 403.89
P1_100 0.00 1.00 570.46 478.58
P2_100 0.00 1.00 526.02 430.20
P3_100 0.00 1.00 531.30 431.47
P4_100 0.00 0.00 504.05 397.06
P5_100 0.00 1.00 534.93 428.93
P6_100 0.00 1.00 493.96 352.45
P7_100 0.00 1.00 534.71 409.81
P8_100 0.00 0.00 551.55 468.29
P9_100 0.00 1.00 575.05 477.36
P10_100 0.00 1.00 477.03 312.93
tot. average_100 0.00 0.80 529.91 418.71
The computing times, in columns 4 and 5, are acceptable for both heuristics and remain far below the two hour limit stipulated by the planning department.
In summarising, both evolutionary approaches achieve several feasible solutions. These will provide the decision-making agents with more alternatives from which they may choose the roster to be published for the next planning period. However, the Utopic Genetic Heuristic reveals a higher diversity of solutions, which is important in this context. But, on the other hand, ASP attained more solutions that are candidates for efficiency, bearing in mind that we do not, as yet, know the exact Pareto frontier.
5. Final Comments
Two bi-objective evolutionary heuristics, UGH and ASP, were designed to cope with a wide variety of rostering situations. In this paper, the computational experiment concerns the specific case of a bus transport company in Portugal, enabling one to evaluate the proposed heuristics behaviour and compare them using performance metrics.
The tests performed on two sets of different sized instances have shown that both algorithms can obtain good results while consuming an acceptable amount of CPU time. In fact, both produced a lot of feasible solutions – rosters for the company’s bus drivers that comply with all the hard constraints. They also yielded several solutions with low global violations of soft constraints. Since, for the moment, the exact Pareto frontier for the bus driver rostering bi-objective model is not known, the solutions obtained are candidate efficient solutions.
Bus driver rostering is the last decision-making problem in a hierarchy concerned with planning the operations of a transit company. It precedes implementation of the operations. However, the rostering must be conceived only once a month. Therefore, a higher CPU consumption is not prohibitive, considering the quality of the solutions we may achieve by using bi-objective evolutionary algorithms.
Concerning the objectives’ space, in general, small dimensioned Pareto frontier approximations were achieved by the evolutionary heuristics. Nevertheless, even for a single non-dominated point, the bi-objective optimisation approach provided a set of equivalent decision solutions (multiple solutions on the decision space). This allows the scheduler to consider different choices at once, in detail, thus providing an in depth knowledge of the solution space. As regarding the means of supporting decision-making in a real-world context, the leading conclusion is that, in practice, the bi-objective optimisation approach is quite appropriate.
The behaviour of UGH outperformed ASP for the larger sized instances, thus revealing that the elitism based on the utopic and the lexicographic individuals attract more individuals to the efficient solutions set.
In the future, one intends to test both heuristic methods in a broader set of real instances. Moreover, one would particularly like to explore the innovative elitism with a view to improving the SPEA2 based heuristic.
5. References
Bianco L, Bielli M, Mingozzi MA, Ricciardelli S, Spadoni M (1992) A Heuristic Procedure for the Crew Rostering Problem. EJOR 58: 272-283.
Cappanera P, Gallo G (2004) A Multicommodity Flow Approach to the Crew Rostering Problem. Operations Research 52: 583-596.
Carraresi P, Gallo G (1984) A Multilevel Bottleneck Assignment Approach to the Bus Driver’s Rostering Problem. EJOR 16: 163-173.
Catanas F, Paixão J (1995) A New Approach for the Crew Rostering Problem. In Daduna J, Branco I, Paixão J (eds). Computer Aided Transit Scheduling. Lect. Notes Econ Math. Syst. 430 Springer: 267-277.
Collette Y, Siarry P (2005) Three New Metrics to Measure the Convergence of Metaheuristics towards the Pareto Frontier and the Aesthetic of a Set of Solutions in Biobjective Optimization. Computers and Operations Research 32:773-792.
Dantzig GB (1954) A Comment on Edie’s ‘Traffic Delays at Toll Booths’. Journal of the Operations Research Society of America 2: 339-341.
Ernst A, Jiang H, Krishnamoorthy M, Sier D (2004) Staff Scheduling and Rostering: A Review of Applications, Methods and Models. EJOR 153: 3-27.
Goldberg D (1989) Genetic Algorithms in Search, Optimization and Machine Learning, MA: Addison-Wesley. Lucic P, Teodorovic D (1999) Simulated Annealing for the Multi-objective Aircrew Rostering Problem.
Transportation Research Part A 33:19-45.
Mesquita M, Paias A, Respício A (2005) Exact Solutions for the Vehicle and Crew Scheduling Problem. Proceedings of INOC 2005 - International Network Optimization Conference, Lisbon: B2.300-306.
Moz M, Pato MV (2006) A Genetic Algorithm Approach to a Nurse Rerostering Problem. Computers and Operations Research 34:667-691.
Odoni A, Rousseau J-M, Wilson N (1994) Models in Urban and Air Transportation. In Pollock S, Rothkopf M, Barnett A (eds). Operations Research in the Public Sector. Handbooks in Operations Research and Management Science 6, North-Holland: 107-150.
Pato MV, Moz M (2006) Solving a Bi-objective Nurse Rerostering Problem by Using a Utopic Genetic Heuristic. Working paper 8/2006, Centro de Investigação Operacional, Universidade de Lisboa (submitted to publication).
Silva JDL, Burke EK, Petrovic S (2004) An Introduction to Multiobjective Metaheuristics for Scheduling and Timetabling”. In Gandibleux X, Sevaux M, Sörensen K, T’kindt V (eds) Metaheuristics for Multiobjective Optimisation. Springer, Berlin, Germany: 91-129.