“NOTICE: this is the author’s version of a work that was accepted for publication in Journal of Biomechanics. Changes resulting from the publishing process, such as peer review, editing, corrections, structural formatting, and other quality control mechanisms may not be reflected in this document. Changes may have been made to this work since it was submitted for publication. A definitive version will be subsequently published in Journal of Biomechanics, [VOL.41,pp. 2188-2197, (2008)].”
RADIAL DISPERSION OF RED BLOOD CELLS IN BLOOD FLOWING
THROUGH GLASS CAPILLARIES: THE ROLE OF HEMATOCRIT
AND GEOMETRY
Rui LIMA1, 2, Takuji ISHIKAWA1, Yohsuke IMAI1, Motohiro TAKEDA1, 3, Shigeo WADA4,
Takami YAMAGUCHI1
1
Department of Bioengineering and Robotics, Graduate School of Engineering, Tohoku University, 6-6-01 Aoba, 980-8579 Sendai, Japan
2
Department of Mechanical Technology, ESTiG, Bragança Polytechnic Institute, C. Sta. Apolonia, 5301-857 Bragança, Portugal
3
Division of Surgical Oncology, Graduate School of Medicine, Tohoku University, 2-1 Seiryo-machi, Aoba-ku, 980-8575 Sendai, Japan
4
Department of Mechanical Science and Bioengineering, Graduate School of Engineering Science., Osaka University, Toyonaka, 560-8531 Osaka, Japan
E-mail: ruimec@ipb.pt
Key words: Blood flow, Microcirculation, Red Blood Cells, Confocal micro-PTV, Radial dispersion.
Abstract
The flow properties of blood in the microcirculation depend strongly on the hematocrit (Hct), microvessel geometry, and cell properties. Previous in vitro studies have measured the radial displacement of red blood cells (RBCs) at concentrated suspensions using conventional microscopes. However, to measure the RBCs motion they used transparent suspensions of ghost red cells, which may have different physical properties than normal RBCs. The present study introduces a new approach (confocal micro-PTV) to measure the motion of labeled RBCs flowing in concentrated suspensions of normal RBCs. The ability of confocal systems to obtain thin in-focus planes allowed us to measure the radial position of individual RBCs accurately and to consequently measure the interaction between multiple labeled RBCs. All the measurements were performed in the center plane of both 50 µm and 100 µm glass capillaries at Reynolds numbers (Re) from 0.003 to 0.005 using Hcts from 2 to 35%. To quantify the motion and interaction of multiple RBCs, we used the RBC radial dispersion (Dyy). Our results clearly demonstrate that Dyy strongly depends on the Hct. The RBCs exhibited higher Dyy at
radial positions between 0.4 R and 0.8 R and lower Dyy at locations adjacent to the wall (0.8 R–1 R) and around
the middle of the capillary (0 R–0.2 R). The present work also demonstrates that Dyy tends to decrease with a
1. Introduction
The primary function of red blood cells (RBCs) is to transport oxygen and carbon dioxide bound to intracellular hemoglobin. In the microcirculation, the flow behavior of RBCs plays a crucial role in many physiological and pathological phenomena. For example, the random-like transverse motion and rotation of RBCs in shear flow is believed to play an important role in thrombogenesis. However, the role of RBCs in the mass transport mechanism of cells and proteins to the thrombus is still not completely understood (Goldsmith and Turitto 1986, Wootton and Ku 1999, Miyazaki and Yamaguchi 2003). As a consequence, many studies have been performed on both the rheological and microrheological behavior of RBCs flowing through glass capillaries (Chien et al. 1984, Goldsmith and Turitto 1986, Shiga et al. 1990, Pries et al. 1992, Mchedlishvili and Maeda 2001).
Most studies on the microhemorheological behavior of RBCs in shear flow were performed in dilute suspensions. Using video microscopy, the motions of individual RBCs have been analyzed in detail in several studies, leading to extensive knowledge on this topic (Goldsmith 1971, Fischer et al. 1978, Bitbol 1986, Shiga 1990, Suzuki et al. 1996, Lominadze and Mchedlishvili 1999, Pries and Secomb 2003, Abkarian et al. 2006). However, one of the biggest scientific challenges in this field is related to the behavior of RBCs flowing in relatively high concentrations close to the hematocrits (Hcts) that exist in microvessels (Hct 10–26%) (Fung 1997). Despite the relevance of this phenomenon on blood mass transport, few studies have been performed, partly due to the lack of visualization techniques capable of obtaining both direct and quantitative measurements on multi-RBC motions in concentrated suspensions. An extremely important body of work in this field was carried out by Goldsmith and his coworkers (Goldsmith 1971a, 1971b, Goldsmith and Karino 1977, Goldsmith and Marlow 1979, Goldsmith and Turitto 1986, Cokelet and Goldsmith 1990). By using a traveling microscope, they were able to study the behavior of RBCs in concentrated suspensions. However, to achieve an adequate signal-to-noise ratio to permit the detection of tracer RBCs at Hct levels larger than 10%, they used ghost cells as models of erythrocytes. The preparation of ghost cells requires the rupture of the RBC membrane to allow the diffusion of hemoglobin (Hb) into the surrounding fluid (hemolysis) (Burton 1966, Caro et al. 1978). The preparation procedure of the ghost cells and also the removal of the Hb may contribute to differences in the membrane mechanical properties between ghost RBCs and normal RBCs, and consequently, the dynamic behavior of RBCs might be affected (Caro et al. 1978, Goldsmith and Marlow 1979, Nash and Meiselman 1983). The controversy as to whether ghost cell suspensions are good physical models for blood remains mainly because experimental evidence has not been obtained regarding this question. Thus, it is important to reexamine the work of Goldsmith and his colleagues by using a physiological fluid containing normal RBCs. In this way, the present study introduces a new approach to measure the radial dispersion of labeled RBCs flowing in concentrated suspensions of normal RBCs.
In this report, we introduce a new approach (confocal micro-PTV) to obtain direct and quantitative detailed descriptions of the flow behavior of RBCs in concentrated suspensions of normal RBCs. This approach eliminates the problems and concerns of the methods used in the past and provides additional detailed descriptions of RBC motion not obtainable by other methods. The ability of our system to obtain thin in-focus planes along the microchannel allows us to obtain the radial position of the RBCs accurately and to consequently measure the interaction between multiple labeled RBCs. The information provided by this study not only complements previous investigations on the microhemorheology of RBCs but also shows the influence of both Hct and geometry on the radial dispersion of RBCs. This information is important for developing a better understanding of blood mass transport mechanisms under both physiological and pathological conditions because the fluid particles as well as chemical substances in plasma are mixed by the movement of RBCs. The experiments were performed in 50 µm and 100 µm glass capillaries at Reynolds numbers (Re) from 0.003 to 0.005 using Hcts from 2 to 35%. Although it is possible to obtain measurements at several planes with our confocal system, particular emphasis was devoted to the radial dispersion of RBCs located in the middle plane.
2. Materials and methods
2.1. Working fluids, RBC labeling and experimental setup
The present study examined several working fluids with Hcts from 2 to 35%. A confocal micro-PTV (Lima 2007, Lima et al. 2008a) was used to measure the motions of labeled RBCs in the center plane of both 50 µm and 100 µm glass capillaries (see Figure 1) at Reynolds numbers (Re) from 0.003 to 0.005. For a detailed description, see Supplementary Methods online.
2.2. RBC radial dispersion coefficient and displacement
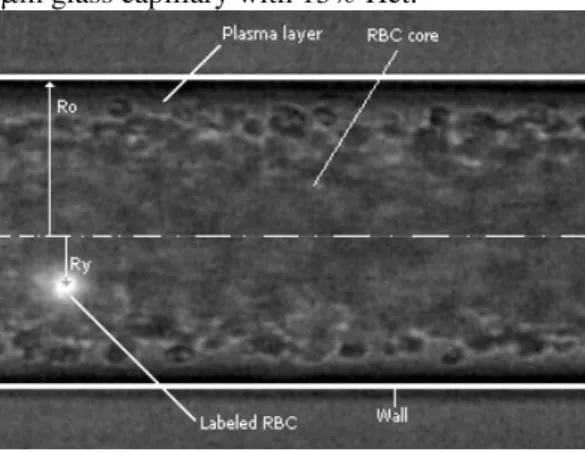
In the present study, we sought to obtain further insights into the flow behavior of RBCs in glass capillaries. Using a confocal PTV system, the paths of hundreds of labeled RBCs were measured mainly in the center plane of two different 100 µm and 50 µm capillaries. In addition, to elucidate the effect of hematocrit on the motions of individual RBCs, several Hcts (2–35%) were analyzed using Re values ranging from 0.003 to 0.005. Figure 2 shows a typical halogen and confocal image recorded in the middle plane of the 100-µm glass capillary with 15% Hct.
Figure 2. Coordinate system in the middle plane of a 100-µm capillary with 15% Hct. The image contains both halogen and laser light, which enables visualization of both labeled and non-labeled RBCs.
Detailed measurements of the motion of individual RBCs at the microscopic level are crucial to elucidating both mesoscopic and macroscopic blood flow properties. One accepted way to correlate the microscopic events with the macroscopic flow behavior is by calculating the radial dispersion coefficient (Dyy) (Goldsmith, 1971, Goldsmith and Turitto 1986). In the present study, we analyzed the motions of RBCs using Dyy (Goldsmith and Turitto 1986, Ishikawa and Pedley 2007) given by
Dyy(t)= 1
N
Ri,y(t)−Ri,y(0)
(
)
22t
i=1 N
, (1)
where Ri,y(t) – Ri,y(0) is the radial distance traveled by individual RBC i over some time interval of length t and the radial squared displacement is averaged (indicated by ) over several such time intervals. The radial dispersion coefficient is then averaged over all RBCs (N) measured by the confocal system.
3. Results
3.1. Blood flow visualization
Examples of recorded images with both labeled and non-labeled RBCs measured in the center plane of the 100-µm and 50-µm capillaries at several Hcts (2–35%) are presented online in Supplementary Results. For videos of in vitro blood (3% and 20% Hct, Re ∼ 0.005) flowing around the center plane,
see Supplementary Video 1 and 2.
3.2. Radial dispersion in a 100-µµµµm capillary at different Hcts
Figure 3. RBC dispersion coefficient at the middle plane (Dcyy) of a 100 µm glass capillary for 35% Hct, 24%
Hct , 15% Hct, 9% Hct, and 3% Hct. The Re was ∼0.005, and the
γ
ranged from ∼2 s–1 to 12 s–1. The measured values are expressed as the means ± standard deviation according to a t-test analysis at a 95% confidence interval.Figure 4. a) Schematic diagram of the different RBC position areas at the center plane. The RBC Dcyy at
different radial position intervals for b) 35% Hct, c) 24% Hct, d) 15% Hct, e) 9% Hct, and f) 3% Hct (Re ∼
The results from Figure 3 show that the Dyyc increases with the Hct. In addition, the RBC Dcyy for Hcts from 24 to 35% have almost an order of magnitude greater than the Dyyc for the 3% Hct. These results clearly demonstrate that the RBCs at dense concentrations exhibit higher erratic radial displacement compared to dilute suspensions of RBCs. In general, the results presented in Figure 4 show that Dyyc is the greatest at radial positions between 0.4 R and 0.8 R. The Dcyy near the wall is the lowest mainly because of the RBCs that roll along the wall with small radial displacements. However, for Hcts around 3%, the Dyyc seems to increase proportionally with the radial position. In this case, it was extremely difficult to observe RBCs flowing adjacent to the wall due to the tendency of the RBCs to migrate to the tube axis at dilute solutions.
3.3. Radial dispersion in a 50-µµµµm capillary at different Hcts
Several Hcts were used to obtain further information on the role of Hct in the Dcyy. Figure 5 shows the RBC dispersion coefficient at the middle plane (Dcyy) for several Hcts (2% Hct, 8% Hct, 23% Hct, and 32% Hct).
Figure 5. RBC Dyy at the middle plane ( c yy
D ) of a 50 µm glass capillary for 32% Hct, 23% Hct , 8% Hct, and
2% Hct. The Re was ∼0.003, and the
γ
ranged from ∼3 s–1 to 25 s–1. The measured values are expressed as the means ± standard deviation according to a t-test analysis at a 95% confidence interval.3.4. Effect of radial position on the RBC radial dispersion
The effect of radial position on the RBC Dcyy is presented online in Supplementary Results.
3.5. Microscopic flow behavior of RBCs
The motion of RBCs at the microscopic level was also measured (see Supplementary Results online).
4. Discussion
Mass transport in blood flow is still not completely understood, partly because of the lack of experimental data on the flow properties of cells in concentrated suspensions. It is known that RBC motions play an important role in the mass transport mechanism (Goldsmith and Turitto 1986, Munn et al. 1996, Wootton and Ku 1999, Miayazaki and Yamaguchi 2003) and can be quantified by the radial dispersion coefficient (Dcyy). In the present study, we examined the effect of Hct and microtube geometry on the Dcyy of RBCs using a confocal micro-PTV system.
Effect of Hct on the RBC radial dispersion
A previous study performed by Goldsmith and Marlow (1979) measured the effect of volume concentrations (10–93%) on the radial displacements of tracer RBCs in ghost cell suspensions. The present work extended their investigations by using labeled RBCs in normal cell suspensions and added the effect of Hcts on the RBC radial dispersion coefficient at the center plane (Dyyc ). Figure 6 illustrates the Hct effect on Dyyc for both 100 µm and 50 µm glass capillaries. Note that the Dyyc
values presented in Figure 6 were averaged with respect to the last three values obtained in Figures 3 and 5. This procedure is frequently used to determine the diffusion coefficient. However, in our study, the diffusion coefficient was not always completely constant at t = 0.4 s, so we decided to call it the radial dispersion coefficient in accordance with previous studies (Goldsmith 1971, Goldsmith and Marlow 1979, Goldsmith and Turitto 1986).
Figure 6. The effect of Hct and microtube geometry on the RBC Dcyy in 100 µm and 50 µm glass capillaries.
have shown that the radial displacements tend to decrease at Hcts greater than 50% because extremely high concentrations of ghost cells limit the amplitude of the RBC’s radial movements. In accordance with these consistent results, the development of a plasma layer at Hcts lower than 30% and the decrease in the local cell density surrounding the RBCs may be the main causes of the enhanced radial dispersion of the cells.
Effect of microtube geometry on the RBC radial dispersion
Since identifying the Fahraeus–Lindqvist effect (Fahraeus and Lindqvist 1931), many studies have attempted to clarify the main causes for the decrease in the apparent viscosity as the diameter of the microtube decreases (Chien 1970, Gaehtgens 1980, Chien et al. 1984, Goldsmith and Turitto 1986, Reinke et al. 1987, Pries et al. 1992). The present work provides quantitative data on the effect of the microtube diameter on the RBC Dcyy. The results from Figure 6 clearly demonstrate that RBC Dyyc
tends to decrease with the diameter. The reasons for this phenomenon may be due to the Hct reduction with the diameter (Fahraeus effect) and also to the geometric constraint. However, according to Pries et al. (1992), the latter reason is more likely to be the main responsible for the attenuation of the RBC transverse motion. The present data seems to indicate that the reduction of RBC Dcyy and hence the continuous multi-body collisions may be linked to the decrease in the apparent viscosity described in previous studies (Fahraeus and Lindqvist 1931, Reinke et al. 1987, Pries et al. 1992).
The RBC Dcyy is also influenced by the radial position and corresponding shear rate. Generally, our results for moderate and higher Hcts indicate that the Dyyc is the greatest at radial positions between 0.4 R and 0.8 R, whereas at locations adjacent to the wall (0.8 R–1 R) and around the middle of the capillary (0 R–0.2 R), the paths of the tracer RBCs tend to exhibit lower erratic displacements normal to the direction of the flow. As already noted, the plasma layer seems to enhance continuous erratic radial displacements, which leads to an increase in multi-body interactions. In contrast, the paths of the RBCs traveling in apparent contact with the wall had the lowest radial dispersion. Visual observations as well as measurements on the radial displacement showed that even interactions with neighboring RBCs having higher velocities did not cause significant increases in the radial displacement of the RBCs rolling on the wall surface of the microchannel. The reason for this phenomenon is not completely understood, but the electrostatic attractive force and the lubrication force between the RBC and the wall may play an important role in its flow behavior. Generally, our results reinforce early observations by Goldsmith and his colleagues (1979, 1986), who reported that the radial displacements are greatest at radial distances between 0.5 R and 0.8 R.
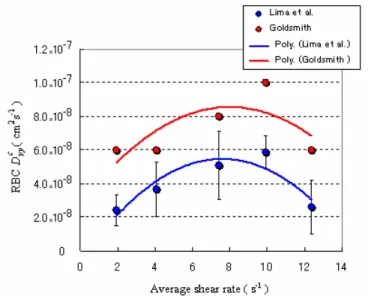
Comparison to previous studies
Figure 7. RBC Dyyc as a function of the average shear rate (
γ
). Our results were obtained with 35% Hct in a 100µm capillary, whereas the results of Goldsmith and Marlow (1979) were obtained with 40% Hct. The measured values are expressed as the means ± standard deviation according to a t-test analysis at a 90% confidence interval.
Figure 8. Comparison between the present results (35% Hct, 100 µm capillary) and data obtained by Goldsmith (1971) (39% Hct, 76.5 µm capillary).
As previously mentioned, Goldsmith and his coworkers used ghost cells as models of erythrocytes to measure the RBC motions at concentrated suspensions. According to Nash and Meiselman (1983), the preparation procedure of the ghost cells as well as the removal of the hemoglobin (Hb) may contribute to the changes in the membrane mechanical properties of the ghost RBCs. According to their findings, ghost cells recovered more quickly to their original cell shape compared to normal RBCs. The ability of the ghost cells to deform more easily than normal cells may affect the RBC dynamic behavior in the shear flow. This phenomenon may be responsible for the higher RBC radial dispersion values obtained by Goldsmith his coworkers.
for 35% Hct with three different image planes : (1) Dyy in the centre plane =Dyyc = D50yy = 4.18×10 -8
cm2/s; (2) Dyy in the image plane 35 m from the bottom wall = D35yy = 4.98×10⁻⁸cm2/s and (3) Dyy
in the image plane 20 m from the wall = Dyy20 = 6.18×10⁻⁸cm2/s). Thus, the out-of-focus RBCs may also have contributed to the higher radial dispersion values (Lima 2007, Lima et al. 2008a).
Future directions
In our confocal system we used a confocal scanning unit (CSU22, Yokogawa, Japan) with a temporal resolution of up to 1000 frames/s (exposure time of 0.99 ms). However for in vitro blood with Hcts bigger than 9%, due to the light absorbed and scattered by RBCs, we need high exposure time in order to obtain adequate quality images to be processed by the micro-PTV technique (Lima et al. 2006, 2007). In the present study we used high exposure time (9.4 ms) which corresponds to low temporal resolution (100 frames/s) and consequently to Re about one order of magnitude lower when compared with in vivo observations (Caro et al. 1978, Fung 1997). We expect to analyze the effect of the Re on RBC radial dispersion in the near future.
Here, we compare our results with former numerical studies on diffusivity of particles in a suspension. The shear-induced diffusion of rigid spheres in a concentrated suspension has been investigated numerically by Drazer et al. (2002) and Foss and Brady (2000). These studies demonstrated that nonzero components of the diffusion tensor are strongly dependent on the volume fraction of spheres. In the rather dilute regime, they showed that the diffusivity is about proportional to the shear rate and the concentration of spheres. These tendencies qualitatively agree with our observation shown in Figures 6 and 7. In Figure 6, we showed that the Dyy increases about linearly with Hct (volume fraction of RBCs) in the low Hct regime. Moreover, in figure 7, the Dyy increases with the radial position, where shear rate also increases with the radial position (Though, in the cell free layer, the Dyy decreases due to the low local Hct). To our knowledge, the shear-induced diffusion of RBCs has not been clarified numerically. Since Lac et al. (2007) showed that the shear-induced displacement of interacting spherical capsules is strongly dependent on the capillary number, the Dyy of RBCs may also be dependent on it. We need more theoretical and numerical data for further comparison.
Fortunately there has been substantial progress in modeling the rheological properties of blood (Chakraborty 2005, Das and Chakraborty 2006, Yamaguchi et al. 2006, Chakraborty 2007). In the future, therefore, our experimental results will be compared with the most recent theoretical findings in this field. It is expected that by combining both results with the help of sophisticated computational methods, a better understanding to the overall properties of blood flow, from cellular motion to the resulting rheological properties of whole blood will be provided.
5. Conclusions
capillary (0 R–0.2 R). Although evidence exists that the latter phenomenon is mainly due to the low shear rate and high RBC concentrations in the center of the microtube, the former phenomenon is still not completely understood. Our results suggest that at regions near the wall, the motions of RBCs are dominated not only by hydrodynamic forces but also by other forces such as electrostatic attractive forces and lubrication forces that develop at the wall boundary layer.
Our findings also demonstrated that Dyy tends to decrease with the diameter. This phenomenon is believed to be caused by Hct reduction with the diameter (Fahraeus effect) and also to the geometric constraints that naturally limit the amplitude of the RBC’s radial displacements. Hence, this finding seems to indicate that the reduction of RBC radial dispersion and the continuous multi-body collisions may be linked to the decrease in apparent viscosity with decreasing diameter (Fahraeus–Lindqvist effect).
ACKNOWLEDGEMENTS
This study was supported in part by the following grants: International Doctoral Program in Engineering from the Ministry of Education, Culture, Sports, Science and Technology of Japan (MEXT), “Revolutionary Simulation Software (RSS21)” next-generation IT program of MEXT; Grants-in-Aid for Scientific Research from MEXT and JSPS Scientific Research in Priority Areas (768) “Biomechanics at Micro- and Nanoscale Levels,” Scientific Research (A) No.16200031 “Mechanism of the formation, destruction, and movement of thrombi responsible for ischemia of vital organs”.
REFERENCES
Abkarian M., Magalie Faivre M., Stone H., 2006. High-speed microfluidic differential manometer for cellular-scale hydrodynamics. PNAS 103, 538-542.
Abramoff, M., Magelhaes, P., Ram, S., 2004. Image Processing with Image J, Biophotonics International 11, 36-42.
Bitbol, M., 1986. Red blood cell orientation in orbit C = 0. Biophysical Journal 49,1055-1068. Burton, A., 1966. Physiology and Biophysics of the circulation, Year Book Medical Publishers. Caro, C., Pedley, T., Schroter, R., Seed W., 1978. The mechanics of the circulation, Oxford University
Press.
Chakraborty, S., 2005. Dynamics of capillary flow of blood into a microfluidic channel, Lab Chip 5, 421-430.
Chakraborty, S., 2007. Electroosmotically driven capillary transport of typical non-Newtonian bio-fluids in rectangular microchannels, Analytica Chimica Acta 605, 175-184.
Chien, S., 1970. Shear dependence of effective cell volume as a determinant of blood viscosity. Science 168, 977-979.
Chien, S., Usami, S., Skalak, R., 1984. Blood flow in small tubes In: Handbook of Physiology – The cardiovascular system IV, 217-249.
Cokelet, G., Goldsmith H., 1990. Decreased hydrodynamic resistance in the two-phase flow of blood through small vertical tubes at low flow rates. Circulation Research 68, 1-17.
Das, S., Chakraborty, S., 2006. Analytical solutions for velocity, temperature and concentration distribution in electroosmotic microchannel flows of a non-Newtonian bio-fluid, Analytica Chimica Acta 559, 15-24.
Drazer, G., Koplik, J., Khusid, B. and Acrivos, A., 2002. Deterministic and stochastic behaviour of non-Brownian spheres in sheared suspension, J. Fluid Mech. 460, 307-335.
Fischer T., Stohr-Lissen M, Schmid-Schonbein, H., 1978. The red cell as a fluid droplet: tank tread-like motion of the human erythrocyte membrane in shear flow. Science 202, 894-896.
Foss, D. and Brady, J. F., 2000. Structure, diffusion and rheology of Brownian suspensions by Stokesian Dynamics simulation, J. Fluid Mech. 407, 167-200.
Fung ,Y., 1993. Biomechanics – Mechanical properties of living tissues. second edition, Springer-Verlag, New York.
Fung ,Y., 1997. Biomechanics – Circulation., second edition, Springer-Verlag, New York.
Gaehtgens P., 1980. Flow of blood through narrow capillaries; rheological mechanisms determining capillary hematocrit and apparent viscosity, Biorheology 17, 183-189.
Goldsmith H., 1971. Deformation of human red cells in tube flow, Biorheology 7, 235-242.
Goldsmith H., 1971. Red cell motions and wall interactions in tube flow, Federation Proceedings 30, 1578-1588.
Goldsmith H., Karino T., 1977. Microscopic considerations: the motions of individual particles. Annals New York Academy of Sciences 283, 241-255.
Goldsmith, H., Marlow, J., 1979. Flow behavior of erythrocytes. II. Particles motions in concentrated suspensions of ghost cells, Journal of Colloid and Interface Science 71, 383-407.
Goldsmith, H., Turitto, V., 1986. Rheological aspects of thrombosis and haemostasis: basic principles and applications. ICTH-Report-Subcommittee on Rheology of the International Committee on Thrombosis and Haemostasis. Thromb Haemost. 55, 415–435.
Ishikawa, T. and Pedley, T., 2007. Diffusion of swimming model micro-organisms in a semi-dilute suspensions. Journal of Fluid Mechanics 588, 437-462.
Kinoshita, H., Kaneda, S., Fujii, T., Oshima, M., 2007. Three-dimensional measurement and visualization of internal flow of a moving droplet using confocal micro-PIV. Lab Chip 7, 338-346. Lac, E., Morel, A. & Barthes-Biesel, D., 2007. Hydrodynamic interaction between two identical
capsules in simple shear flow, J. Fluid Mech. 573, 149-169.
Lima, R., (2007) Analysis of the blood flow behavior through microchannels by a confocal micro-PIV/PTV system. PhD Thesis, Tohoku University, Japan.
Lima, R., Ishikawa T., Imai, Y., Takeda, M., Wada, S., Yamaguchi, T., 2008a. Microhaemodynamic measurements in concentrated suspensions of erythrocytes using a confocal micro-PTV system (submitted).
Lima, R., Wada, S., Takeda, M., Tsubota, K., Yamaguchi, T., 2007. In vitro confocal micro-PIV measurements of blood flow in a square microchannel: the effect of the haematocrit on instantaneous velocity profiles. Journal of Biomechanics, 40, 2752-2757.
Lima, R., Wada, S., Tanaka, S., Takeda, M., Ishikawa, T., Tsubota, K., Imai, Y., Yamaguchi, T., 2008b. In vitro blood flow in a rectangular PDMS microchannel: experimental observations using a confocal micro-PIV system. Biomedical Microdevices, 10, 153-167.
Lima, R., Wada, S., Tsubota, K., Yamaguchi, T., 2006. Confocal micro-PIV measurements of three dimensional profiles of cell suspension flow in a square microchannel. Measurement Science and Technology 17, 797-808.
Lominadze D., Mchedlishvili G., 1999. Red blood cell behavior at low flow rate in microvessels. Microvascular Research 58, 187-189.
Mchedlishvili, G., Maeda, N., 2001. Blood flow structure related to red cell flow: a determination of blood fluidity in narrow microvessels. Japanese Journal of Physiology 51, 19-30.
Meijering E., Smal I., Danuser G., 2006. Tracking in Molecular Bioimaging, IEEE Signal Processing Magazine, 23, 46-53.
Miyazaki, H. and Yamaguchi, T., 2003. Formation and destruction of primary thrombi under the influence of blood flow and von willebrand factor analysed by a D. E. M. Biorheology 40, 265-272.
Munn, L., Melder R., Jain, R., 1996. Role of erythrocytes in leukocyte-endothelial interactions: mathematical model and experimental validation. Biophysical Journal 71, 466-478.
Nash, G., Meiselman, H., 1983. Red cell and ghost viscoelasticity. Effects of hemoglobin concentration and in vivo aging. Biophysical Journal 43, 63-73.
Park J, Choi C, and Kihm K, 2004. Optically sliced micro-PIV using confocal laser scanning microscopy (CLSM). Experiments in Fluids 37, 105-119.
Pries, A., Secomb, T., 2003. Rheology of the microcirculation. Clinical Hemorheology and Microcirculation 29, 143-148.
Reinke, W., Gaehtgens, W., Johnson P., 1987. Blood viscosity in small tubes: effect of shear rate, aggregation, and sedimentation. Am. J. Physiol. 253, H540-H547.
Schmid-Schonbein, H., Wells, R., 1969. Fluid drop-like transition of erythrocytes under shear. Science 165, 288-291.
Shiga, T., Maeda N., Kon K., 1990. Erythrocyte rheology. Crit. Rev. Oncol. Hematol. 10, 9-48. Suzuki, Y., Tateishi, N., Soutani M. and N., Maeda, 1996. Deformation of erythrocytes in
microvessels and glass capillaries: effects of erythrocyte deformability. Microcirculation 3, 49-57. Tanaani T, Otsuki S, Tomosada N, Kosugi Y, Shimizu M. Ishida H., 2002. High-speed 1-frame/ms
scanning confocal microscope with a microlens and Nipkow disks. Applied Optics 41, 4704-4708. Wootton, D., Ku D., 1999. Fluid mechanics of vascular systems, diseases, and thrombosis. Annual
Review of Biomedical Engineering 1, 299-329.


![Metabolic flux analysis of an underdetermined network of CHO cells [abstract]](data:image/gif;base64,R0lGODlhAQABAIAAAP///wAAACH5BAEAAAAALAAAAAABAAEAAAICRAEAOw==)