Red blood cells radial dispersion in blood
fl
owing through
microchannels: The role of temperature
Diana Pinho
a,b, Raquel O. Rodrigues
a,c, Vera Faustino
d, Tomoko Yaginuma
a, José Exposto
a,
Rui Lima
a,b,e,naPolytechnic Institute of Bragança, ESTiG/IPB, C. Sta. Apolónia, 5301-857 Bragança, Portugal
bCEFT, Faculdade de Engenharia da Universidade do Porto (FEUP), R. Dr. Roberto Frias, 4200-465 Porto, Portugal cLCM
–Laboratory of Catalysis and Materials–Associate Laboratory LSRE/LCM, Faculdade de Engenharia, da Universidade do Porto (FEUP),
R. Dr. Roberto Frias, 4200-465 Porto, Portugal
dUnidade de Investigação em Microssistemas Eletromecânicos (MEMS), Campus de Azurém, 4800-058 Guimarães, Portugal eMEtRiCS, DME, School of Engineering, University of Minho, Campus de Azurém, 4800-058 Guimarães, Portugal
a r t i c l e
i n f o
Article history:
Accepted 7 November 2015
Keywords:
Radial dispersion Bloodflow Temperature Biomicrofluidics Microcirculation Red blood cells Confocal micro-PTV
a b s t r a c t
The behavior of suspensions of individual blood cells, such as red blood cells (RBCs),flowing through microvessels and microfluidic systems depend strongly on the hematocrit (Hct), microvessel topology and cell properties. Although it is well known that blood rheological properties are temperature dependent, to the best of our knowledge no work has studied the role of the temperature on the RBCs dispersion. A powerful way to investigate this latter effect is through a high-speed video microscopy system, which provides detailedflow measurements of each individual RBC. Hence, the effect of tem-perature on the RBCs dispersionflowing through a 100
μ
m glass capillary was examined by means of a confocal micro-PTV system. Hundreds of labeled RBCs were tracked at moderate Hct (12%) and at four different temperatures, i.e., 25°C, 32°C, 37°C and 42°C. The results yielded an enhancement of the RBCs diffusion as the temperature increases. Hence, ourfindings show that RBCs radial dispersion is tem-perature dependent and as a result the temtem-perature should not be ignored in future bloodflow studies. We believe that thisfinding is important for a better understanding of blood mass transport mechanisms under both physiological and pathological conditions.&2015 Elsevier Ltd. All rights reserved.
1. Introduction
Human blood is a complex physiological fluid that consists of
deformable blood cells suspended in plasma containing mostly water. It is well known that red blood cells (RBCs) are the most abundant type of cells in whole blood, with a concentration around 45% in human adults. Due the high RBC concentration, it is believed that rheological properties of whole blood are mainly determined by the presence of the RBCs within theflow. Hence, bloodflow behavior in microcirculation has long been a hot topic of interest by the biome-dical research community with an extensive history of experimental investigations (Chien et al., 1984;Goldsmith and Turitto, 1986;Lima et al., 2012;Garcia et al., 2012;Wong et al., 2012;Pinho et al., 2013b;
Yaginuma et al., 2013;Faustino et al., 2014;Rodrigues et al., 2015).
In the last century, experimental bloodflow has been measured
by several measurements techniques such as: double-slit
photo-metric (Nash and Meiselman, 1983), laser-Doppler anemometer
(Cochrane et al., 1981; Uijttewaal et al., 1994). These techniques used direct photometric information obtained without image information. However, most successful techniques were the
video-based methods (Goldsmith, 1971; Goldsmith and Marlow, 1979;
Parthasarathi et al., 1999), where video-microscopy images were recorded in order to be analyzed off-line by using image proces-sing techniques. Although the past results have been encouraging, detailed studies on bloodflow behavior at a microscopic level have been limited by several factors such as poor spatial resolution,
difficulty to obtain accurate measurements at such small scales,
optical errors arisen from walls, high concentration of blood cells, and difficulty in visualization of the results due to insufficient computing power and absence of reliable image analysis techni-ques. However, recently due to advances in computers, optics, and digital image processing techniques, it has become possible to combine a particle image velocimetry (PIV) system with a spinning Contents lists available atScienceDirect
journal homepage:www.elsevier.com/locate/jbiomech www.JBiomech.com
Journal of Biomechanics
http://dx.doi.org/10.1016/j.jbiomech.2015.11.037 0021-9290/&2015 Elsevier Ltd. All rights reserved.
n
Corresponding author at: Mechanical Eng. Dep., School of Engineering, Uni-versity of Minho, Campus de Azurém, 4800-058 Guimarães, Portugal. Tel.:þ351 253510233.
quantitative measurements inflowing blood at concentrated
sus-pensions up to 35% Hct. By using this confocal systemLima et al.
(2008a) have determined the RBCs radial dispersion coefficient (Dyy) in the middle plane of 50
μ
m and 100μ
m glass capillaries atlow Reynolds number (Lima et al., 2008a). The results
demon-strated that RBCsDyytends to increase with the Hct and decrease
with the diameter of the capillary. Similar results were also found by performing measurements in circular polydimethysiloxane
(PDMS) microchannels (Lima et al., 2009b). More recently,
Saa-datmand et al. (2011)have studied the dispersion offluid particles in a concentrated suspension of healthy RBCs by using confocal
micro-PTV system. Results from this study yielded significant
enhancement of the particle diffusion due to a micron-scalefl
ow-field generated by the motions of the neighborhood RBCs. While
the effect of Hct on the dispersion of RBCs andfluid particles has been widely investigated, according to our knowledge studies on the effect of temperature on the RBCs dispersion have never been performed.
A recent study performed byQuinn et al. (2011)has suggested
that individual RBCs flowing in narrow microchannels become
highly sensitive to changes of temperature. Thus, the effect of temperature on the RBCs dispersion in a concentrated suspension of healthy RBCs needs to be clarified. In this study, labeled RBCs in
concentrated suspensions of healthy RBCs flowing in a glass
capillary was investigated for four different temperatures, i.e., 25°C, 32°C, 37°C and 42°C (measured temperature 71°C). By using a confocal micro-PTV system, we were able to track RBC
dye, chloromethylbenzamido (CM-Dil, C-7000; Molecular Probes, Eugene, OR, USA). More details on the labeling procedure can be found elsewhere (Lima et al., 2009a).
2.1.2. Microchannels, experimental setup and temperature control
In this study, 100μm borosilicate glass microchannels fabricated by Vitrocom (Mountain Lakes, NJ, USA) were used. The capillary was mounted on a slide glass with a thickness of 80720μm and was immersed in glycerol to minimize the
refraction from the walls.
In order to trace the RBCs, we used the confocal micro-PTV system which consists of an inverted microscope (IX71; Olympus, Japan) combined with a con-focal scanning unit (CSU22; Yokogawa, Japan), a diode-pumped solid-state (DPSS) laser (Laser Quantum, UK) and a high-speed camera (Phantom v7.1; Vision Research, USA). The glass capillaries were placed on the stage of an inverted microscope, and a constant pressure-drivenflow was established (Re0.007) with a syringe pump (KD Scientific, Holliston, MA, USA). By using a thermal plate con-troller (Tokai Hit, Shizuoka, Japan) and a box made by expanded polystyrene, the temperature surrounding the capillary was maintained at 2571°C, 3271°C, 3771°C and 4271°C. The experimental temperatures were selected considering several physiological temperatures, such as 37°C–the normal body temperature in humans, 42°C–a severe fever temperature and 32°C–a hypothermia body temperature. In addition, the room temperature (25°C), which was often used in many past experimental bloodflow studies, was also considered. A schematic view of the experimental set-up can be seen inFig. 1.
2.1.3. Tracking of labeled RBCs
The images were taken with a 40objective lens with a numerical aperture (NA) equal to 0.9. The confocal images were captured in the middle of the capillary with a resolution of 640480 pixels at a rate of 100 frames/s and an exposure time of 9.4 ms. A manual tracking plug-in (MTrackJ) (Meijering et al., 2012;Pinho et al., 2013a) of the image handling software ImageJ (NIH, USA) (Abramoff et al., 2004) was used to track the labeled RBCs. Using this plug-in, the bright centroid of each
selected RBC was automatically computed through successive images. The centroid
xandycoordinate data for the individual positions of each RBC were then pro-cessed by a custom made ImageJ plug-in (DispersionCoefficient) to calculate radial dispersion coefficient, using immediate results obtained by the previous plug-in. Fig. 2shows a typical view of labeled RBC trajectories tracked by the plug-in MTrackJ.
2.1.4. Rheological measurements
The viscosities of the workingfluid (12% Hct) were measured at 25°C, 32°C, 37°C and 42°C by means of a stress control rheometer (Malvern/Bohlin CVO) with a cone-plate geometry (60 mm in diameter, 1°cone angle and 0.03 mm gap). The viscosity curves were obtained in a range of shears rate from 1 to 3000 s 1. At least three replicas with fresh samples in each measurement were made in order to corroborate the reproducibility.
2.2. RBC radial dispersion coefficient
In the present study, the radial dispersion coefficient (Dyy) of individual RBCs measured at different temperature was calculated by using the ImageJ plug-in “DispersionCoefficient”. TheDyycalculated in this plug-in is given by
DyyðtÞ ¼1
N
XN
i¼1
Ri;yðtÞ Ri;yð0Þ 2 D E
2t ; ð1Þ
where Ri;yðtÞ Ri;yð0Þ 2 D E
is the mean square radial displacement of the RBCs in the time durationtandNis the number of tracked RBCs. For the current study, more than 200 RBCs were measured.
3. Results and discussion
3.1. RBCsflowing at various regions in the 100
μ
m capillaryFig. 3shows the labeled RBCsflowing at various regions in the
center plane of 100
μ
m capillary with 12% Hct (Re 0.007) andtemperature of 3771°C. The labeled RBCs appeared as bright
circular shapes among the other greyish non-labeled RBCs. The regions were divided into three sections (0–0.4R, 0.4R–0.8R and 0.8R–1R, whereRis the radius of the capillary) and for each region RBC trajectories were measured.
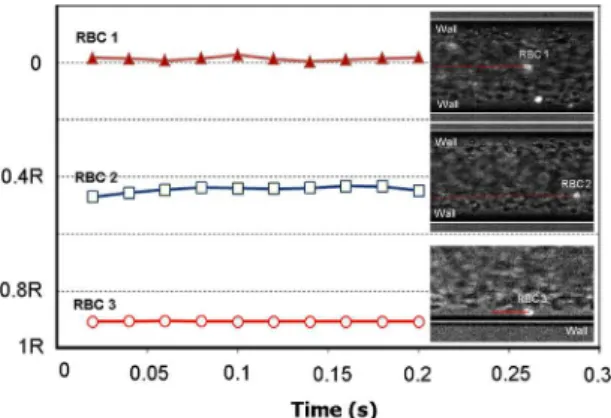
3.2. Motion of individual RBCs at different radial positions
By using a confocal micro-PTV system, trajectories of individual
RBCs were measured at Re0.007. Three representative examples
for a temperature of 37°C are presented below.Fig. 4illustrates the instantaneous transversal displacement of three RBCs (RBC 1, RBC 2 and RBC 3) at different radial positions for a temperature of 37°C. The transversal displacement, Ry(t), is theyposition normal to the direction of theflow in a time interval,t(s).
These qualitative results show that for the case of a RBC rolling on the wall (RBC 1) the transversal oscillation is close to zero,
whereas RBCsflowing within a crowded environment (RBC 2 and
RBC 3) experience much greater fluctuation in their trajectories.
Thus, the degree of the dispersion is dependent on the RBC radial position.
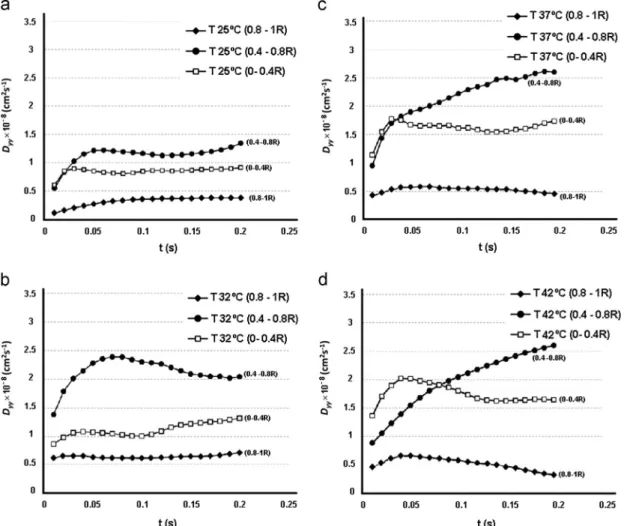
3.3. Radial dispersion coefficient by radial positions
Next, we have examined theDyytendency for each radial region
(cf.Fig. 5). For all the temperature cases, the highestDyyoccurred in
the region 0.4R–0.8R, which can be considered as the edge of the cell-rich center core. In this region, the motion of theflowing RBCs are more chaotic than the other regions, especially for the higher tem-peratures, 37°C and 42°C, since the value of Dyykeeps increasing
with the time. We believe that the undulating RBC trajectories gen-erated at the edge of the cell core region promote a large number of multibody collisions, which eventually lead to continuousflow dis-turbances at a microscopic level. Moreover, most RBCsflowing within
the cell-free layer (CFL) tend to flow towards the center of the
microchannel; however this tendency is inverted by the RBC core region and consequently enhances interactions between neighboring
RBCs. This highDyymay play an important role in the blood mass
transport in microcirculation as several cells and proteins are trans-ported into tissues. In contrast, in the region 0.8R–1R, the motion of the RBCs were very restricted. The region contains a CFL so that the number of the cells in this area was extremely low. Generally, it was observed that almost all the RBCs wereflowing adjacent to the wall with a rolling motion. Moreover, when a RBC was rolling on the surface, most interactions did not promote a significant increase in the
Dyy, indicating that the lubrication force between the RBC and the wall
is greater than the hemodynamic force caused by a neighboring RBC collision. Last, but not least in the region 0R–0.4Rhave shown that the RBCDyyis always in between the cases described above. Although at
Fig. 2.Labeled RBC trajectories for 12% Hct. The non-labeled RBCs are observed as
dark-gray rings, whereas the labeled RBCs are observed as bright dots.
Fig. 3.Coordinate system in the middle plane of a 100-μm glass capillary. The
image contains both halogen and laser light, which enables visualization of both labeled (bright dots) and non-labeled (dark-gray rings) RBCs.
Fig. 4. Instantaneous transversal displacement of three representative RBCs (RBC 1,
this particular region there was the highest local concentration of RBC theDyywas not the highest. We believe that the main reason for this
moderate Dyy is because high concentrations of cells limit the
amplitude of the RBC's radial motions. This latter result is consistent
with other previous research performed byGoldsmith and Marlow
(1979),Goldsmith and Turitto (1986)andLima et al. (2008a).
3.4. Radial dispersion coefficient at different temperatures
The results of dispersion coefficient of tracked RBCs in a
100
μ
m capillary at different temperatures are shown inFig. 6. Wecould see a tendency that theDyyreached constant values around
t¼0.05 s for all the temperature cases except for the tested tem-perature of 42°C, where theDyykept a slight increase even after
leveled around t¼0.05 s. Despite this difference, theDyy of the
temperatures 37°C and 42°C are quite similar and the highest
among the others. As the temperature decreases, theDyytends to
decrease, reaching a minimum value of about 910 9cm2/s for a
temperature of 25°C. The results fromFig. 6clearly show a
sig-nificant difference betweenDyyat the highest temperatures (37°C
and 42°C) andDyycalculated at the lowest temperature, i.e., 25°C.
It is widely accepted by the scientific community that the collision frequency of particles (in this particular study RBCs) tends to
decrease as temperature reduces (Jia et al., 2007; Nguyen and
Wereley, 2006;Thurston and Henderson, 2007). In contrast, when
the temperature decreases the plasma viscosity increases (Lim et
al., 2010). These well-known phenomena might be the main
rea-sons for the observedDyydecrease by lowering the temperature.
Hence, thesefindings suggest that the temperature should not be
ignored in future RBCDyystudies.
Fig. 7 presents the RBCs radial dispersion coefficient as a
function of the temperature where theDyy represents the
aver-aged value of the last three time intervals (t¼0.18–0.2 s). The
results from Fig. 7 show clearly that the dispersion coefficient
increases with the temperature but at 37°C it tends to level off.
Fig. 5.RBC radial dispersion coefficient (Dyy) at different radial positions: 0R–0.4R, 0.4R–0.8R, 0.8R–1Rand for different temperatures (a) 25°C; (b) 32°C; (c) 37°C and
(d) 42°C.
Fig. 6.RBC dispersion coefficient at the middle plane of a 100-μm glass capillary for
Blood rheology has been reported to be changed at various phy-siopathological conditions, such as alterations of hematocrit, RBC deformability, RBC aggregation and temperature. Regarding the tem-perature, several experimental works have shown remarkable results.
Artmann et al. (1998), by using a micropipette technique, have demonstrated that normal RBCs and ghost cells (RBCs without hemoglobin) behave differently by increasing the temperature. When normal RBCs were aspirated at 22°C into micropipettes, the RBCs tend to block the pipettes, however when the temperature was raised up to 36.4°C the RBCs start to pass through the micropipettes. For the case
of the ghost cells, the transition temperature was 28.3°C. These
findings clearly demonstrate a temperature dependency associated to
the RBCs deformability changes. In addition, these findings were
attributed to changes of the hemoglobin (major RBC intracellular
protein) and spectrin (major RBC membrane protein). However,Mills
et al. (2007)by means of optical tweezers have shown that healthy
RBC membrane stiffness at 37°C and 41°C was similar to healthy
RBCs at room temperature. Hence, this work makes us believe that the temperature promotes almost no effect on the RBC membrane stiff-ness. Recently, experiments performed in microfluidic constriction channels have shown that RBC deformability increases from room temperature to 37°C (Huang et al., 2010;Quinn et al., 2011). These results were mainly attributed to the reduction of theflow resistance due to an increase in temperature and a consequent reduction of the effective viscosity of the medium (combination of surrounding externalfluid, RBC internalfluid and RBC membrane). Our results are
in a good agreement with the experimental findings obtained in
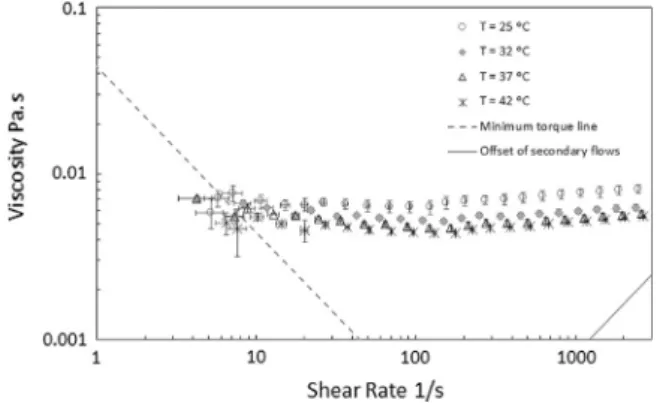
microfluidic constriction channels and reinforces that there is a strong temperature dependence on the RBC dynamics from room tempera-ture to 37°C. This temperature dependence was further investigated to evaluate the role of the workingfluid in influencing the RBCflow
dynamics. Hence, viscosity measurements of our workingfluid were
performed by means of a stress control rheometer (Malvern/Bohlin CVO). The results have shown that for the temperatures from room
temperature (25°C) to 37°C the viscosity of our working fluid
exhibited a strong temperature dependence, as seen in Fig. 8. At
temperatures up to 37°C the fluid viscosity decreased as the tem-perature increased. However, at 42°C the viscosity is similar to the
one obtained at 37°C. This additional experiment reinforces our
confocal results showing a strong temperature dependence of the dispersion coefficient at temperatures up to 37°C. Moreover,Lim et al. (2010)by using a pressure scanning capillary viscometer, have shown that both plasma and whole blood viscosity also decreased as tem-perature increase (from 4°C to 37°C). Overall, our results complement
previous research findings and suggest that the externalfluid sur-rounding the RBCs plays a major role in reducing the viscosity of the medium and as a result increasing the RBC dispersion coefficient.
3.5. Comparison with other studies
Radial dispersion offlowing RBCs in a capillary is known to be
affected by other factors such as the diameter of the capillary and hematocrit of the working fluids (Lima et al., 2008a). Lima et al. (2008a)have examined various hematocrits with 50mm and 100mm
glass capillaries. The results showed the higherDyywas obtained in
the higher Hcts and larger diameter. Saadatmand et al. (2011)also
investigated the dispersion of both fluorescent tracer particles and RBCs with several Hcts in the 50mm glass capillary tube. In this latter
study they have observed that an increase of Hct has promoted an increase of the tracer particlesDyy. It was also revealed that the
dis-persion of tracer particles was larger than the observed for RBCs
flowing influid with 10% Hct. It should be mentioned, that all past experiments were undertaken with a surrounding temperature of about 36–37°C andReat 0.001–0.008. Note thatSaadatmand et al. (2011)have used a capillary which the diameter was half of the one used in the current study. Thefirst observation from this comparison is that ourDyyvalues are in between the results ofLima et al. (2008a)
and Saadatmand et al. (2011). The values obtained by Lima et al. (2008a)were higher than the present results. This small discrepancy might have been due to their use of a higher Hct (15%). In fact the work ofLima et al. (2008a)has showed thatDyytends to increase with
the Hct. Additionally, it is possible to notice an appreciable difference
between our present results and the values obtained bySaadatmand
et al. (2011). We believe that the main reason for the lower values
obtained by Saadatmand et al. (2011) is mainly due to the lower
diameter used in their study. In fact, Lima et al. (2008a) have
demonstrated that Dyy tends to decrease with the diameter. This
phenomenon is believed to be caused by Hct reduction with the diameter (Fahraeus effect) and also due to the geometric constraints that limits the transverse motion of the RBCs.
4. Conclusions
In this work, we have presented experimental measurements of
the effect of temperature on the RBCs dispersionflowing through a
100
μ
m glass capillary. Labeled RBCs were tracked by means of aconfocal micro-PTV system at four different temperatures, i.e., 25°C, 32°C, 37°C and 42°C (measured temperature 71°C). The results illustrated an enhancement of the cells diffusion as the temperature increases.
Rheological studies, have shown that as the temperature increases, the whole blood and plasma viscosity tends to decrease and
Fig. 7.RBC dispersion coefficient as a function of the temperature whereDyy
represents the averaged value of the last three time intervals (t¼0.18–0.2 s). The measured values are expressed as the means7standard deviation according to at -test analysis at a 95% confidence interval.
Fig. 8.Steady shear viscosity curves for the workingfluid at four different
the main cause for the low cell dispersion values obtained at this depleted region. Ourfindings show clearly a temperature dependence on the RBCs diffusion and as a result the temperature should not be ignored in futurein vitrobloodflow studies. Moreover, thesefindings provide novel insights regarding the blood transport phenomena in both microchannels and microvessels.
5. Conflict of interest statement
The authors have no conflict of interest to report.
Acknowledgments
The authors acknowledge the financial support provided by
PTDC/SAU-ENB/116929/2010 and EXPL/EMS-SIS/2215/2013 from FCT (Science and Technology Foundation), COMPETE, QREN and European Union (FEDER). R. O. Rodrigues, D. Pinho and V. Faustino acknowledge respectively, the PhD scholarships SFRH/BD/97658/ 2013, SFRH/BD/89077/2012 and SFRH/BD/99696/2014 Granted by FCT. The authors are also very grateful to Professor Takuji Ishikawa and Professor Takami Yamaguchi (Tohoku University) for sup-porting this research work.
References
Abramoff, M.D., Magalhães, P.J., Ram, S.J., 2004. Image processing with ImageJ. Biophotonics Int. 11, 36–42.
Artmann, G.M., Kelemen, C., Porst, D., Büldt, G., Chien, S., 1998. Temperature transitions of protein properties in human red blood cells. Biophys. J. 75, 3179–3183.
Chien, S., Usami, S., Skalak, R., 1984. Bloodflow in small tubes. In: Geiger, R.R. (Ed.), Handbook of Physiology–The Cardiovascular System IV. American Physiolo-gical Association Bethesda, MD, pp. 217–249.
Cochrane, T., Earnshaw, J.C., Love, A.H., 1981. Laser Doppler measurement of blood velocity in microvessels. Med. Biol. Eng. Comput. 19, 589–596.
Faustino, V., Pinho, D., Yaginuma, T., Calhelha, R., Ferreira, I.F.R., Lima, R., 2014. Extensionalflow-based microfluidic device: deformability assessment of red blood cells in contact with tumor cells. BioChip J. 8, 42–47.
Garcia, V., Dias, R., Lima, R., 2012. In vitro bloodflow behaviour in microchannels with simple and complex geometries. In: Naik, G.R. (Ed.), Applied Biological Engineering–Principles and Practice. InTech, pp. 393–416.
Goldsmith, H.L., 1971. Red cell motions and wall interactions in tubeflow. Fed. Proc. 30, 1578–1590.
Goldsmith, H.L., Marlow, J.C., 1979. Flow behavior of erythrocytes. II. Particle motions in concentrated suspensions of ghost cells. J. Colloid Interface Sci. 71, 383–407.
of hematocrit and geometry. J. Biomech. 41, 2188–2196.
Lima, R., Ishikawa, T., Imai, Y., Takeda, M., Wada, S., Yamaguchi, T., 2009a. Mea-surement of individual red blood cell motions under high hematocrit condi-tions using a confocal micro-PTV system. Ann. Biomed. Eng. 37, 1546–1559. Lima, R., Ishikawa, T., Imai, Y., Yamaguchi, T., 2012. Bloodflow behavior in
micro-channels: past, current and future trends. In: Dias, Ricardo, Martins, Antonio A., Lima, Rui, Mata, T.M. (Eds.), In Single and two-Phase Flows on Chemical and Biomedical Engineering. Bentham Science, pp. 513–547.
Lima, R., Oliveira, M.S., Ishikawa, T., Kaji, H., Tanaka, S., Nishizawa, M., Yamaguchi, T., 2009b. Axisymmetric polydimethysiloxane microchannels for in vitro hemo-dynamic studies. Biofabrication 1, 035005.
Lima, R., Wada, S., Takeda, M., Tsubota, K., Yamaguchi, T., 2007. In vitro confocal micro-PIV measurements of bloodflow in a square microchannel: the effect of the haematocrit on instantaneous velocity profiles. J. Biomech. 40, 2752–2757. Lima, R., Wada, S., Tanaka, S., Takeda, M., Ishikawa, T., Tsubota, K., Imai, Y., Yama-guchi, T., 2008b. In vitro blood flow in a rectangular PDMS microchannel: experimental observations using a confocal micro-PIV system. Biomed. Microdevices 10, 153–167.
Lima, R., Wada, S., Tsubota, K., Yamaguchi, T., 2006. Confocal micro-PIV measure-ments of three-dimensional profiles of cell suspension flow in a square microchannel. Meas. Sci. Technol. 17, 797.
Meijering, E., Dzyubachyk, O., Smal, I., 2012. Methods for cell and particle tracking. Methods Enzymol. 504, 183–200.
Mills, J.P., Diez-Silva, M., Quinn, D.J., Dao, M., Lang, M.J., Tan, K.S.W., Lim, C.T., Milon, G., David, P.H., Mercereau-Puijalon, O., Bonnefoy, S., Suresh, S., 2007. Effect of plasmodial RESA protein on deformability of human red blood cells harboring
Plasmodium falciparum. Proc. Natl. Acad. Sci. USA 104, 9213–9217.
Nash, G.B., Meiselman, H.J., 1983. Red cell and ghost viscoelasticity. Effects of hemoglobin concentration and in vivo aging. Biophys. J. 43, 63–73.
Nguyen, N.T., Wereley, S.T., 2006. Fundamentals and Applications of Microfluidics. Artech House, Norwood, MA.
Parthasarathi, A.A., Japee, S.A., Pittman, R.N., 1999. Determination of red blood cell velocity by video shuttering and image analysis. Ann. Biomed. Eng. 27, 313–325.
Pinho, D., Lima, R., Pereira, A.I., Gayubo, F., 2013a. Automatic tracking of labeled red blood cells in microchannels. Int. J. Numer. Methods Biomed. Eng. 29, 977–987. Pinho, D., Yaginuma, T., Lima, R., 2013b. A microfluidic device for partial cell
separation and deformability assessment. BioChip J. 7, 367–374.
Quinn, D.J., Pivkin, I., Wong, S.Y., Chiam, K.H., Dao, M., Karniadakis, G.E., Suresh, S., 2011. Combined simulation and experimental study of large deformation of red blood cells in microfluidic systems. Ann. Biomed. Eng. 39, 1041–1050. Rodrigues, R.O., Pinho, D., Faustino, V., Lima, R., 2015. A simple microfluidic device
for the deformability assessment of blood cells in a continuousflow. Biomed. Microdevices 17, 1–9.
Saadatmand, M., Ishikawa, T., Matsuki, N., Jafar Abdekhodaie, M., Imai, Y., Ueno, H., Yamaguchi, T., 2011. Fluid particle diffusion through high-hematocrit blood flow within a capillary tube. J. Biomech. 44, 170–175.
Thurston, G., Henderson, M., 2007. Viscoelasticity of human blood. In: Baskurt, O.K. (Ed.), Handbook of Hemorheology and Hemodynamics. IOS Press, pp. 72–90. Uijttewaal, W.S., Nijhof, E.J., Heethaar, R.M., 1994. Lateral migration of blood cells
and microspheres in two-dimensional Poiseuilleflow: a laser-Doppler study. J. Biomech. 27, 35–42.
Wong, K.H.K., Chan, J.M., Kamm, R.D., Tien, J., 2012. Microfluidic models of vascular functions. Annu. Rev. Biomed. Eng. 14, 205–230.