Article
Printed in Brazil - ©2018 Sociedade Brasileira de Química*e-mail: [email protected]
Oxidation of Single-Walled Carbon Nanotubes under Controlled Chemical Conditions
Arthur B. Porto,a Glaura G. Silva,b Hélio F. dos Santosa and Luiz F. C. de Oliveira*,a
aNúcleo de Espectroscopia e Estrutura Molecular, Departamento de Química, Instituto de Ciências Exatas,
Universidade Federal de Juiz de Fora, 36036-900 Juiz de Fora-MG, Brazil
bDepartamento de Química, Instituto de Ciências Exatas, Universidade Federal de Minas Gerais,
Pampulha, 31270-901 Belo Horizonte-MG, Brazil
Single-walled carbon nanotubes are oxidized in the presence of H2SO4/HNO3 mixtures
containing distinct concentrations of the nitronium ion, [NO2+]. The spectroscopic analyses of the
final samples suggest a higher structural disorder in the oxidized systems with increasing [NO2+].
This is due to a considerable oxygen amount on the tube surface, reaching up to 30%, depending
on the reaction time and [NO2+]. Interestingly, if long reaction time is considered, the oxygen
amount on the tube surface is maximum for low [NO2+] and reduces slightly for larger [NO2+].
On the other hand, the oxidation process occurs gradually at 4 h, allowing a fine control of the oxidation process. Therefore, if fine tuning of the oxidation degree is desirable, the reaction must
be conducted during short time (4 h) using increasing [NO2+] as those obtained from 2:1, 2.5:1
and 3:1 H2SO4/HNO3 acid mixtures to produce increasing content of functionalization.
Keywords: SWCNT, acid mixture, H2SO4/HNO3, Raman, DFT
Introduction
The potential applications of carbon nanotubes (CNTs) are currently well-recognized due to their unique physical and chemical properties.1-3 Nonetheless, the practical use
of CNTs has some barriers since, without prior treatment, they are chemically inert and present low dispersion in most common solvents.4-6 Moreover, CNT samples
contain amorphous carbon, metallic catalysts, nanotubes with different diameters, and other impurities. Therefore, synthesized CNT samples need chemical treatment to remove the side products and improve reactivity and dispersion.6 Often, the chemical treatment consists, at least
in a first stage, of oxidation reactions creating different functional groups on the tube surface, such as –OH, –COH and –COOH.7 This can be done either with O
2 at high
temperature to remove amorphous carbon or by oxidizing solutions containing H2O2 or KMnO4.8,9 The most common
process consists in using concentrated acid solutions of HCl, H2SO4, HNO3 or a mixture of H2SO4/HNO3, which
remove most of the amorphous carbon and metallic catalysts.10-12 This also promotes chemical modification
of the CNT surface with the creation of several oxygen functional groups and topological defects.
Devaux et al.12 explored the covalent functionalization
of single-walled carbon nanotubes (SWCNTs) through mild oxidation in an acid solution of H2SO4 and HNO3.
The products were analyzed by Raman and infrared spectroscopies. The Raman spectra showed a decrease of the D band intensity after acid treatment, suggesting the removal of impurities without considerable damage to the SWCNT structure. The infrared spectra showed absorption bands due to the oxygen groups –OH and –C=O of carboxylic acid and quinone after the oxidation process.
Regarding oxidation with concentrated acids, a mixture of H2SO4/HNO3 is often used. It can effectively remove
the impurities and promote significant functionalization of the CNT surface. This mixture produces the nitronium ion (NO2+) in situ according to the reaction
2H2SO4 + HNO3 → NO2+ + H3O+ + 2HSO4–. This is
considered one of the main active species responsible for oxygen transfer to the CNT surface. The nitronium ion is a strong electrophilic species and interacts with the electron-rich CNT surface. This has been proven in the CNT oxidation by nitronium ion solution from NO2SbF6
and NO2BF4 salts.13,14
Da Silva et al.15 proposed an oxidation mechanism of
SWCNT in acid solution using computational approaches. They used ab initio calculations with periodic boundary
species NO2+ + H2O + NO3– and an armchair (6,6) SWCNT.
The results suggested an oxygen transfer from NO2+ to
the SWCNT with formation of carbonyl groups without changing the metallic nature of the SWCNT. In our previous work,16 the interaction between NO
2+ and an SWCNT
was investigated using density functional theory (DFT). Three models for an armchair (6,6) SWCNT were used as follows: one pristine form and two structures with topological defects. The oxidation pathway was described, including the energy barriers for oxygen transfer from NO2+
to SWCNT and the formation of the oxygen-containing functional groups epoxide, ether and carbonyl.
Since the nitronium ion can be obtained from the acid mixtures H2SO4/HNO3, its concentration can be varied by
acid proportions. Edwards et al.17 studied the equilibrium in
acid mixture with different proportions of H2SO4, HNO3 and
H2O. They used a mixture of H2SO4 (98%), HNO3 (95%)
and water to create solutions with different stoichiometries of the species and then quantified the nitronium ion concentration. The results showed that increasing the percentage of water in solution decreases the nitronium ion concentration. Moreover, increasing the proportion of sulfuric acid increases the nitronium ion concentration.
In the oxidation of CNTs, it is common to indicate the acid proportions in volume (v/v) instead of concentration of NO2+, therefore, it would be worthwhile to establish such a
correlation. Gong et al.18 performed the oxidation of
multi-walled carbon nanotubes (MWCNT) using pure nitric acid and H2SO4/HNO3 mixtures in different v/v proportions:
1:1, 2:1, 3:1, 4:1 and 5:1 (H2SO4:HNO3). They observed
that the –COOH concentration increased from 1:1 to 3:1 and then slightly decreased. The available experimental studies suggest that different mixtures yield distinct concentrations of NO2+ and, consequently, might control the
CNT oxidation. However, they do not establish quantitative relationships between H2SO4/HNO3 mixtures, NO2+
concentration and oxidation degree. This is the main goal of the present study that intends to understand and explore the reaction between CNT and NO2+ under chemical control
of the oxidizer concentration. Analysis of the H2SO4/HNO3
acid mixture in different v/v proportions, 1:1, 2:1, 2.5:1, 3:1, 4:1, 5:1, 6:1, 7:1 and 8:1, was performed with the aim of quantifying the free NO2+ concentration available
in solution. This was done by using a standard solution of NO2BF4 in H2SO4 and the ν(NO2+) Raman band intensity
to monitor the ion concentration. A calibration curve could be obtained by plotting the intensity of the ν(NO2+) band
against [NO2+]. Furthermore, three H2SO4:HNO3 solutions
with proportions of (v/v) 2:1, 2.5:1 and 3:1 were used to oxidize the SWCNT samples and the products were analyzed by Raman spectroscopy, thermogravimetric
analysis (TGA) and energy dispersive spectroscopy (EDS) in addition to DFT calculations.
Experimental
Samples
Sulfuric acid (95-99%) and nitric acid (65%) were both purchased from Vetec, and nitronium tetrafluoroborate (NO2BF4) (≥ 95%) was purchased from Sigma-Aldrich.
The SWCNT sample used in this study was purchased from Sigma-Aldrich and prepared by the CoMoCat™ (catalytic chemical vapor deposition (CVD) method). According to the manufacturer, the sample has composition of carbon ≥ 95%, and ≥ 93% as SWCNTs with diameters in the range 0.7-0.9 nm.
Calibration plot
The standard solutions of nitronium ion were prepared in duplicate by dissolving the NO2BF4 salt in sulfuric acid
(95-99%) to obtain a 2.0 M solution. Successive dilutions were performed to prepare 1.8, 1.6, 1.4, 1.2, 1.0, 0.8, 0.6, 0.4 and 0.2 M solutions. The concentration of nitronium ion was monitored by the area of the band assigned to ν(NO2+)
at ca. 1400 cm-1 in the Raman spectrum.
Acid mixtures
The acid mixtures were prepared with fixed volume of 10 mL in different H2SO4/HNO3 proportions (v/v): 1:1,
2:1, 2.5:1, 3:1, 4:1, 5:1, 6:1, 7:1 and 8:1. The mixtures were prepared at low temperature in an ice bath to minimize the formation of nitrosylsulfuric acid and to prevent the loss of nitric acid. The Raman spectra were obtained immediately.
SWCNT oxidation
Raman spectroscopy
Fourier transform Raman spectra were carried out for all samples used for the calibration plot and the acid treatment using a Bruker RFS 100 instrument, an neodymium-doped yttrium aluminium garnet (Nd:YAG) laser operating at 1064 nm and a liquid nitrogen cooled Ge detector. The system had 4 cm-1 of spectral resolution for
256 scans using a laser power of 200 mW at the sample. The SWCNT samples were analyzed in a dispersive Raman Bruker SENTERA with a laser operating at 633 nm and a charge-coupled device (CCD) detector with 3-5 cm-1 of
spectral resolution and 10 co-addictions of 10 s using a laser power of 2 mW at the sample. All spectra were obtained at least twice to guarantee the position and intensity of each observed band in the spectra.
Scanning electron microscopy (SEM)-EDS analysis
SEM images were obtained in a tabletop Hitachi TM 3000 instrument featuring improved electron optics, high magnification, and built-in image processing to further enhance image quality and resolution at lower accelerating voltage. The system was operated at 5 or 15 kV with magnification from 15 to 30,000×, without any sample preparation. An energy dispersive X-ray spectrophotometer Quantax 70 EDX from Bruker was also used for light element detection from boron upwards, with available linescan, mapping and multiple point analysis at the sample.
Thermogravimetric analysis
The thermogravimetric analysis was performed using a Shimadzu DTG60 with a heating rate of 10 oC min-1 under
synthetic air atmosphere from 25 to 850 oC.
DFT calculations
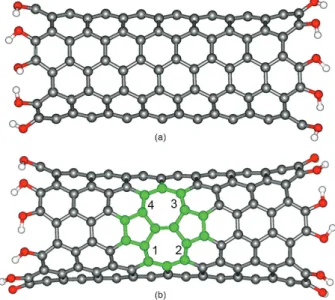
Some CNT oxidized structures were modelled using a (6,5) SWCNT with molecular formula C180H22O22.
The models have nominal length of 22 Å and diameter of 0.75 nm. Six SWCNT structures were constructed: pristine (P), without topological defects; an SWCNT with a Stone-Wales defect (SW); and four SWCNTs with SW defects oxidized with 1-4 oxygen atoms, called SW-1O, SW-2O, SW-3O and SW-4O, respectively (Figure 1). The geometries and Raman spectra were calculated for all structures in vacuum at the DFT level with the hybrid Becke, three-parameter, Lee-Yang-Parr (B3LYP)19
functional and 6-31G(d) split-valence basis set.20,21 A
similar level of theory was used in our previous paper regarding the oxidation of SWCNTs in an acid medium.16
Results and Discussion
Acid mixture equilibrium
The H2SO4:HNO3 acid mixture is often used to oxidize
CNTs, where the NO2+ ion is the main oxidizing species in
solution. First, a calibration plot using standard solutions of nitronium ions was constructed. The nitronium ion has a characteristic Raman signal at ca. 1400 cm-1, assigned to
ν(NO2+), that was used to monitor the species concentration
in solution. The corresponding band area was integrated and linearly correlated with the concentration of NO2+ in solution.
The calibration plot is shown in Figure 2 and equation 1.
R = 0.967 (1)
The acid mixture involves many equilibrium processes, and different species are formed from dissociation and reaction between the two acids (equations 2-5).
(2) (3) (4) (5)
With the aim of understanding the composition of the acid mixtures, Raman spectroscopy was used to identify the
Figure 1. Molecular models for an SWCNT with the molecular formula
C180H22O22: (a) pristine (P) and (b) Stone-Wales (SW) defect in green.
main species. The Raman spectra for the acid mixtures are shown in Figure 3, and the main assignments are presented in Table 1.
The bands due to sulfuric acid and the other species arising from its dissociation increase in intensity with the sulfuric acid proportion, as observed for the bands at 415, 567, 912 and 1174 cm-1. On the other hand, the bands due
to nitric acid at 682 and 1314 cm-1 decrease in intensity
since the nitric acid was added in smaller volumes than sulfuric acid, and part of this is consumed for nitronium ion formation. The nitronium ion band at 1400 cm-1 does
not appear in the 1:1 mixture, indicating that, under this condition, the NO2+ ion is not formed in a significant
amount. For the other mixtures, the band at 1400 cm-1 is
clearly observed. Since the nitronium ion plays a primary role in the CNT oxidation reaction, its quantification in the acid mixtures is important and can be accomplished using Raman spectroscopy with the aid of the calibration curve represented by equation 1. The results are shown in Table 2, showing the observed NO2+ concentration and
the initial concentration of H2SO4, HNO3 and H2O for all
mixtures analyzed. Overall, the increasing concentration of H2O implies a decrease in [NO2+], conversely, the
[NO2+] increases with [H2SO4]. These trends are in line
with previous work by Edwards et al.17 The temperature
also influences the equilibria represented in equations 2-5. Edwards et al.17 demonstrated that increasing the
temperature leads to a decrease in [NO2+]. Herein, all
mixtures were prepared in an ice bath, and the spectroscopic analysis was made at room temperature.
SWCNT oxidation
To investigate the influence of the nitronium ion concentration and reaction time on the CNT oxidation, we chose the acid mixtures (H2SO4:HNO3, v/v)
2:1 ([NO2+] = 1.40 mol L-1), 2.5:1 ([NO2+] = 1.89 mol L-1)
and 3:1 ([NO2+] = 2.56 mol L-1) and reaction times 4, 8 and
12 h (plus 1 h of the ultrasound bath) in nine experiments. The Raman spectra of the oxidized samples obtained at room temperature with a 633 nm excitation laser are shown in Figure 4 in the region between 1800-1200 cm-1 (D/G
bands) and Figure 5 in the region between 400-200 cm-1
(radial breathing mode (RBM) bands).
Figure 4 shows the main Raman bands of the CNTs in the 1200-1800 cm-1 range. The intensity of the D band
between 1300-1370 cm-1 refers to induced disorder, i.e., a
higher oxidation degree corresponds to greater disorder and consequently a more intense D band. The G band occurs in the range 1500-1605 cm-1 and is assigned to vibrations
of all carbon materials. In SWCNTs, the G band consists of two main components: one peak at high frequency 1590 cm-1 (G+) associated with vibrations along the
nanotube main axis and a second peak observed at low
Figure 2. Calibration plot obtained by the area of the vibrational band assigned to the ν(NO2+) (at 1400 cm-1) vs. nitronium ion concentration in
a standard NO2BF4 solution.
Table 1. Assignments of the Raman bands of the H2SO4:HNO3 acid
mixtures
Wavenumber / cm-1 Species Assignment
415m SO42– δSO4
567m HSO4– + HNO3 δSO2 + δN–O–H
682w HNO3 δO–N–O + νN–OH
912s SO42– + HNO3 νsSO4 + νN–OH
1040s HSO4– + NO3– νsSO4 + νsNO3
1174w H2SO4 + HSO4– δSO–H
1314m HNO3 δN–O–H
1400m NO2+ νsNO2+
m: moderate; w: weak; s: strong; δ: deformation; ν: stretching;
νs: antisymmetric.
Figure 3. Raman spectra of acid mixtures in different H2SO4:HNO3
Table 2. Molar concentration of NO2+ observed in H2SO4:HNO3 acid mixtures. The original concentrations of the acids and water are also provided
Proportion (H2SO4:HNO3, v/v) [NO2+] / (mol L-1) [H2SO4] / (mol L-1) [HNO3] / (mol L-1) [H2O] / (mol L-1)
1:1 0.00 8.92 7.22 11.11
2:1 1.40 11.95 4.77 8.28
2.5:1 1.89 12.80 4.10 7.52
3:1 2.56 13.38 3.61 6.69
4:1 3.63 14.27 2.89 6.11
5:1 4.48 14.80 2.46 5.62
6:1 4.23 15.34 2.06 5.02
7:1 4.53 15.61 1.81 4.87
8:1 4.33 15.87 1.60 4.61
Figure 4. Raman spectra in the 1200-1800 cm-1 range for the products of oxidation reactions at (a) 4 h, (b) 8 h and (c) 12 h. The D band is assigned at
approximately 1300 cm-1 and the G– and G+ bands at approximately 1540 and 1590 cm-1, respectively.
frequency approximately 1540 cm-1 (G–) associated with
the vibrations of carbon atoms along the circumferential direction of SWCNT. Both frequencies are sensitive to charge transfer from dopant additions to the tube surface. The D band is sensitive to the disorder and consequently to the tube surface oxidation. Figure 4 shows an increase of the D band intensity and a shift to higher frequency for all samples, regardless of the reaction time. For the untreated sample, the band was at 1300 cm-1 and shifted to 1330 cm-1
after oxidation, indicating the significant oxidation degree. The G+ and G– bands also shift to higher frequency upon
oxidation. The G+ band shifts from 1591 cm-1 in the untreated
sample to 1600 cm-1 in the oxidized samples, whereas the
G– band shifts from 1542 to 1554 cm-1 followed by a decrease
in intensity and band broadening. The G+ band frequency is
sensitive to charge transfer from/to the SWCNT. The G– band
frequency depends on the electronic nature of the SWCNT (metallic or semiconducting) and also on the SWCNT diameter.22,23 The up shifts in the G bands observed in the
Raman spectra upon oxidation can be interpreted as a result of the charge transfer from SWCNT to NO2+ and change in
the diameter of the SWCNT.16,24
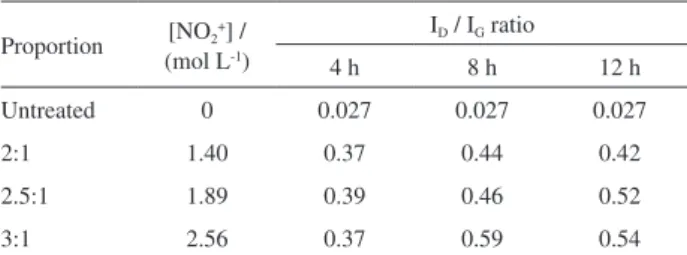
The relative D and G band intensities (ID / IG) provides
qualitative information about the structural disorder on the nanotube, i.e., the increase of the oxidation will cause an increase in this ratio. Table 3 shows the ID / IG ratio for the
untreated and oxidized samples. The ID / IG ratio for the
untreated sample was 0.027; after 4 h of reaction, the ratio was 0.37 due to the oxidation of the nanotube surface. The increase of the reaction time to 8 h promotes an increase in the ID / IG ratio, suggesting that, after 8 h, the oxidation
process reaches a saturation limit where the tube surface is covered by oxygen-containing groups.
The relationship between the ID / IG, acid proportion and
reaction time is shown in Table 3, with ID / IG increasing
with nitronium ion concentration or reaction time. The higher [NO2+] and longer reaction time, the larger the
ID / IG ratio, suggesting an increase in the oxidation degree.
Moreover, the ID / IG ratio converges for reaction times
greater than or equal to 8 h. Thus, the increase of [NO2+]
and reaction time lead to saturation in the oxidation degree after ca. 8 h. It is also worth noting the small variation of ID / IG ratio with [NO2+] for short reaction time (4 h).
It might be interpreted as a rate law proportional to the NO2+ concentration, therefore, the variation of ID / IG with
time, which is a parameter for the speed at which products are formed, should increase with [NO2+], supporting our
hypothesis for controlling the oxidation degree.
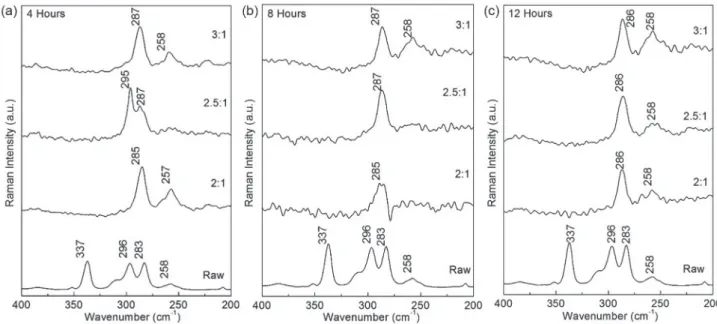
Figure 5 shows the 400-200 cm-1 spectral region
where the RBM are assigned. The RBM frequency (νRBM)
is inversely correlated with the SWCNT diameter d by: .22 The band at 337 cm-1 corresponds to a
tube diameter of 0.7 nm, as expected for the (6,5) SWCNT. The other bands at 310, 296, 283 and 256 cm-1 in the
untreated sample correspond to tubes with diameters of approximately 0.76, 0.80, 0.82 and 0.92 nm, respectively. The Raman spectra represented in Figure 5 show a disappearance of the band at 337 cm-1 with the oxidation
process, suggesting that tubes with diameter < 0.7 nm were consumed or had their local diameter increased upon oxidation. In general, the oxidation process promotes an increase in the tube diameter, shifting the νRBM to smaller
values. In Figure 5a, for 4 h of reaction, the 2.5:1 mixture still has two peaks at 287 and 295 cm-1 with considerable
intensity of the bands, suggesting a smaller degree of oxidation. This cannot be explained based on NO2+
concentration and should be due to some oscillation on the reaction conditions, even though the results for 2:1 and 3:1 are in line with the other reactions at longer time. For the 8 and 12 h reactions, the Raman spectra show one band at 285 and 258 cm-1, respectively, suggesting that most tubes
had an average diameter of ca. 0.83 nm. The oxidation with the 3:1 mixture led to an increase of the peak at 258 cm-1,
suggesting an enlargement of the nanotubes’ local diameter upon oxidation.
Our results of the acid oxidation of SWCNT are in line with those reported by many authors.5,6,23-25 Jorio et al.,25
in his review, reported an increase in the D band intensity followed by an increase in the ID / IG ratio upon oxidation.
Tchoul et al.6 explored the influence of mild nitric acid
oxidation on the size and structure of SWCNT following two procedures, one using 8 M of nitric acid with sonication and another with 2.6 M of nitric acid at reflux. The Raman spectra showed an increase in the ID / IG ratio. In the RBM
region, small shifts of the frequencies were observed, along with a decrease of the intensity of the bands at higher frequencies. Gómez et al.7 also reported the effects
in the structure of the MWCNT by sulfonitric treatment. A solution of H2SO4 98% and HNO3 65% (3:1 v/v) was
Table 3. ID / IG ratio observed for the untreated and oxidized SWCNT
samples
Proportion [NO2+] /
(mol L-1)
ID / IG ratio
4 h 8 h 12 h
Untreated 0 0.027 0.027 0.027
2:1 1.40 0.37 0.44 0.42
2.5:1 1.89 0.39 0.46 0.52
3:1 2.56 0.37 0.59 0.54
employed for the acid treatment, and the Raman spectra also showed a D band and ID / IG ratio increase after the oxidation
process. It is also important to mention the effect on the tube length by acid oxidation. It has been well established that the cutting and debundling simultaneously occur in the chemical oxidation of SWCNT. As a consequence, the length and diameter of SWCNT bundles are reduced at the same time.26,27 In the present work, the experimental
conditions for the oxidation were based on acid mixtures 2:1, 2.5:1, and 3:1 (v/v) in a total volume of 50 mL and the reactions were carried out in an ultrasound bath for 1 h plus 4, 8 or 12 h with magnetic stirring at room temperature. Therefore, considering the lower temperature and periods of treatment with respect to the previous works,26,27 it can be
proposed that the length reduction should not be significant to the discussion of the results herein in some extent, for instance for the data related to the 4 h of treatment. The elimination of smaller diameter tubes was indeed observed by the RBM analysis and the shortening of the nanotubes may be associated with the effects observed in the oxidation at longer periods (8 and 12 h) and higher concentrations of NO2+.
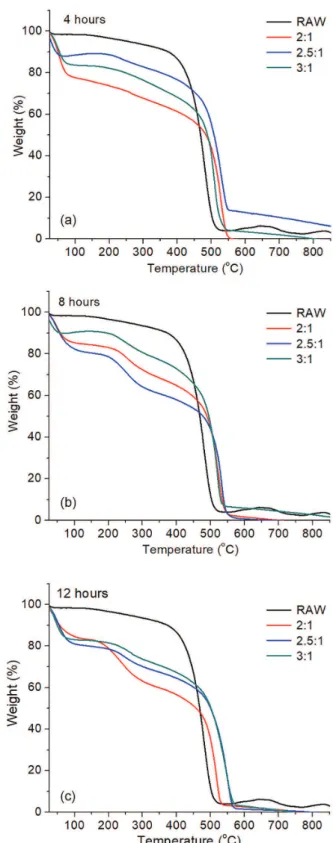
TGA provides qualitative and quantitative information about nanotube stability. Figure 6 shows the thermograms obtained for the oxidation process after 4, 8 and 12 h for distinct mixtures. Table 4 exhibits the temperature for the greatest rate of mass loss observed in differential TGA (DTGA). The TGA curve for the untreated sample shows the largest rate of mass loss at 474 oC. The oxidation stage
is known for its purification effect with the digestion of the metals from the catalysts and the tubes with smaller diameters. This effect led to the increase of the CNT average diameter in the samples, as observed in the Raman spectra analysis. As a result, the temperature of the tube decomposition increases to > 510 oC for all samples.
The temperatures observed in Table 4 indicate that for all three different oxidation times the increase in acid concentration from 2:1 to 2.5:1 benefited the samples with respect to thermal stability. However, the more concentrated acid treatment seems to damage the nanotubes and lead to decrease in the tendency of thermal stability. Moreover, the TGA shows two other mass loss events at 100 oC due to
moisture release and from 120-400 oC due to the
oxygen-containing groups and residual moisture.
The EDS data were used to analyze the samples before and after the oxidation. The EDS analysis was performed with multiple measurements of different points of the sample and an average of the atomic content provides semi-quantitative information about the system composition as the atomic percentage on the sample. Figure 7 shows the oxygen content obtained for samples from distinct
experiments as function of [NO2+] and reaction time. For
4 h reaction the oxygen percentage increases continuously with the NO2+ concentration up to 26.2% (oxidized sample
at 3:1 acid mixture, [NO2+] = 2.56 mol L-1). For 8 and 12 h
reactions, the oxidation process reaches saturation quickly
(29.2% of oxygen), even for the low concentration of NO2+
(1.40 mol L-1). Therefore, as also suggested by the Raman
and TGA analyses, the oxidation process occurs gradually at 4 h and depends on the NO2+ concentration, allowing a
fine control of the oxidation degree.
The mass loss in the range of 100-350 oC also supports
the understanding of the oxidation processes. In this temperature range, the loss of oxygen groups occurs. For the process with the 2:1 mixture, the mass losses were 13.3, 16.9 and 25.0% for 4, 8 and 12 h, respectively. This increase in the mass loss with time suggests a larger amount of oxygen-containing groups for longer reaction times, in line with the EDS analysis (see Figure 7).
DFT results
To assist in the characterization of SWCNT oxidized samples, DFT calculations were performed for the molecular models represented in Figure 1. The simulated Raman spectra are shown in Figure 8 for the D and G (Figure 8a), and RBM (Figure 8b) regions. For the pristine
form, all the bands are well defined, as expected for a perfect tube. The insertion of the SW topological defect promotes some changes on the D / G relative intensity, which are intensified in the oxidized structures. As discussed previously, the ID / IG ratio is used as parameter
to monitor the degree of oxidation of the nanotube. This quantity increases with the structural disorder on the tube surface as a consequence of the insertion of oxygen atoms. The calculated ID / IG ratios are given in Table 5, showing the
lowest ID / IG ratio for the pristine model P and an increase
with the number of oxygen atoms added to the SWCNT surface. These results closely follow the trend observed experimentally, where the ID / IG ratio increased from 0.027
to 0.54 upon oxidation (see Table 3).
Table 4. Temperature at the greatest mass loss obtained from DTGA analysis
Proportion [NO2+] /
(mol L-1)
Temperature / oC
4 h 8 h 12 h
Untreated 0 474 474 474
2:1 1.40 530 525 521
2.5:1 1.89 536 534 556
3:1 2.56 510 520 550
Figure 7. Oxygen percentage obtained by EDS for the products from
distinct reactions. Data is average of replicate measurements.
The low frequency Raman spectra are shown in Figure 8b. For the P model, only one signal was predicted at 310 cm-1 due to the RBM vibration. Similar behavior
was observed for the SW model, suggesting that small topological defects do not significantly change the tube diameter. The addition of oxygen atoms to the tube surface led to the appearance of bands in the lower frequency region assigned as local-RBMs of the part of surface containing the oxygen atoms.
These results suggest that the addition of oxygen atoms to the SWCNT surface increases the average diameter due to a local distortion in the oxidized region, and, consequently, results in the appearance of new bands at lower frequencies. The simulated Raman spectra aid in the interpretation of the experimental Raman data, in which the disappearance of the signal at 337 cm-1 (Figure 5) and a new
band at ca. 287 cm-1 was observed, strongly suggesting an
increase in the diameter of the SWCNT after the oxidation.
Conclusions
In the present study, the acid oxidation of SWCNT was monitored as function of the reaction time and NO2+ concentration. The [NO2+] in the acid mixture
was quantified through Raman spectrum analysis with the aid of a calibration plot constructed from a standard solution of NO2BF4 salts in H2SO4. The [NO2+] ranged
from 1.40 to 4.48 mol L-1 for the H
2SO4:HNO3 mixtures
2:1 and 5:1, respectively. Moreover, for the mixtures 6:1, 7:1 and 8:1, the concentration of NO2+ converged to
the limit of 4.33 mol L-1. Three H
2SO4:HNO3 solutions,
2:1 ([NO2+] = 1.40 mol L-1), 2.5:1 ([NO2+] = 1.89 mol L-1)
and 3:1 ([NO2+] = 2.56 mol L-1), were used to oxidize
the SWCNTs for 4, 8 and 12 h, resulting in nine distinct experiments. After oxidation, the Raman spectra of the resulting samples showed a significant increase of the
D band intensity followed by a shift to higher frequency due to an increase in the structural disorder of the system after oxidation. In the G band region, the decrease of the G– band intensity was followed by a shift to higher
frequency. The G+ band also shifted to higher frequency,
which suggests a significant oxidation degree due to charge transfer between the reactive species. The ID / IG
ratio was analyzed and correlated with the extent of oxidation. The ID / IG ratio increased with reaction time,
converging to an almost constant value after 8 h of reaction. As expected, the increase of the reaction time and the nitronium ion concentration promoted an increase in the ID / IG ratio from 0.37 ([NO2+] = 1.40 mol L-1 and 4 h) to
0.54 ([NO2+] = 2.56 mol L-1 and 12 h). The RBM analysis
confirmed the disappearance of SWCNTs with small diameters and the increase of the average diameter due to the insertion of oxygen-containing groups on the tube surface. The TGA showed an increase in the temperature corresponding to the maximum rate of mass loss from 474 to ca. 550 oC. As observed for the I
D / IG ratio analysis, the
increase of the NO2+ concentration and reaction time led to
an increase in the mass loss between 100 and 350 oC, which
was assigned to the number of oxygen-containing groups on the tube walls. From the EDS analysis, we observed a considerable increase of the amount of oxygen-containing groups and found 7.1% in the pristine form and at least 20% in the oxidized forms. The percentage of oxygen increased gradually up to 4 h, depending on the NO2+ concentration and
converged quickly to a limit value of approximately 20% for reaction times longer than 8 h. The results allow proposing an experimental protocol to get a fine tune of oxidation degree by setting a short reaction time (ca. 4 h) and increase smoothly the NO2+ concentration (up to ca. 3 mol L-1). The latter can
be accomplished using distinct proportion of H2SO4/HNO3
mixture defined by the analytical models constructed in the paper. Moreover, the results reported here contribute to the vast field of the functionalization of SWCNTs, providing chemical insight to controlling acid oxidation.
Acknowledgments
The authors would like to thank CNPq, FAPEMIG (APQ-00591-15 and APQ-01786-15) and CAPES for providing support to this investigation.
References
1. Baughman, R. H.; Zakhidov, A.; de Heer, W. A.; Science 2002,
297, 787.
2. Endo, M.; Hayashi, T.; Kim, Y. A.; Terrones, M.; Dresselhaus, M. S.; Philos. Trans. R. Soc., A 2004, 362, 2223.
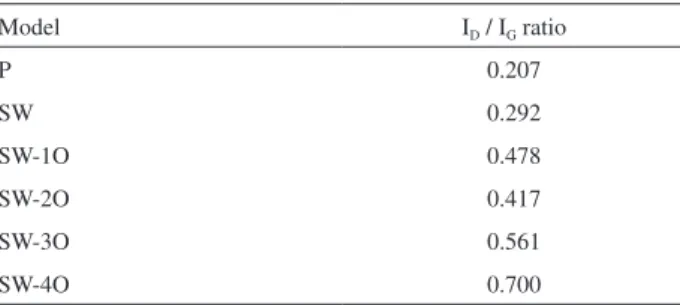
Table 5. ID / IG ratio calculated using the simulated Raman spectra, with
the D band at 1270 cm-1 and G band at 1620 cm-1
Model ID / IG ratio
P 0.207
SW 0.292
SW-1O 0.478
SW-2O 0.417
SW-3O 0.561
SW-4O 0.700
ID / IG ratio: relative D and G band intensities; P: pristine single-walled
3. De Souza, L. A.; Nogueira, C. A. S.; Ortega, P. F. R.; Lopes, J. F.; Calado, H. D. R.; Lavall, R. L.; Silva, G. G.; Dos Santos, H. F.; De Almeida,W. B.; Inorg. Chim. Acta 2016, 447, 38. 4. Furtado, C. A.; Kim, U. J.; Gutierrez, H. R.; Pan, L.; Dickey,
E. C.; Eklund, P. C.; J. Am. Chem. Soc. 2004, 126, 6095. 5. Osorio, A. G.; Silveira, I. C. L.; Bueno, V. L.; Bergmann, C. P.;
Appl. Surf. Sci. 2008, 255, 2485.
6. Tchoul, M. N.; Ford, W. T.; Lolli, G.; Resasco, D. E.; Arepalli, S.; Chem. Mater. 2007, 19, 5765.
7. Gómez, S.; Rendtorff, N. M.; Aglietti, E. F.; Sakka, Y.; Suárez, G.; Appl. Surf. Sci. 2016, 379, 264.
8. Hernadi, K.; Siska, A.; Thiên-Nga, L.; Forró, L.; Kiricsi, I.; Solid State Ionics 2001, 141-142, 203.
9. Datsyuk, V.; Kalyva, M.; Papagelis, K.; Parthenios, J.; Tasis, D.; Siokou, A.; Kallitsis, I.; Galiotis, C.; Carbon 2008, 46, 833. 10. Yaya, A.; Ewels, C. P.; Wagner, P.; Suarez-Martinez, I.;
Gebramariam Tekley, A.; Rosgaard Jensen, L.; Eur. Phys. J.: Appl. Phys. 2011, 54, 10401.
11. Toebes, M. L.; van Heeswijk, J. M.; Bitter, J. H.; van Dillen, A. J.; de Jong, K. P.; Carbon 2004, 42, 307.
12. Devaux, X.; Vigolo, B.; McRae, E.; Valsaque, F.; Allali, N.; Mamane, V.; Fort, Y.; Soldatov, A. V.; Dossot, M.; Tsareva, S. Y.; ChemPhysChem 2015, 16, 2692.
13. Yang, C.-M.; Park, J. S.; An, K. H.; Lim, S. C.; Seo, K.; Kim, B.; Park, K. A.; Han, S.; Park, C. Y.; Lee, Y. H.; J. Phys. Chem. B 2005, 109, 19242.
14. An, K. H.; Yang, C.-M.; Lee, J. Y.; Lim, S. C.; Kang, C.; Son, J.-H.; Jeong, M. S.; Lee, Y. H.; J. Electron. Mater. 2006, 35,
235.
15. Da Silva Jr., A. M.; Dos Santos. H. F.; Giannozzi, P.; Chem. Phys. Lett. 2013, 582, 123.
16. Porto, A. B.; de Oliveira, L. F. C.; Dos Santos, H. F.; Comput. Theor. Chem. 2016, 1088, 1.
17. Edwards, H. G. M.; Turner, J. M. C.; Fawcett, V.; J. Chem. Soc., Faraday Trans. 1995, 91, 1439.
18. Gong, H.; Kim, S.-T.; Lee, J. D.; Yim, S.; Appl. Surf. Sci. 2013, 266, 219.
19. Becke, A. D.; J. Chem. Phys. 1993, 98, 5648.
20. Petersson, G. A.; Bennett, A.; Tensfeldt, T. G.; Al-Laham, M. A.; Shirley, W. A.; J. Chem. Phys. 1988, 89, 2193.
21. Petersson, G. A.; Al-Laham, M. A.; J. Chem. Phys. 1991, 94,
6081.
22. Dresselhaus, M. S.; Dresselhaus, G.; Jorio, A.; Souza Filho, A. G.; Saito, R.; Carbon 2002, 40, 2043.
23. Dresselhaus, M. S.; Dresselhaus, G.; Saito, R.; Jorio, A.; Phys. Rep. 2005, 406, 47.
24. An, K. H.; Park, J. S.; Yang, C.-M.; Jeong, S. Y.; Lim, S. C.; Kang, C.; Son, J.-H.; Jeong, M. S.; Lee, Y. H.; J. Am. Chem. Soc. 2005, 127, 5196.
25. Jorio, A.; Santos, A. P.; Ribeiro, H. B.; Fantini, C.; Souza, M.; Vieira, J. P. M.; Furtado, C. A.; Jiang, J.; Saito, R.; Balzano, L.; Resasco, D. E.; Pimenta, M. A.; Phys. Rev. B 2005, 72, 075207. 26. Liu, J.; Rinzler, A. G.; Dai, H.; Hafner, J. H.; Bradley, R. K.;
Boul, P. J.; Lu, A.; Iverson, T.; Shelimov, K.; Huffman, C. B.; Rodriguez-Macias, F.; Shon, Y.-S.; Lee, T. R.; Colbert, D. T.; Smalley, R. E.; Science 1998, 280, 1253.
27. Zhang, J.; Zou, H.; Qing, Q.; Yang, Y.; Li, Q.; Liu, Z.; Guo, X.; Du, Z.; J. Phys. Chem. B 2003, 107, 3712.
Submitted: March 7, 2018
Published online: June 18, 2018

![Table 4. Temperature at the greatest mass loss obtained from DTGA analysis Proportion [NO 2 + ] / (mol L -1 ) Temperature / o C 4 h 8 h 12 h Untreated 0 474 474 474 2:1 1.40 530 525 521 2.5:1 1.89 536 534 556 3:1 2.56 510 520 550](https://thumb-eu.123doks.com/thumbv2/123dok_br/16165543.707271/8.892.453.794.121.389/table-temperature-greatest-obtained-analysis-proportion-temperature-untreated.webp)