Vol. 34, No. 04, pp. 1043 – 1053, October – December, 2017 dx.doi.org/10.1590/0104-6632.20170344s20160024
* To whom correspondence should be addressed
INFLUENCE OF THE ANODIZING PROCESS
VARIABLES ON THE ACIDIC PROPERTIES OF
ANODIC ALUMINA FILMS
D.E.Boldrini
1,*, M.J.Yañez
2and G.M.Tonetto
11Planta Piloto de Ingeniería Química(UNS-CONICET), Camino “La Carrindanga” km 7 E2, CP 8000, Bahía Blanca, Argentina. 2Centro Científico Tecnológico de Bahía Blanca (CONICET), Camino “La Carrindanga” km 7 E3, CP 8000, Bahía Blanca, Argentina.
*Corresponding author: E-mail [email protected]; Fax: 54-291-4861600
(Submitted: January 13, 2016; Revised: April 1, 2016; Accepted: August 7, 2016)
Abstract – In the present work, the effect of the different variables involved in the process of aluminum anodizing
on the total surface acidity of the samples obtained was studied. Aluminum foils were treated by the electro-chemical process of anodic anodizing within the following variable ranges: concentration = 1.5-2.5 M; temperature = 303-323 K; voltage = 10-20 V; time = 30-90 min. The total acidity of the samples was characterized by two different methods:
acid-base titration using Hammett indicators and potentiometric titration. The results showed that anodizing time,
temperature and concentration were the main variables that determined the surface acid properties of the samples, and to a lesser extent voltage. Acidity increased with increasing concentration of the electrolytic bath, whereas the rest of the variables had the opposite effect. The results obtained provide a novel tool for variable selection in order to use synthetized materials as catalytic supports, adding to previous research based on the morphology of alumina layers. Keywords: Total acidity; Anodized aluminum; Structured catalysts.
INTRODUCTION
From the 1970s, monolithic catalysts have been one of the most relevant applications for reactors and catalytic processes (Williams, 2001). This is largely due to the known commercial success that these catalysts have had in environmental processes such as the purification of gases from internal combustion engines, NOx and VOCs removal
(Heck et al., 2001).
The material most commonly used for making monolith supports is cordierite due to its high level of technological development and low production costs in large scale. On
the other hand, producing metallic monoliths is cheaper in
small series. Other advantages of metallic monoliths over ceramic ones are that they present a smaller wall thickness (40-50 μm), good thermal conductivity, a higher mechanical
resistance, and allow for flexibility in the design in terms of size and form of both the structure and the channels (Hayes
et al., 1992; Cybuslki and Moulijn, 1994).
The main disadvantage of metallic monoliths is the low adhesion of the coating acting as support of the active phase. This issue can be solved by pretreating the surface of the metallic substrate, for example by anodic oxidation
(or anodizing) (Wu et al., 2001), thermal oxidation (Tadd et al., 2005) and other chemical treatments (Zhao et al., 2003). These methods can be used as pretreatments to
improve the adhesion of the catalyst or to obtain the catalytic support (Yu et al., 2006).
When working at not too high temperatures, aluminum
is an interesting option for the preparation of metallic
monoliths. It has excellent mechanical and thermal
properties to be used as structural material. By the
Brazilian Journal
of Chemical
Engineering
anodizing process, aluminum can also be coated with
an alumina layer with adequate properties to be used as catalytic support (Nourbakhsh et al., 1991).
The melting point of aluminum (933 K) limits the use of
these monoliths to low- or medium-temperature processes,
but the characteristics of alumina offer interesting prospects
(Hönicke, 1983):
• Similar pore size, shape and length.
• Monodisperse pore distribution.
• Pores are closed at one end and have non-tortuous
structure (Nourbakhsh et al., 1989).
• Texture can be modified by the appropriate experimental
conditions.
Thus the different characteristics of anodized aluminum, such as its porosity, thermal conductivity or versatility to be synthesized, make it an interesting choice for catalytic
purposes (Burgoset al., 2003, Losic and Santos, 2015).
On the other hand, in many reactions of industrial interest, the nature of the catalytic support has a strong influence on the performance of the catalyst. Such is the case of hydrocarbon reforming reactions, where the acidity of the support plays a key role in the stability of the catalyst, favoring cracking and polymerization reactions, which precede the formation of coke (Lisboa et al., 2005).
The technique most widely developed to neutralize the acid nature of the alumina in this type of reactions is
adding alkaline-earth metals such as La, Mg, Zr, Ca and Ce (Sánchez-Sánchez et al., 2007).
Although this method can be easily applied, since it involves a simple wet impregnation of the alumina in an aqueous solution with the nitrate of the metal to be added, a controlled manipulation of the acid nature of the aluminum oxide could optimize the design of the catalytic support.
While the mechanisms involved in the anodizing process at molecular level have been extensively studied
(Mason, 1955; Takahashi et al., 1984; Wood et al., 1963),
most studies describe different aspects of the anodic film growth without exploring the surface properties from a catalytic point of view. Moreover, a direct determination of the surface acidity of the anodic alumina film has not been investigated in terms of the variables involved in the
anodizing process, or correlated with the morphological
changes that are simultaneously generated.
The present work explored the different variables involved in the electro-chemical process of anodic anodizing in order to determine their effect on the acid properties of the synthesized material.
EXPERIMENTAL
Sample preparation
The samples were prepared by anodizing using an ALUAR A1050 aluminum alloy of 0.1 mm thickness. The percentage composition of the base material used is
presented in Table 1.
The process was carried out using a HY3010 Full
Energy power supply, working with variable current and voltage in the 0-10 A and 0-30 V ranges respectively, a polypropylene recipient of adequate size and a Novus 480D PID temperature controller. Agitation of the electrolytic bath was performed by controlled air bubbling.
Oxalic acid (Aldrich, 98%) was used as electrolyte. Prior to the anodizing process, the metal foils were washed
with water and detergent, rinsed with distilled water and
oven dried at 393 K for 60 min. They were then cleaned with acetone to remove water and any remaining organic
impurities.
After obtaining the anodized aluminum sheets, they were washed in distilled water and oven dried at 333 K for 60 min. Then they were calcined in a chromatographic air flow (Air Liquide, 99.5%) at 773K for 120 min in order to remove the remaining traces of acid and stabilize the
alumina generated.
A commercial sample of γ-Al2O3 (Rhône-Poulenc, 120
m2 g-1) was used to make a comparative analysis between
the anodized alumina and a conventional sample.
Experimental design
In order to evaluate the effects of the selected variables on the response variable (A), a 24 factorial design was
developed with 2 centerpoint replicates, varying the process conditions as shown in Table 2. The variables and their levels were: concentration of the electrolyte (1.5-2.5 M), process temperature (303-323K), voltage (10-20V) and time (30-90 min).The variables were selected taking into account some practical considerations, i.e., variables that would lead to a support with catalytic characteristics. The studied response was the surface acidity (meq m-2).
Also the mass of alumina generated (g m-2), BET area (m2
g-1) and topographical characteristics of the surfaces (SEM
images) were studied. The software STATGRAPHICS Centurion version XV.2 was used for both the experimental design and the statistical analysis.
In parallel to the tests described in Table 2, the effect of the thermal treatment applied to the anodized samples
Table 1. Composition of the aluminum alloy used in the preparation of the monoliths.
Element Si Fe Cu Mn Mg Zn Ti Others Al
Influence of the Anodizing Process Variables on the Acidic Properties of Anodic Alumina Films 1045
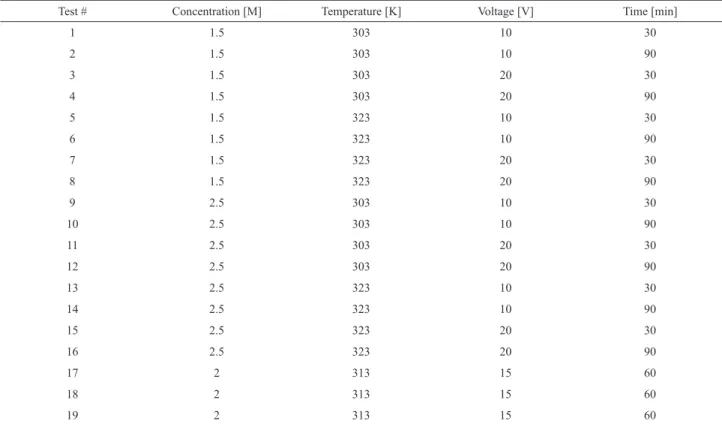
Table 2. Experimental conditions used in the experimental design.
Test # Concentration [M] Temperature [K] Voltage [V] Time [min]
1 1.5 303 10 30
2 1.5 303 10 90
3 1.5 303 20 30
4 1.5 303 20 90
5 1.5 323 10 30
6 1.5 323 10 90
7 1.5 323 20 30
8 1.5 323 20 90
9 2.5 303 10 30
10 2.5 303 10 90
11 2.5 303 20 30
12 2.5 303 20 90
13 2.5 323 10 30
14 2.5 323 10 90
15 2.5 323 20 30
16 2.5 323 20 90
17 2 313 15 60
18 2 313 15 60
19 2 313 15 60
according to test 8 was analyzed. Sample 8’ was not thermally treated and sample 8’’ was treated at 523 K.
Characterization
N
2 adsorption
The samples were characterized by N2 adsorption at 77 K using a Quantachrome Instruments NOVA 1200e apparatus operated between 76 and 756.2 mmHg. The
specific surface area was determined by the BET method. The samples were degassed at 393 K for 24 h before the
determination.
Scanning electron microscopy (SEM)
Samples were coated with gold in a SPI sputter
coater, and observed in a LEO EVO 40X-VP scanning
electron microscope operated at 15 kV. From each sample,
topographical characteristics were obtained from the secondary electron image.
Surface acidity
Surface acidity was determined by two different
methods: acid-base titration using Hammett indicators
(Benesi, 1957), and potentiometric titration as reported by
Cid and Pecchi (1985) using a KEM AT-500N apparatus.
Both techniques are used to quantify the number of acid sites and characterize their level of acidity.
Determination of the mass of Al2O3 generated
A gravimetric method was used to quantify the amount of alumina generated by anodizing, which involved weighing the samples before and after dissolving the
alumina layer with an acid solution. This mixture consisted of 35 ml of phosphoric acid, 20 g of chromic acid and distilled water to 1 liter of solution (Lizarbe Ruiz, 1984).
The process was performed at a temperature between 353 and 373 K, immersing the samples for approximately 45 minutes. After the treatment, the samples were washed in distilled water and oven dried, and then weighed. The amount of alumina generated per aluminum unit area was determined by direct measurement of the size of the
samples. FTIR
Diffuse reflectance and Fourier transform infrared spectroscopy analysis were carried out using a Nicolet
6700 FT-IR spectrometer in the 4000-400 cm-1 region in
order to determine the nature of the different functional groups present in the surface of the catalysts.
The spectra were recorded with a resolution of 4
cm-1 and 64 scans per run by means of a highly sensitive
mercury-cadmium-tellurium detector (MCT-A).
Silicon-carbide (Si-Carb) discs were used to collect
the samples, abrading the surface layer of the monolith. A background spectrum was previously collected with an
unused silicon-carbide disc.
RESULTS AND DISCUSSION
The results obtained for mass of Al2O3 generated, specific
Table 3. Characterization of the obtained surfaces.
Test # Al2O3
[g m-2]*
BET area [m2 g-1]
Acidity [meq m-2]**
1 6.3 19.4 0.0292
2 24.3 26.4 0.0132
3 30.9 9.5 0.0324
4 50.5 23.6 0.0052
5 34.3 23.0 0.0094
6 42.9 39.8 0.0065
7 42.5 21.4 0.0104
8 60.4 35.0 0.0025
8´ 60.4 35.0 0.0043
8´´ 60.4 35.0 0.0034
9 4.8 24.9 0.0508
10 8.9 39.6 0.0237
11 17.1 15.5 0.0453
12 50.1 38.5 0.0088
13 14.9 59.2 0.0254
14 21.1 70.5 0.0116
15 38.0 22.4 0.0219
16 58.2 40.2 0.0085
17 34.9 33.4 0.0153
18 34.9 33.4 0.0153
19 34.9 33.4 0.0153
*Grams of alumina generated per aluminum surface. **Values obtained by potentiometric titration.
Regarding the acidity determined by titration using Hammett indicators, the values obtained presented a maximum relative difference of 5% with respect to the values presented in Table 3, indicating the validity of the
experiments.
On the other hand, surface acidity for the commercial
sample was 0.0115 meq. g-1 (γ-alumina).
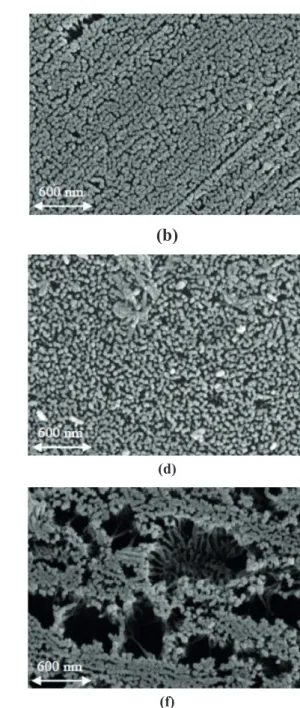
SEM images of the generated surfaces are shown in Figure 1(a), (b), (c), (d), (e), (f).The effect of the studied variables involved in the anodizing process can be observed on the morphological characteristic of the alumina.
When analyzing the results obtained, it can be observed that, by disrupting the time factor and maintaining the rest of the variables constant, the BET area increased in all the cases analyzed. This behavior is attributed to the increase in diameter and length of the pores. The increase in pore
diameter is ascribed to the localized temperature increase
due to the increase in thickness of the oxide layer, which generates an increase in ohmic resistance (Fedotiev and Grilijes, 1972), at the same time as the incorporation of fresh electrolyte is affected (Patermarakis and Papandreadis,
1993). On the other hand, the increase in pore length is due
to the increase generated in the thickness of the alumina
film. These effect can be observed when Figure 1(a) and
(d) are compared (corresponding to Test #1 and #4).
The increase in the electrolyte concentration generated a considerable increase in specific area. This phenomenon can be attributed to the improved conductivity of the acid used, generating pores of the same size both in diameter and length, but in a larger amount. The characteristics of
the Al2O3 film depend on the capacity of the alumina to
dissolve and on the conductivity of the electrolyte (Ono
et al., 2005). Given that the thickness of the film and the
length of the pore remained virtually unchanged with varying concentrations of electrolyte, the amount of alumina generated decreased while the specific surface increased (Fedotiev and Grilijes, 1972).Figure 1(a) and (e) show the changes in the surfaces when the concentration of the electrolyte was modified (Test #1 and #9, respectively).
Influence of the Anodizing Process Variables on the Acidic Properties of Anodic Alumina Films 1047
(a)
(b)
(c)
(d)(e) (f)
Figure 1. SEM images of the alumina generated. References: (a) Test #1, (b) Test #3, (c) Test #5, (d) Test #2, (e) Test #9, (f) Test #10.
Magnification: 80000x.
for the effect of the concentration variable, temperature generated a smaller number of pores but of larger diameter, resulting in the observed increase in BET area. On the other hand, the amount of generated alumina was favored by the temperature increase for this range of variables, the formation prevailing over the dissolution of the layer (Patermarakis and Pavlidou, 1994; Patermarakiset al., 1999;Patermarakis and Nicolopoulos, 1999).
The voltage applied during the anodizing process generated a decrease in surface area as voltage increased (Patermarakis and Pavlidou, 1994). According to a previous report (Fedotiev and Grilijes, 1972), pore density
decreases with increasing voltage, so that the current that
goes through each pore is larger, and also the heat released,
which would account for a possible increase in pore size, and in turn the observed decrease in surface area. The behavior described above is observed upon comparing Figure 1(a) and (b) (Test 1 and 3 respectively).Although a higher voltage generates a decrease in surface area due to the dissolution of the pores, the rate of Al2O3 formation is
higher, resulting in an increase in the amount of generated
alumina.
respect to Test #1 (Figure 1(a)). The increase in ohmic
resistance produced by the increase in the thickness of the layer, along with the greater dissolution capacity of the acid solution (highest concentration), cause a destabilization of the pore structure, thereby forming craters on the oxide surface. For all the tests performed, the strength of the acid sites was very weak, which was in agreement with the initial potential value observed during potentiometric
titration (Pizzioet al., 2001).
The results obtained for the response variable were analyzed in detail by developing a linear model in order to identify the main trends and relationships between factors
and the response.
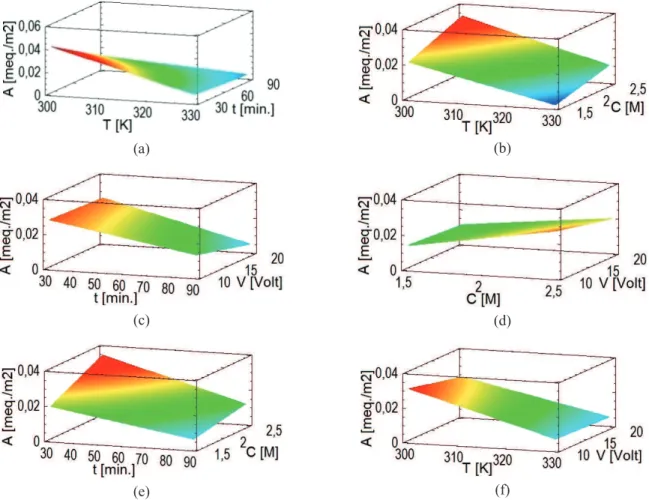
The effects of the experimental factors on total surface acidity considering a linear model and the interactions between the independent variables are shown in Figure 2(a) and (b). According to the coefficient of determination
(R2), the model accounts for 95.2% of variability in acidity,
indicating that the adjusted model is adequate to represent the acidity obtained for each test.
The statistical value of the adjusted R2, which is more
appropriate to compare models with different numbers of independent variables, was 92.9%, while the mean
standard error and absolute error were 0.0035 and 0.0023,
respectively.
The Durbin-Watson test (DW) is used to calculate the
value of the residuals in order to determine whether there is any significant correlation based on the order in which they appear in the data file. The value obtained for DW was1.7398 for a p-value of 0.2385. Given that the p-value was larger than 0.05, there was no indication of significant autocorrelation in the residuals within a level of statistical significance of 95%.
The analysis of variance for the acidity obtained with
this model is shown in Table 4, and the Pareto chart is
presented in Figure 3. It can be observed that 6 independent variables have p values lower than 0.05, indicating that they contribute significantly with the adjustment of the model within a confidence interval of 95%.
Table 4. Analysis of variance for acidity.
Variable T t C V Tt TC TV tC tV CV
p [x10-4] 0 0 1 161 3 4080 2103 124 590 1322
T: temperature, t: time, C: concentration, V: voltage. After identifying the most important effects with the linear model, different quadratic models were fitted to the
experimental data. ANOVA determined that the model
represented by Equation 1 (a quadratic expression for
the concentration) is the model that best represents the
relationship between the response and the significant
factors. The coefficient of determination for this model was 96.0%, while the adjusted R2 had a value of 93.9%. The
DW value was 1.7008 for a p-value of 0.2041, while the
mean standard error and absolute error were 0.0032 and
0.0020, respectively.
(1)
A = 0.51 − 1.5e��T − 4.5e��t − 4.2e��V − 1.56e��Ct + 1.45e��Tt + 5.12e��C�
The effect of the experimental factors on total surface acidity considering the quadratic model is shown in Figure 2(c),(d),(e) and (f).
Along with the increase in R2, the better goodness
of fit of the quadratic over the linear model was also demonstrated by an analysis of the lack of fit using Fisher’s test. High values of parameter F calculated by this test indicate a high level of relation between the data. The F value was of 40.48 and 47.03 for the linear and quadratic model, respectively.
As can be observed in the Pareto chart (Figure 3),
anodization time, temperature and concentration were the
main variables that determined the surface acid properties of the sample, and to a lesser extent voltage. Surface acidity increased with the increasing concentration of the electrolytic bath, whereas the rest of the variables exhibited the opposite effect.
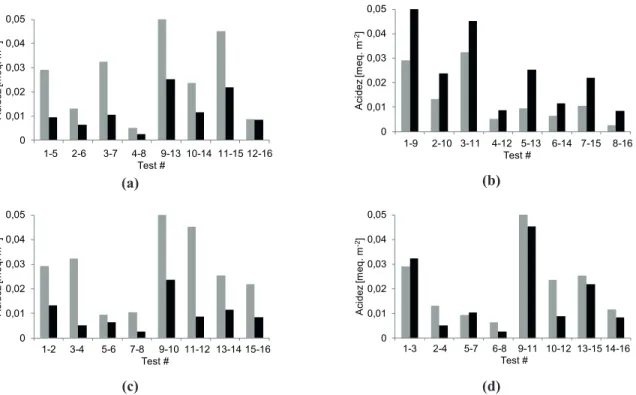
The variation in total surface acidity as a function of the different operating variables of the anodizing process are
shown in Figure 4(a), (b), (c) and (d).
The incorporation of anions to the oxide structure associated with the degree of pore formation, which is larger in electrolytes that produce porous-type films and smaller in electrolytes that produce barrier-type films, such as oxalic acid, was previously reported (Diggle et al., 1969).
The incorporation of water was also detected in porous oxide films formed in oxalic acid. In general, the amount incorporated depends on the conditions and type of treatment during the formation. The available evidence indicates that water is present as a hydroxide or hydrated
oxide or both (Diggle et al., 1969), always in an amount
that represents less than 1% w/w and easily removable by
Infl uence of the Anodizing Process Variables on the Acidic Properties of Anodic Alumina Films 1049
(a) (b)
(c) (d)
(e) (f)
Figure 2. Plots of the estimated response surface. References: (a) {V=15V, C=2M}, (b) {V=15V, t=60min}, (c) {T=313K, C=2M}, (d)
{T=313K, t=60min}, (e) {V=15V, T=313K}, (f){C=2M, t=60min}.
Figure 3. Standardized Pareto chart for response variable (A).
OH groups can be fully removed by heating at 723 K for
2 min, although it is estimated that the process can occur
even at lower temperatures and shorter times (Patermarakis et al., 1991; Patermarakis and Kerassovitou, 1992).
Patermarakis and Pavlidou (1994) studied the catalytic behavior of anodized alumina in the decomposition of HCOOH, and they determined that even though the stoichiometric defects and the presence of H2O and OH groups produce a heterogeneity in the oxide nature, its effect is insignificant compared to the influence of the ions of the incorporated electrolyte.
It is well known that the ions of the electrolyte are located mainly in the outer part of the oxide layer (oxide/ solution interface). When the anodizing takes place, the aluminum oxide is formed in both interfaces: metal/oxide
and oxide/solution. This is because the O-2 ions migrate
to the metal/oxide interface reacting with the Al+3 groups, while the Al+3 ions migrate to the oxide/solution interface reacting with the anions of the electrolyte and O-2. Although the anions of the electrolyte can be coordinated with the Al+3 ions competing with the O-2 groups, their difference in mobility produces that the latter migrate mainly to the metal/oxide interface, whereas the anions of the electrolyte are located mainly in the oxide/solution interface (Takahashi et al., 1984).
Mason (1955) reported that, for electrolytes that produce porous type layers, the incorporation of anions is of up to 17% w/w in films formed in sulphuric acid. In
that work, the author also stated that the incorporation is
higher at lower temperatures and at higher current density or electrolyte concentrations during anodizing. Mason
(1955) proposed that this is due to changes in the anion and
cation movement during the growth of the film, the cation movement being greater the lower the temperature and the
higher the electrolyte concentration or current density. As for the variation in anodizing time, no significant changes were observed in the percentage of incorporated anions when the rest of the variables were kept constant.
Since the same observations were made for electrolytes that form barrier-type films, it has been suggested that the porous film is formed by conversion of the outermost section of the initially formed barrier. Consequently, as the growth of the porous films progresses, the anion distribution throughout the depth of the porous layer would be uniform, and it extends to the surface (Wood et al., 1963).
Analyzing the results presented in Figure 4(a), it can be observed that, by varying the temperature and maintaining the rest of the variables constant, the surface acidity decreased with increasing temperature for all the cases studied. This is consistent with the results by Mason (1955) and Patermarakis and Pavlidou (1994) mentioned above. By increasing the anodizing temperature, a smaller amount of anions would be incorporated to the layer in formation, at the same time as the specific surface area increases, producing the observed decrease in surface acidity.
On the other hand, by increasing the concentration of the electrolyte and maintaining the rest of the variables constant, surface acidity increased according to the results
shown in Figure 4(b). For Mason (1955), the increase in
concentration is the main factor contributing to the larger incorporation of anions during the growth of the oxide film.
The concentration increase produces an increase in the
specific surface area along with a decrease in the amount of oxide formed (Fedotiev and Grilijes, 1972). According to
0 0,01 0,02 0,03 0,04 0,05 A c idez [m eq. m -2]
1-5 2-6 3-7 4-8 9-13 10-14 11-15 12-16 Test # (a) 0 0,01 0,02 0,03 0,04 0,05 A c idez [m eq. m -2]
1-9 2-10 3-11 4-12 5-13 6-14 7-15 8-16 Test # (b) 0 0,01 0,02 0,03 0,04 0,05 A c idez [m eq. m -2]
1-2 3-4 5-6 7-8 9-10 11-12 13-14 15-16 Test # (c) 0 0,01 0,02 0,03 0,04 0,05 A c idez [m eq. m -2]
1-3 2-4 5-7 6-8 9-11 10-12 13-15 14-16 Test #
(d)
Influence of the Anodizing Process Variables on the Acidic Properties of Anodic Alumina Films 1051
the results presented in Table 3, the concentration increase
produces non-essential changes in the surface area of the samples compared to the incorporation of anions reported in the literature (Mason, 1955), which would account for the experimental behavior observed.
As for the effect of anodization time on surface acidity, the results are presented in the comparative chart in Figure 4(c). The increase in time produced a decrease in surface acidity for all the cases studied. This is consistent with previous reports, where varying the anodization time produces an increase both in surface area and in the amount of oxide generated (Fedotiev and Grilijes, 1972), whereas the amount of incorporated anions remains virtually
constant (Mason, 1955).
The effect of voltage on surface acidity is shown in Figure 4(d). There was no clearly defined trend as for the other variables, thus showing the lesser influence of voltage on the surface acidity obtained. As mentioned above, the increase in anodization voltage produces a decrease in
specific surface area (Patermarakis and Pavlidou, 1994), whereas the amount of incorporated anions increases
(Mason, 1955). According to these reports, the expected
trend would correspond to an increase in surface acidity with increasing voltage. At higher concentrations, it can be observed that the effect produced by concentration prevails over voltage, whereas at lower concentrations the effect of time prevails over voltage. The first observation is consistent with the results reported by Mason(1955), where concentration is the main factor favoring the incorporation of anions. As for the second observation, those results can be attributed to the change observed in BET area when time is varied in relation to voltage, as presented in Table 3.
The tests in which the thermal treatment of the samples was varied showed that surface acidity fell progressively
with increasing calcination temperature.
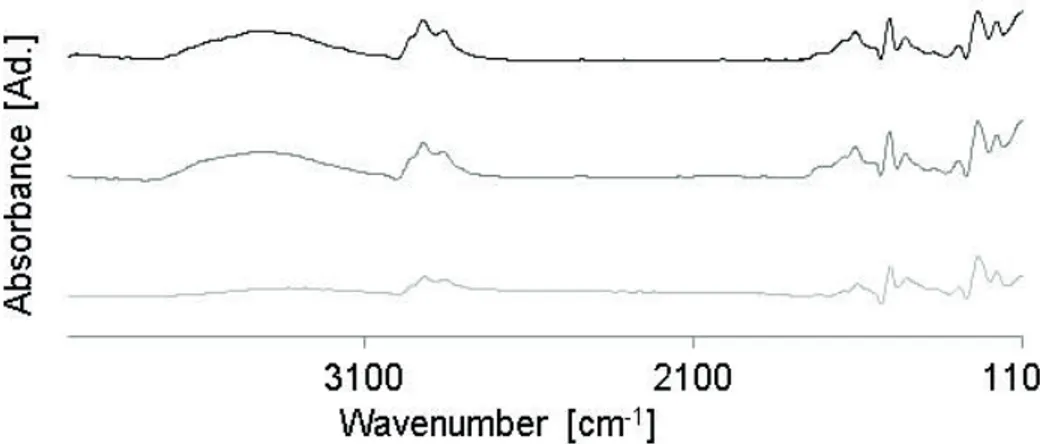
The IR spectra of the samples subjected to different
thermal treatments are presented in Figure 5.
Figure 5. Infrared spectra. Ref.: Test #8´ (black), Test #8´´ (dark gray), Test #8 (light gray).
The broad and intense signal centered at 3400 cm-1
is characteristic of the stretching of hydroxyl groups.
The signals centered at 1465 and 1574 cm-1 indicate the
presence of oxalate anions. These bands are ascribed to the symmetric and asymmetric stretching of the carboxylate anions. Their difference in wavelength is attributed to the bidentate coordination of oxalate groups and Al cations.
The signals around 2800 and 1200 cm-1correspond to the
C-H bond from the oxalic acid, while the signal at about
1700 cm-1 is attributed to the C=O bond associated with
carboxylic acids (Adair et al., 1993; Nakamoto, 2009).
Under an exhaustive thermal treatment (Test #8, Figure 5), a considerable change was observed in all the spectrum compared to that of the untreated sample. The signal about
3400 cm-1 associated with the presence of water decreased
notably, indicating the degree of dehydration of the sample. The signals associated with the presence of residual oxalic
oxide also decreased to a certain extent, as well as the
signal corresponding to the oxalate groups, although to a lesser extent.
The sample subjected to an intermediate thermal
treatment (Test 8´´) did not show notable changes in the signals corresponding to the oxalate groups and residual
oxalic acid, and only the signal attributed to water content
decreased in a small proportion.
Based on these results, it is possible to infer that the changes observed in the surface acidity of the samples subjected to different thermal treatments can be attributed not only to dehydration but also to the loss of residual oxalic acid on the surface.
authors reported a total sulfur (SO3) content of 13%, which decreased to 8% after a long washing step; therefore, the “bound” form contributed with 8% and the “free” form with 5% to the total incorporation of anions, when sulfur acid is used as electrolyte.
Mata-Zamora and Saniger(2005) studied the thermal
evolution of alumina obtained by anodizing with different electrolytes. In the case of oxalic acid, they observed by thermogravimetric analysis a loss of mass between
room temperature and 673 K, which was attributed to
the dehydration process involving both adsorbed and
coordinated H2O. Between 673 and 973 K, the sample exhibited a continuous mass loss associated with the
dehydroxylation process. The mass loss observed at 1423-1573 K was linked to the thermal decomposition of the oxalate group. The melting point of oxalic acid as a pure
compound is 463 K.
Even though dehydration clearly has an effect on the surface acidity of the samples, the quantitative change is negligible compared to the variation observed in Table 3. The surface acidity determined for the different tests can vary even by one order of magnitude compared to the small change observed for thermal treatment. Given that all the tests were subjected to the same thermal treatment, the changes observed can only by attributed to the incorporation of electrolyte ions as described above. This is consistent with the reports by Patermarakis and Pavlidou(1994) described above, where the stoichiometric defects and the presence of H2O and OH groups did not affect the catalytic activity in the reaction under study.
In the case of the commercial alumina studied, the trend for the acidity values obtained (anodized Al2O3>γ-Al2O3)
is similar to that reported in the literature. For example,
Hönicke (1983) compared the catalytic effect of different commercial and anodized aluminas, observing a high activity for the latter in the dehydration of 2-propanol. He attributed this behavior to the presence of acid sites due to the incorporation of anions and water during the anodizing
process.
The acidity value obtained in this work (0.0115 meq
g-1) is in agreement with that reported in the literature
(0.013 meq g-1) (Benesi, 1963), which indicated the degree
of certainty reached with the technique used to determine the total acidity of the samples.
It is notable that the aluminum anodizing process not
only allows for the formation of much more acid surfaces than the available commercial alumina powders, but it also exhibits a flexibility that can produce ad hoc characteristics in terms of morphology and also of the surface acidity
obtained.
CONCLUSIONS
The results obtained showed that anodization time,
temperature and concentration were the main variables that
determined the surface acidic properties of the sample, and to a lesser extent voltage.
Acidity increased with increasing concentration of the electrolyte, while the rest of the variables had the opposite effect. The incorporation of ions from the electrolyte used in the anodizing process to the alumina layer (along with
the morphological changes)would be the main contribution
to the observed surface acidity.
By increasing the anodizing temperature, a smaller amount of anions is incorporated to the layer in formation, at the same time as the specific surface area increases, producing a decrease in surface acidity. Varying the anodization time produces an increase both in surface area and in the amount of oxide generated, whereas the amount of incorporated anions remains virtually constant, generating a decrease in the surface acidity of the anodic alumina film. On the other hand, the increase in electrolyte concentration is the main factor contributing to the larger incorporation of anions during the growth of the oxide film, and to a lesser extent, it also produces an increase in the specific surface area. Both effects result in the observed increase in surface acidity.
The strength of the acid sites was very weak in all the cases, in agreement with the initial potential value observed.
As for the quantification of the sites, both methods used gave virtually equivalent results, indicating the validity of
the tests.
The results obtained provide a novel tool for the selection of catalytic supports, adding to previous research based on the morphology of alumina layers. It is well known that the surface properties of catalyst supports influence the activity, selectivity and stability of industrial catalysts. Thus, these results would allow one to optimize the design and synthesis of catalytic substrates with the desired properties, as well as save energy and natural resources. The application of an aluminum substrate would make more affordable the use of metallic monoliths due to
its lower cost compared toother metallic substrate (such as
Fecralloy©).
NOTATION
A: Acidity (Response Variable), meq m-2.
C: Concentration, M. T: Temperature, K. t: Time, min. V: Voltage, V.
ACKNOWLEDGEMENTS
Influence of the Anodizing Process Variables on the Acidic Properties of Anodic Alumina Films 1053
Nacional de Investigaciones Científicas y Técnicas (National Council for Scientific and Technological Research, CONICET) for the financial support.
REFERENCES
Adair, J.H., Casey, J.A., Venigalla, S., Handbook on Characterization
for the Solid-Solution Interface. The American Ceramic Society, Ohio(1993).
Benesi, H.A., Acidity of catalyst surfaces. II. Amine titration using Hammett indicators. J. Phys. Chem., 61, 970 (1957).
Benesi, H.A., Determination of proton acidity of solid catalysts by chromatographic adsorption of sterically hindered amines,J.
Catal.,28, 176 (1973).
Burgos, N., Paulis, M., Montes, M., Preparation of Al2O3/Al
monoliths by anodization of aluminum as structured catalytic
supports. J. Mater. Chem., 13, 1458 (2003).
Cid, R., Pecchi, G., Potentiometric method for determining the number and relative strength of acid sites in colored catalysts.
Appl. Catal., 14, 15 (1985).
Cybuslki, A., Moulijn, J.A., Monoliths in heterogeneous catalysis. Cat. Rev.-Sci.Eng., 36, 179 (1994).
Diggle, J.W., Downie, T.C., Goulding, C.W., Anodic oxide films on aluminum. Chem. Rev., 69, 365 (1969).
Fedotiev, N.P., Grilijes, S.P., Electropulido y anodización de metales. Gustavo Gili S.A., Barcelona (1972).
Ginsberg, H., Wefers, K., Zurstruktur der anodischendeckschichtenaufaluminiumoberflächen. Metall,17,
202 (1963).
Hayes, R.E., Kolaczkowski, S.T., Thomas, W.J., Finite element model for a catalytic monolith reactor. Comput.Chem. Eng.,
16, 645 (1992).
Heck, R.M., Gulati, S., Farrauto, R.J., The application of monoliths for gas phase catalytic reactions. Chem. Eng. J., 82, 149 (2001). Hönicke, D., Formation of an Al2O3-coated catalyst with a metallic
core by anodic oxidation of aluminium. Appl. Catal., 5, 179
(1983).
Hönicke, D., Comparative investigations of the catalytic properties of an anodic Al2O3-coated catalyst and of α- and γ-Al2O3 bulk
catalysts. Appl. Catal., 5, 199 (1983).
Lisboa, J.S., Santos, D.C.R.M., Passos, F.B., Noronha, F., Influence of the addition of promoters to steam reforming catalysts. Catal. Today, 101, 15 (2005).
Lizarbe Ruiz, L., Teoría y Práctica de la Lucha Contrala Corrosión. Grafimad S. A., Madrid (1984).
Losic, D., Santos, A., Nanoporous Alumina: Fabrication, Structure, Properties and Applications. Springer Series in Materials Science, Cham (2015).
Mason, R.B., Factors affecting the formation of anodic oxide coating in sulfuric acid electrolytes. J. Electrochem. Soc., 102,
671 (1955).
Mata-Zamora, M.E., Saniger, J.M., Thermal evolution of porous anodic aluminas: a comparative study. Rev. Mex. Fis., 51, 502
(2005).
Nakamoto, K., Infrared and Raman Spectra of Inorganic and Coordination Compounds. John Wiley & Sons, New Jersey
(2009).
Nourbakhsh, N., Tsotsis, T.T., Webster, I.A., Model planar alumina
catalyst preparation and aging under hydrotreating conditions,
Appl. Catal., 50, 65 (1989).
Nourbakhsh, N., Smith, B.J., Webster, I.A., Wei, J., Tsotsis,
T.T., Metal deposition in porous anodic alumina films under hydrotreating conditions. J. Catal., 127, 178 (1991).
Ono, S., Saito, M., Asoh, H., Self-ordering of anodic porous alumina formed in organic acid electrolytes.Electrochim. Acta,
51, 827 (2005).
Patermarakis, G., Lenas, P., Karavassilis, Ch., Papayiannis, G., Kinetics of growth of porous anodic Al2O3 films on A1 metal. Electrochim. Acta, 36, 709 (1991).
Patermarakis, G., Kerassovitou,P., Study on the mechanism of oxide hydration and oxide pore closure during hydrothermal treatment of porous anodic Al2O3 films. Electrochim. Acta, 37, 125 (1992).
Patermarakis, G., Papandreadis, N., Study on the kinetics of growth of porous anodic Al2O3 films on Al metal. Electrochim. Acta, 38, 2351 (1993).
Patermarakis, G., Pavlidou, C., Catalysis over porous anodic alumina catalysts. J. Catal., 147, 140 (1994).
Patermarakis, G., Nicolopoulos, N., Catalysis over porous anodic alumina film catalysts with different pore surface
concentrations. J. Catal., 187, 311 (1999).
Patermarakis, G., Moussoutzanis, K., Chandrinos, J., Preparation
of ultra-active alumina of designed porous structure by successive hydrothermal and thermal treatments of porous
anodic Al2O3 films. Appl. Catal. A: General, 180, 345 (1999). Pizzio, L.,Vázquez, P., Cáceres, C., Blanco, M., Tungstophosphoric
and molybdophosphoric acids supported on zirconia as esterification catalysts. Catal. Lett., 77, 233 (2001).
Sánchez-Sánchez, M.C., Navarro, R.M., Fierro, J.L.G., Ethanol steam reforming over Ni/MxOy–Al2O3 (M=Ce, La, Zr and Mg) catalysts: Influence of support on the hydrogen production. Int. J. Hydrogen Energy, 32, 1462 (2007).
Tadd, A.R., Gould, B.D., Schwank, J.H., Packed bed versus microreactor performance in autothermal reforming of isooctane. Catal. Today, 110, 68 (2005).
Takahashi, H., Fujimoto, K., Konno, H., Nagayama, M., Distribution of anions and protons in oxide films formed anodically on
aluminum in a phosphate solution. J. Electrochem. Soc.,131, 1856 (1984).
Weitkamp, J., Sing, K.S.W., Schüth, F., Handbook of porous solids. Wiley-VCH, Weinheim (2002).
Williams, J.L., Monolith structures, materials, properties and uses.
Catal. Today, 69, 3 (2001).
Wood, G.C., Marron, J.J., Lambert, B.W., Electron-probe
microanalysis of anodic oxide films on aluminium alloys.
Nature, 199, 239 (1963).
Wu, X., Weng, D., Xu, L., Li, H.,Structure and performance of γ-alumina washcoat deposited by plasma spraying. Surf. Coat.
Technol., 145, 226 (2001).
Yu, X., Tu, S.T., Wang, Z., Qi, Y., Development of a microchannel reactor concerning steam reforming of methanol. Chem. Eng.
J., 116, 123 (2006).
Zhao, S., Zhang, J., Weng, D., Wu, X., A method to form well-adhered γ-Al2O3 layers on FeCrAl metallic supports. Surf.

![Table 3. Characterization of the obtained surfaces. Test # Al 2 O 3 [g m -2 ]* BET area [m2 g-1] Acidity [meq m-2 ]** 1 6.3 19.4 0.0292 2 24.3 26.4 0.0132 3 30.9 9.5 0.0324 4 50.5 23.6 0.0052 5 34.3 23.0 0.0094 6 42.9 39.8 0.0065 7 42.5 21.4 0.0104 8 60.4](https://thumb-eu.123doks.com/thumbv2/123dok_br/16318145.718995/4.918.99.823.120.603/table-characterization-obtained-surfaces-test-bet-area-acidity.webp)