Vanessa Castro Figueiredo1, Fabio Moreira da Silva2, Gabriel Araújo e Silva Ferraz3, Marcelo Silva de Oliveira4, Sthéfany Airane dos Santos5
(Received: January 31, 2018; accepted: April 09, 2018)
ABSTRACT: Precision agriculture is based on a set of techniques that explore the spatial variability of properties related to a determined area. The aim of this study was to develop and test a methodology to evaluate the quality of grid sampling. The experiment was performed in three areas of 112, 50 and 26 ha, in coffee plantations (Coffea arabica ) with cultivar Catuai 144, in the Três Pontas Farm, located in Presidente Olegário, MG, Brazil, in 2014 and 2015. A total of 224, 100, and 52 georeferenced points (2.0 points/ha) were plotted in the areas regarding the soil chemical properties, respectively: phosphorus, potassium, calcium and magnesium. For the application methodology the standardized accuracy index (SAI), the standardized precision index (SPI) and the standardized optimal grid indicator (SOGI) were developed and tested. From grid 1 (2 points/ha), another three sampling grids (1.0, 0.7 and 0.5 point/ha) were adopted. The indexes were important to analyze the grid quality, whereas the SOGI allowed selecting the grid that best represented the properties.
Index terms: Precision agriculture, geostatistics, grids, soil fertility.
DESENVOLVIMENTO DE UMA METODOLOGIA PARA DETERMINAÇÃO DA MELHOR MALHA AMOSTRAL EM CAFEICULTURA DE PRECISÃO
RESUMO: A agricultura de precisão baseia num conjunto de técnicas que explora a variabilidade espacial dos atributos de uma área. O objetivo deste trabalho foi desenvolver e testar uma metodologia para avaliar a qualidade de malhas amostrais. O experimento foi desenvolvido nos anos de 2014 e 2015 na fazenda Três Pontas, Presidente Olegário/MG, em três áreas de 112, 50 e 26 ha, todas de lavoura de cafeeiro (Coffea arabica ) cultivar Catuai 144. Demarcaram-se nas áreas 224, 100 e 52 pontos georreferenciados respectivamente (2,0 pontos/ha), os atributos químicos do solo testados: fósforo, potássio, cálcio e magnésio. Para aplicação da metodologia foi desenvolvido e testado o índice de exatidão padronizado (IEP), índice de precisão paradronizado (IPP) e o indicador de malha ótima padronizado (IMOP). A partir da malha 1 (2 pontos/ha) foram adotadas mais 3 malhas amostrais (1,0; 0,7 e 0,5 ponto/ha). Os índices mostraram importantes para analisar a qualidade das malhas e o IMOP permitiu a escolha da malha que melhor representou os atributos.
Termos para indexação: Agricultura de precisão, geoestatistica, grids, fertilidade do solo.
1 INTRODUCTION
Coffee is one of the main agricultural products of Brazilian agribusiness. Because it is an activity of great importance for the Brazilian trade balance, there is a need to seek the deep knowledge of all the productive processes involved from planting to harvesting (FERRAZ et al., 2012b).
The coffee growers are in a continuing search for technologies that aid in the management and improve the production of their crop, adapting to the market demands.
Precision agriculture comes as a tool that contributes to cost savings. For Rodrigues Junior et al. (2011), precision agriculture might bring countless benefits to the coffee growing, since it has a high income per area and the main parameter is bean quality. According to Ferraz (2012),
1Empresa de Pesquisa Agropecuária de Minas Gerais/EPAMIG SUL - Campo Experimental de Três Pontas/CETP - Rodovia Três
Pontas/Santana da Vargem, Km 06 Zona Rural - Cx. P. Postal: 91 - 37.190-000 - Três Pontas - MG - vcfigueiredo.agro@gmailcom
2,3,5Universidade Federal de Lavras/UFLA - Departamento de Engenharia/DEG - Cx. P. 3037 - 37.200-000 - Lavras - MG
[email protected], [email protected], [email protected]
4Universidade Federal de Lavras/UFLA - Departamento de Estatística/DEX - Cx. P. 3037 - 37.200-000 - Lavras - MG -
precision agriculture in coffee growing has been referred as “precision coffee growing”.
Ferraz et al. (2012) define it as a set of techniques and technologies capable of assisting the coffee farmer to manage the crop, based on the spatial variability of soil and plant properties, in order to maximize profitability, increase efficiency of fertilization, spraying and harvesting, thus increasing productivity and the product’s final quality.
The understanding on spatial variability in the crop requires a greater amount of information, which can be obtained from sampling operations (SOUZA; MARQUES JÚNIOR; PEREIRA, 2004). These samplings, mainly referring to grid sampling, still generate discussions among scientists, technicians and producers, which do not yet have well-established standards for coffee growing.
In order to reduce costs with the collection of soil samples in 2015, in the area of 112 ha, the sampling was done from grid 2, referring to one point per hectare.
Semivariograms are used in order to analyze the spatial dependence of properties under study. Semivariance is classically estimated by equation 1:
where, N (h) is the number of experimental pairs of observations Z(xi) and Z (xi + h) separated by a distance h. The semivariogram is represented by the graphγˆ h( ) versus h. From the fit of a mathematical model to the calculated values of
) ( ˆ h
γ , the coefficients of the theoretical model were estimated for the semivariogram called nugget effect (C0); sill (C0+C1); and range (a), as described by Bachmaier and Backers (2011).
The weighted least squares method and the spherical, exponential and Gaussian models were used according to the best fit for each property and for tested grids. With the semivariograms ready, ordinary kriging and kriging validation procedures were performed to assess the interpolation quality.
The software used for geostatistical analysis and map generation was ArcGIS 10. The geostatistical index proposed by Seidel and Oliveira (2014) was used to measure the spatial dependence. Where, the spatial dependence is weak whether ratio is lower than 12.5%; moderate, between 12.5% and 25%, and strong spatial dependence when the ratio is greater than 25%. This index can be used for the spherical, exponential and Gaussian semivariogram models, which is expressed by equation 2:
where MI is the model index; C0, the nugget effect; C1, the contribution; a, the practical range; and q.MD, the value corresponding to the fraction (q) reached at maximum distance (MD) between sampled points. Whether the ratio (a/q.MD) results in a value greater than 1, the ratio is then set to 1, so that it assumes only values between zero and 1. Moreover, the greater the MI value, the greater the spatial dependence of model.
One of the ways to evaluate the quality of estimation and fitting of semivariograms, besides other research characteristics, such as the sample According to Ferraz et al. (2017), the use
of unsatisfactory grid sizes can generate maps that do not reflect the field and thus generate wrong technical recommendations, which could result in losses to its users.
According to Nanni et al. (2011), the grid sampling used in the most diverse Brazilian cultures are around one point every two to three hectares and, in some cultures, up to one point is used every four hectares. In relation to the coffee crop, few studies refer to the adequate size of grid sampling, thus, there is a great need for research with this purpose.
The aim in this study was to develop and test a methodology to evaluate and compare the quality of different grid samples in different size areas and define the one that best characterizes the spatial variability for each tested property.
2 MATERIAL AND METHODS
The experiment was performed in three different areas (112 ha, 50 ha and 26 ha) at Três Pontas Farm, Presidente Olegário, MG, Brazil, in 2014 and 2015, all based on wet process (Coffea arabica L.) with cultivar Catuaí IAC 144, planted in December 2005 (11-year crop), December 2011 (5 years) and December 2004 (12 years), respectively, spacing of 4.0 m between rows and 0.5 m between plants, totaling 5,000 plants.ha-1.
They were demarcated in the study area, using a GPS signal receiver equipment, 224, 100 and 52 georeferenced sample points (2.0 points/ ha), respectively. From grid 1, another three grid samples were adopted (1.0, 0.7 and 0.5 point/ha).
Using a GPS signal receiver, the demarcated points were found and then the samples collection was made. The grid 1 has the greater number of georeferenced sample points, with 2.0 points/ha, the grid 2 has 1.0 point/ha, the grid 3 refers to 0.7 point/ha and the grid 4 is composed by 0.5 point/ha.
Soil fertility data were collected at every georeferenced point in the area. Each sampling point corresponded to four plants, being that the collection was performed in July 2014 and July 2015 using a quadricycle, by removing subsamples in the projection of coffee canopy at depth from 0 to 20 cm. The samples were sent to the Brazilian Laboratory of Agricultural Analysis (LABRAS), in Monte Carmelo, MG. The chemical attributes of the soil analyzed were Phosphorus, Potassium, Calcium and Magnesium.
(1)
mesh, is through validation. It makes possible to extract some useful values for the observation of errors presented by each grid, such as the mean of standard error (MSE) (Equation 3), which should have the value closer to zero, and the standard deviation of standard error (SDSE) (Equation 4), which should be as lower as possible.
Where n is the number of data; Zˆ
( )
xi is a value predicted or estimated by ordinary kriging at point xi, without considering the observation Z(xi); Z(xi) is the value observed at point xi; andis the standard deviation.
Based on these values, a methodology was developed and tested covering as main characteristic the use of standard errors, which can be applied in several circumstances, such as in the comparison between grids from different cultures, representing a great differential in relation to other methodologies developed previously.
Based on the MSE and SDSE values obtained it was developed and tested the Standardized Accuracy Index (SAI) and the Standardized Precision Index (SPI). These indexes make possible to identify the best grid for areas up to 100 ha. It was used attributes of the soil to test the indexes, being evaluated Phosphorus (P), Potassium (K), Calcium (Ca) and Magnesium (Mg); which were sampled in the years 2014 and 2015.
The value of the MSE, obtained by validation, reflects the accuracy of grid sampling. The SAI concept (Equation 5) was proposed and developed to determine an accuracy component that would allow comparing among grids.
where M(SE) is the value of the mean of standard error, in module, of the grid to be compared and mM(SE) is the greatest value of the mean of standard error, in module, among all analyzed grids.
The value of the SDSE, obtained by validation, reflects the grid accuracy. Moreover, the SPI was developed and proposed to compare the accuracy component of the grid among the different studied grids (Equation 6).
where SDSE is the value of the standard deviation of standard error of the studied grid and mSDSE is the greatest value of the standard deviation of standard error presented by the group of analyzed grids. The SAI and SPI values range from zero to one, and the closer to one, the more accurate/precise is the grid sample, while the closer to zero, the more inaccurate/imprecise is the grid sample.
The SOGI was developed and tested in order to choose the best grid among those under study, taking into account the weighting between the standardized accuracy and prediction indices (Equation 7).
In the equation it is calculated a proportion between SAI and SPI indexes, since both accuracy and precision are important for the grid quality index. As the two indicators (accuracy and precision) were considered equally important, it was given equal weight to both, that is, 50% for each one.
The SOGI ranges from zero to one and the closer to one (or 100%), the better the grid (more accurate and more precise), while the closer to zero (0%), the worse (the more inaccurate and imprecise) is the grid.
3 RESULTS AND DISCUSSION
Cherubin et al. (2015) studied the phosphorus (P) property and observed that the increase in the number of collected samples (n), provided by smaller grid samples, makes it possible to identify sites in the area with extreme P levels that, if not corrected, might result in crop restriction zones.
Carvalho (2016) studied the optimal sampling density for precise coffee growing in an area of 22 ha and found that the grid with 2.0 points/ha were the most suitable for productivity and soil fertility of coffee.
By evaluating grid samples for an area of 22 ha, Ferraz et al.(2017) applied another (3)
(4)
(5)
(6)
methodology and found the 3.0 points per hectare as the most suitable for the soil fertility variables Phosphorus (P), remaining Phosphorus (P-rem), Potassium (K), and changeability of calcium at pH 7.0 (T). The methodology proposed by Ferraz et al. (2017) encompasses the standard error of the data and was studied for smaller areas, up to 22 ha, while the methodology of this work is based on standardized errors and it was studied in larger areas, up to 100 ha. Moreover, the great difference between the two methodologies is that the one used in this work can be applied in study of different cultures, differing from the one applied by Ferraz which can only be used for coffee cultivation.
Comparative studies were also performed to evaluate grid samples for different variables. Cherubin et al. (2014), Nanni et al. (2011) and Ragagnin, Sena Júnior and Silveira Neto (2010) recommend the use of a sampling with more points per hectare.
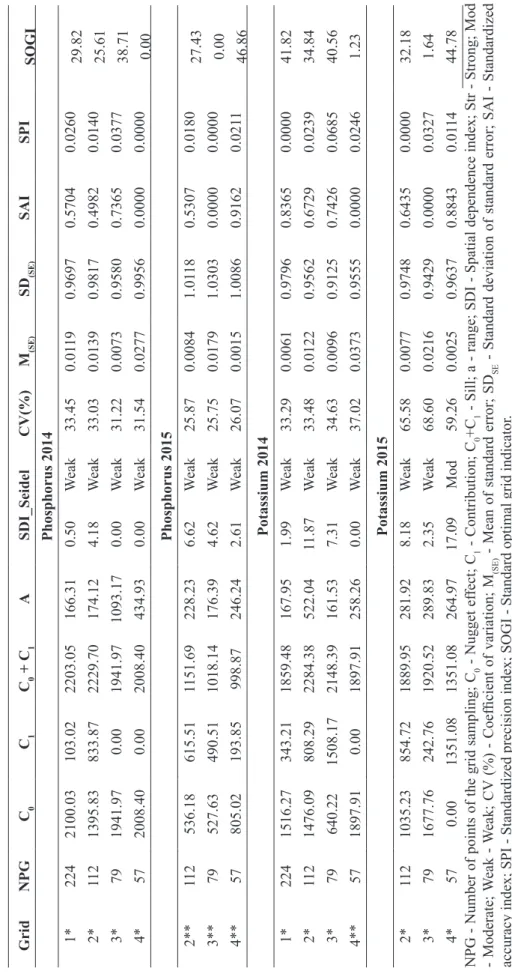
Table 1 presents the parameters estimated by the semivariogram fitted by the weighted least squares method for the properties Phosphorus (P) and Potassium (K) in the years 2014 and 2015 in an area of 112 ha. For the variable P, in 2014, the geostatistical index proposed by Seidel and Oliveira (2014) showed values considered as weak, since they had a percentage lower than 12.5% in all grid samples. The SOGI relates the SAI and SPI indices, ranging from 0 to 100%, indicating that the best grid for Phosphorus was the grid 3 in the year 2014. For the parameters estimated by the semivariogram fitted by the weighted least squares method and by the exponential model of P in 2015, the spatial dependence index (SDI) showed weak spatial dependence for all grids, and the best grid sample in the year 2015 for P was the grid 4, according to SOGI.
For the parameters estimated by the semivariogram fitted by the weighted least squares method and by the spherical and exponential model for the property Potassium (K) in 2014, it is observed that the geostatistical index is presented as weak for all grid samples, i.e., a spatial dependence lower than 12.5%. In contrast, grids 1 and 3 showed values close to 40% for SOGI. The parameters estimated by the semivariogram fitted by the weighted least squares method and by the spherical model for the Potassium variable, for the year 2015. The IDE was weak for grid samples 2 and 3, and moderate for grid 4. Analyzing all the grid samples, the grid 4 showed the most indicated value for the SOGI, with 44%.
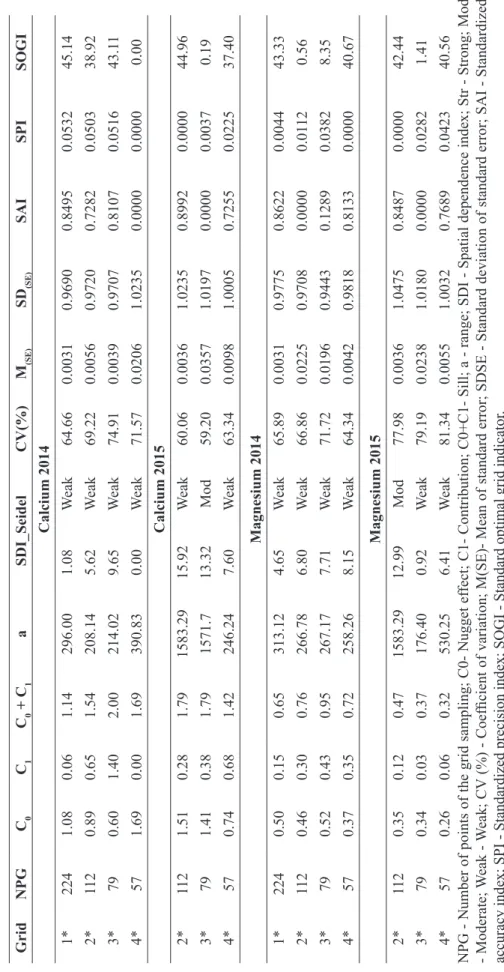
Table 2 presents the parameters estimated by the semivariogram fitted by the weighted least squares method for the properties calcium (Ca) and Magnesium (Mg) in the years 2014 and 2015 in an area of 112 ha.
For the property Calcium (Ca), the geostatistical index was weak for most of the grids fitted by the weighted least squares method and by the spherical model for 2014 and 2015, and only the grid 3 of the year 2015 was moderate, according to the index. The SOGI showed values of 45.14% in grid 1 and 43.11% in grid 3 for 2014 and 44.96% in grid 2 in the year 2015, being the best values among the grid samples. The parameters estimated by the weighted least squares method and the spherical model for the variable Magnesium (Mg) in the years 2014 and 2015, presented the geostatistical index as weak and moderate for grid samples in both years, respectively. The SOGI presented values of 43.33% for grid 1 and 40.7% for grid 4 in 2014. For the year 2015 the values presented for grids 1 and 4 were of 42.44% and 40.56% respectivelywhich are the closest to 100% for both years.
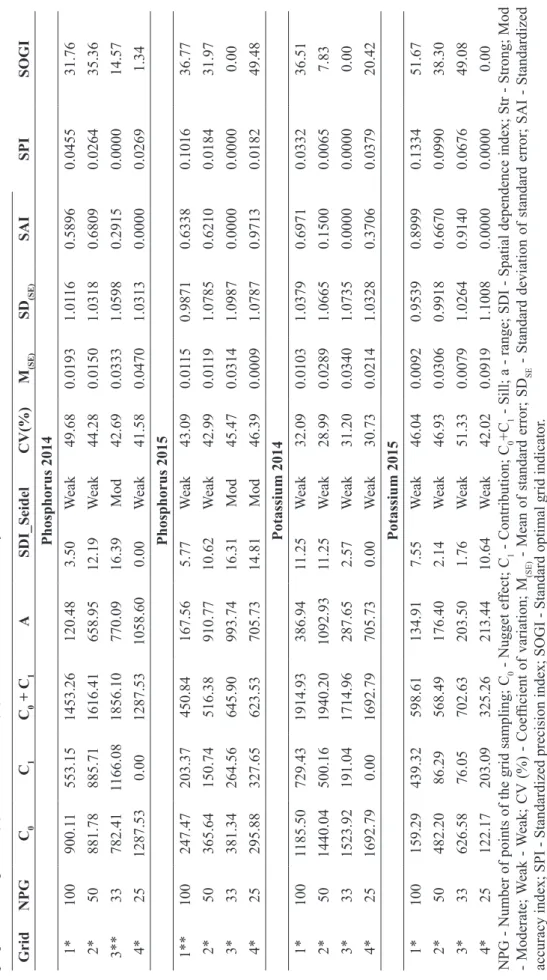
Table 3 presents the parameters estimated by the semivariogram fitted by the weighted least squares method for the properties Phosphorus (P) and Potassium (K) in the years 2014 and 2015, in an area of 50 ha.
For the variable P, in 2014, the geostatistical index presented values considered as moderate for grid 3 and weak for grids 1, 2 and 4, which had percentage lower than 12.5%. Through the SOGI, it was observed that grid 2 was the best grid for Phosphorus in 2014. For the parameters estimated by the semivariogram fitted by the weighted least squares method and by the exponential model of the P in 2015, the SDI showed weak spatial dependence for grids 1 and 2 and moderate for grids 3 and 4. According to SOGI, the grid 4 was the best grid sample for Phosphorus in the year 2015, with 49.48%.
For the property Potassium (K), in the year 2014, the SDI was weak for all grid samples and, according to the SOGI classification, the best grid sample was grid 1, which showed an index value of 36.51%. For the year 2015, still for the variable K, the SDI was weak for all grids, and the greatest SOGI was 51.67% for the grid 1.
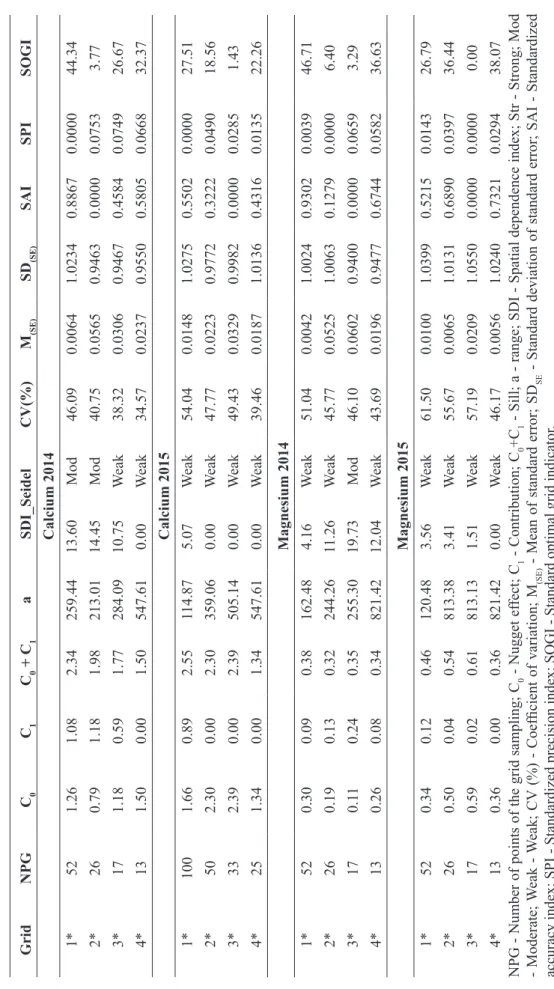
Table 4 presents the parameters estimated by the semivariogram fitted by the weighted least squares method for the properties calcium (Ca) and Magnesium (Mg) in the years 2014 and 2015 in an area of 50 ha.
TABLE 1 - Parameters estim ated by the semivariogram fitted by the weighted least squares method and by the spherical (*) and exponential (**) model for the
properties Phosphorus (P) and Potassium (K), in the area of 1
12 ha in the years 2014 and 2015.
Grid NPG C0 C1 C0 + C 1 A SDI_Seidel CV(%) M(SE) SD (SE) SAI SPI SOGI Phosphorus 2014 1* 224 2100.03 103.02 2203.05 166.31 0.50 W eak 33.45 0.01 19 0.9697 0.5704 0.0260 29.82 2* 11 2 1395.83 833.87 2229.70 174.12 4.18 W eak 33.03 0.0139 0.9817 0.4982 0.0140 25.61 3* 79 1941.97 0.00 1941.97 1093.17 0.00 W eak 31.22 0.0073 0.9580 0.7365 0.0377 38.71 4* 57 2008.40 0.00 2008.40 434.93 0.00 W eak 31.54 0.0277 0.9956 0.0000 0.0000 0.00 Phosphorus 2015 2** 11 2 536.18 615.51 1151.69 228.23 6.62 W eak 25.87 0.0084 1.01 18 0.5307 0.0180 27.43 3** 79 527.63 490.51 1018.14 176.39 4.62 W eak 25.75 0.0179 1.0303 0.0000 0.0000 0.00 4** 57 805.02 193.85 998.87 246.24 2.61 W eak 26.07 0.0015 1.0086 0.9162 0.021 1 46.86 Potassium 2014 1* 224 1516.27 343.21 1859.48 167.95 1.99 W eak 33.29 0.0061 0.9796 0.8365 0.0000 41.82 2* 11 2 1476.09 808.29 2284.38 522.04 11.87 W eak 33.48 0.0122 0.9562 0.6729 0.0239 34.84 3* 79 640.22 1508.17 2148.39 161.53 7.31 W eak 34.63 0.0096 0.9125 0.7426 0.0685 40.56 4** 57 1897.91 0.00 1897.91 258.26 0.00 W eak 37.02 0.0373 0.9555 0.0000 0.0246 1.23 Potassium 2015 2* 11 2 1035.23 854.72 1889.95 281.92 8.18 W eak 65.58 0.0077 0.9748 0.6435 0.0000 32.18 3* 79 1677.76 242.76 1920.52 289.83 2.35 W eak 68.60 0.0216 0.9429 0.0000 0.0327 1.64 4* 57 0.00 1351.08 1351.08 264.97 17.09 Mod 59.26 0.0025 0.9637 0.8843 0.01 14 44.78 NPG - Number of points of the grid sampling; C0 - Nugget ef fect; C 1 - Contribution; C0 +C 1 - Sill; a - range; SDI - Spatial dependence index; Str - Strong; Mod - Moderate; W eak - W eak; CV (%) - Coefficient of variation; M(SE) - Mean of standard error; SD SE - Standard deviation of standard error; SAI - Standardized
accuracy index; SPI - Standardized precision index; SOGI - Standard optimal grid indicator
TABLE 2 - Parameters estim ated by the semivariogram fitted by the weighte d least squares method by the spherical model (*) for the properties Calcium (Ca) and
Magnesium (Mg) in the area of 1
12 ha in the years 2014 and 2015.
Grid NPG C0 C1 C0 + C 1 a SDI_Seidel CV(%) M(SE) SD (SE) SAI SPI SOGI Calcium 2014 1* 224 1.08 0.06 1.14 296.00 1.08 W eak 64.66 0.0031 0.9690 0.8495 0.0532 45.14 2* 11 2 0.89 0.65 1.54 208.14 5.62 W eak 69.22 0.0056 0.9720 0.7282 0.0503 38.92 3* 79 0.60 1.40 2.00 214.02 9.65 W eak 74.91 0.0039 0.9707 0.8107 0.0516 43.1 1 4* 57 1.69 0.00 1.69 390.83 0.00 W eak 71.57 0.0206 1.0235 0.0000 0.0000 0.00 Calcium 2015 2* 11 2 1.51 0.28 1.79 1583.29 15.92 W eak 60.06 0.0036 1.0235 0.8992 0.0000 44.96 3* 79 1.41 0.38 1.79 1571.7 13.32 Mod 59.20 0.0357 1.0197 0.0000 0.0037 0.19 4* 57 0.74 0.68 1.42 246.24 7.60 W eak 63.34 0.0098 1.0005 0.7255 0.0225 37.40 Magnesium 2014 1* 224 0.50 0.15 0.65 313.12 4.65 W eak 65.89 0.0031 0.9775 0.8622 0.0044 43.33 2* 11 2 0.46 0.30 0.76 266.78 6.80 W eak 66.86 0.0225 0.9708 0.0000 0.01 12 0.56 3* 79 0.52 0.43 0.95 267.17 7.71 W eak 71.72 0.0196 0.9443 0.1289 0.0382 8.35 4* 57 0.37 0.35 0.72 258.26 8.15 W eak 64.34 0.0042 0.9818 0.8133 0.0000 40.67 Magnesium 2015 2* 11 2 0.35 0.12 0.47 1583.29 12.99 Mod 77.98 0.0036 1.0475 0.8487 0.0000 42.44 3* 79 0.34 0.03 0.37 176.40 0.92 W eak 79.19 0.0238 1.0180 0.0000 0.0282 1.41 4* 57 0.26 0.06 0.32 530.25 6.41 W eak 81.34 0.0055 1.0032 0.7689 0.0423 40.56
NPG - Number of points of the grid sampling;
C0- Nugget ef fect; C1- Contribution; C0+C1- Sill; a - range; SDI - Spatial dependence index; Str - Strong; Mod - Moderate; W eak - W eak; CV (%) - Coefficient of variation; M(SE)- Mean of standard error; SDSE - Standard deviation of standard error; SAI - Standardized
accuracy index; SPI - Standardized precision index; SOGI - Standard optimal grid indicator
TABLE 3 - Parameters estim ated by the semivariogram fitted by the weighted least squares method and by the spherical (*) and exponential (**) model for the
properties Phosphorus (P) and Potassium (K) in the area of 50 ha in the years 2014 and 2015. Grid
NPG C0 C1 C0 + C 1 A SDI_Seidel CV(%) M(SE) SD(SE) SAI SPI SOGI Phosphorus 2014 1* 100 900.1 1 553.15 1453.26 120.48 3.50 W eak 49.68 0.0193 1.01 16 0.5896 0.0455 31.76 2* 50 881.78 885.71 1616.41 658.95 12.19 W eak 44.28 0.0150 1.0318 0.6809 0.0264 35.36 3** 33 782.41 1166.08 1856.10 770.09 16.39 Mod 42.69 0.0333 1.0598 0.2915 0.0000 14.57 4* 25 1287.53 0.00 1287.53 1058.60 0.00 W eak 41.58 0.0470 1.0313 0.0000 0.0269 1.34 Phosphorus 2015 1** 100 247.47 203.37 450.84 167.56 5.77 W eak 43.09 0.01 15 0.9871 0.6338 0.1016 36.77 2* 50 365.64 150.74 516.38 910.77 10.62 W eak 42.99 0.01 19 1.0785 0.6210 0.0184 31.97 3* 33 381.34 264.56 645.90 993.74 16.31 Mod 45.47 0.0314 1.0987 0.0000 0.0000 0.00 4* 25 295.88 327.65 623.53 705.73 14.81 Mod 46.39 0.0009 1.0787 0.9713 0.0182 49.48 Potassium 2014 1* 100 1185.50 729.43 1914.93 386.94 11.25 W eak 32.09 0.0103 1.0379 0.6971 0.0332 36.51 2* 50 1440.04 500.16 1940.20 1092.93 11.25 W eak 28.99 0.0289 1.0665 0.1500 0.0065 7.83 3* 33 1523.92 191.04 1714.96 287.65 2.57 W eak 31.20 0.0340 1.0735 0.0000 0.0000 0.00 4* 25 1692.79 0.00 1692.79 705.73 0.00 W eak 30.73 0.0214 1.0328 0.3706 0.0379 20.42 Potassium 2015 1* 100 159.29 439.32 598.61 134.91 7.55 W eak 46.04 0.0092 0.9539 0.8999 0.1334 51.67 2* 50 482.20 86.29 568.49 176.40 2.14 W eak 46.93 0.0306 0.9918 0.6670 0.0990 38.30 3* 33 626.58 76.05 702.63 203.50 1.76 W eak 51.33 0.0079 1.0264 0.9140 0.0676 49.08 4* 25 122.17 203.09 325.26 213.44 10.64 W eak 42.02 0.0919 1.1008 0.0000 0.0000 0.00 NPG - Number of points of the grid sampling; C0 - Nugget ef fect; C 1 - Contribution; C0 +C 1 - Sill; a - range; SDI - Spatial dependence index; Str - Strong; Mod - Moderate; W eak - W eak; CV (%) - Coefficient of variation; M(SE) - Mean of standard error; SD SE - Standard deviation of standard error; SAI - Standardized
accuracy index; SPI - Standardized precision index; SOGI - Standard optimal grid indicator
TABLE 4 - Parameters estim ated by the semivariogram fitted by the weighted least squares method by the spherical (*) and Gaussian model (***) for the
properties Calcium (Ca) and Magnesium (Mg) in the area of 50 ha in the years 2014 and 2015.
Grid NPG C0 C1 C0 + C 1 A SDI_Seidel CV(%) M(SE) SD(SE) SAI SPI SOGI Calcium 2014 1* 100 1.53 0.17 1.70 1137.16 4.40 W eak 42.00 0.0068 0.9932 0.5310 0.0259 27.85 2* 50 1.66 0.18 1.83 1092.93 4.18 W eak 38.95 0.0057 1.0196 0.6069 0.0000 30.34 3* 33 1.78 0.34 2.13 993.74 6.40 W eak 39.22 0.0066 0.9820 0.5448 0.0369 29.09 4* 25 1.82 0.17 2.00 1058.60 3.66 W eak 40.92 0.0145 0.9882 0.0000 0.0308 1.54 Calcium 2015 1* 100 0.96 1.55 2.51 154.07 7.26 W eak 47.80 0.0009 0.9715 0.9833 0.0506 51.70 2* 50 0.83 1.44 2.27 197.23 9.99 W eak 46.02 0.0182 1.0074 0.6630 0.0155 33.93 3* 33 2.01 0.01 2.02 229.56 0.09 W eak 43.39 0.0540 0.9265 0.0000 0.0946 4.73 4* 25 1.80 0.00 1.80 372.15 0.00 W eak 46.07 0.0134 1.0233 0.7519 0.0000 37.59 Magnesium 2014 1* 100 0.31 0.06 0.37 159.02 2.00 W eak 73.09 0.0158 0.9952 0.5798 0.1017 34.08 2* 50 0.32 0.07 0.39 235.97 3.17 W eak 71.90 0.0047 1.0246 0.8750 0.0752 47.51 3* 33 0.13 0.30 0.44 224.47 12.49 W eak 71.57 0.0376 1.0024 0.0000 0.0952 4.76 4*** 25 0.05 0.49 0.54 223.86 21.79 Mod 76.12 0.0131 1.1079 0.6516 0.0000 32.58 Magnesium 2015 1* 100 0.25 0.18 0.43 161.41 5.16 W eak 67.64 0.0122 0.9656 0.8082 0.0724 44.03 2* 50 0.25 0.16 0.41 185.00 5.77 W eak 68.77 0.0222 1.0410 0.6509 0.0000 32.55 3* 33 0.33 0.00 0.33 418.25 0.00 W eak 65.16 0.0636 1.0264 0.0000 0.0140 0.70 4* 25 0.38 0.00 0.38 1058.60 0.00 W eak 69.72 0.0103 1.0276 0.8381 0.0129 42.55 NPG - Number of points of the grid sampling; C0 - Nugget ef fect; C 1 - Contribution; C0 +C 1 - Sill; a - range; SDI - Spatial dependence index; Str - Strong; Mod - Moderate; W eak - W eak; CV (%) - Coefficient of variation; M(SE) - Mean of standard error; SD SE - Standard deviation of standard error; SAI - Standardized
accuracy index; SPI - Standardized precision index; SOGI - Standard optimal grid indicator
For the property Calcium (Ca), the geostatistical index was weak for all the grids fitted by the weighted least squares method and by the spherical model for 2014 and 2015. The SOGI showed greater values in grids 2 (2014) and 1 (2015), being 30.34% and 51.70%, respectively. For the variable Magnesium (Mg), the geostatistical index was weak for all the grids of the years 2014 and 2015, except for the grid 4 of the year 2014, where the index was moderate. The SOGI presented values of 47.51% for grid 4 in 2014, and 44.03% and 42.55% for grids 1 and 4, respectively, in the year 2015, which are the closest to 100%.
Table 5 presents the parameters estimated by the semivariogram fitted by the weighted least squares method for the properties Phosphorus (P) and Potassium (K) in the years 2014 and 2015 in an area of 26 ha.
For the property Phosphorus (P), the geostatistical index was moderate for the grid 1 and weak for the other grids in the year 2014. For the year 2015, the SDI was moderate for grids 1 and 2 and weak for grids 3 and 4. The SOGI showed values of 38.44% in grid 2 and 37.33% in grid 3 for 2014 and 32.79% in grid 3 in the year 2015, being the best values among the grid samples. For the variable Potassium (K), the
geostatistical index was moderate for grid 1 and weak for grid 2, 3, and 4, in the year 2014. For the year 2015, the SDI for K was weak for grids 1 and 3, moderate for grid 3, and strong for grid 4. The SOGI presented values of 35.90% for grid 1 in the year 2014 and 55.04% for grid 1 in the year 2015.
Table 6 presents the parameters estimated by the semivariogram fitted by the weighted least squares method for the Calcium (Ca) and Magnesium (Mg) in the years 2014 and 2015 in an area of 26 ha.
For the property Magnesium (Mg), the geostatistical index was moderate for grid 3 and weak for grid 1, 2 and 4 in the year 2014. For the year 2015, the SDI was weak for all grids. The SOGI presented values of 46.71% for grid 1 in the year 2014 and 38.07% for grid 4 in the year 2015.
Based on Table 7, the grids considered as more adequate for the area of 112 ha were grids 1 and 2, not statistically different from each other, by the Scott Knott Test, at 5% probability. Grid 1 is more recommended for areas of 50 ha and 26 ha, followed by grid 2, 4, and 3. Therefore, for precision coffee growing, based on this study conditions, it is recommended to use a grid from 2.0 to 1.0 points/ha, for areas above 100.0 ha and a grid with 2.0 points/ha for areas equal or smaller than 50.0 ha.
TABLE 5 - Parameters estim ated by the semivariogram fitted by the weighted least squares method by the spherical (*) and Gaussian model (***) for the
properties Phosphorus (P) and Potassium (K) in the area of 26 ha in the years 2014 and 2015. Grid
NPG C0 C1 C0 + C 1 A SDI_EnioSeidel CV(%) M(SE) SD (SE) SAI SPI SOGI Phosphorus 2014 1*** 52 64.92 1912.09 1977.01 112.03 16.50 Mod 39.58 0.0088 0.9526 0.4500 0.081 1 26.56 2* 26 1600.37 801.01 2401.38 525.38 9.93 W eak 42.64 0.0037 1.0367 0.7688 0.0000 38.44 3* 17 1699.97 67.69 1767.66 317.38 1.38 W eak 36.57 0.0055 0.943 0.6563 0.0904 37.33 4* 13 2084.43 804.59 2889.02 684.51 11.59 W eak 38.94 0.0160 1.0191 0.0000 0.0170 0.85 Phosphorus 2015 1* 224 0.00 1415.65 1415.65 130.66 14.80 Mod 42.81 0.0173 0.9120 0.4627 0.1095 28.61 2* 11 2 424.68 810.82 1235.50 185.00 13.75 Mod 37.64 0.0239 1.0242 0.2578 0.0000 12.89 3* 79 1159.76 0.00 1159.76 813.13 0.00 W eak 34.57 0.0138 0.9378 0.5714 0.0844 32.79 4* 57 11 18.67 0.00 11 18.67 821.42 0.00 W eak 36.43 0.0322 0.9670 0.0000 0.0558 2.79 Potassium 2014 1* 52 0.00 779.92 779.92 110.60 12.53 Mod 28.63 0.01 15 1.0145 0.6875 0.0305 35.90 2* 26 673.89 178.26 852.16 293.52 6.96 W eak 28.79 0.0140 1.0465 0.6195 0.0000 30.98 3* 17 816.07 69.38 885.46 813.13 3.61 W eak 27.77 0.0368 1.0224 0.0000 0.0230 1.15 4* 13 878.64 0.00 878.64 547.61 0.00 W eak 27.24 0.0165 0.9665 0.5516 0.0764 31.40 Potassium 2015 1* 52 95.1 1 62.41 157.52 153.23 6.88 W eak 24.95 0.0004 0.9657 0.9934 0.1074 55.04 2*** 26 39.89 119.72 159.61 183.96 15.63 Mod 23.34 0.0325 0.9925 0.4646 0.0826 27.36 3* 17 75.71 29.14 104.85 470.71 7.41 W eak 19.03 0.0080 1.0819 0.8682 0.0000 43.41 4*** 13 22.00 84.64 106.64 284.38 27.44 Str 19.17 0.0607 1.0781 0.0000 0.0035 0.18 NPG - Number of points of the grid sampling; C0 - Nugget ef fect; C 1 - Contribution; C0 +C 1 - Sill; a - range; SDI - Spatial dependence index; Str - Strong; Mod - Moderate; W eak - W eak; CV (%) - Coefficient of variation; M(SE) - Mean of standard error; SD SE - Standard deviation of standard error; SAI - Standardized
accuracy index; SPI - Standardized precision index; SOGI - Standard optimal grid indicator
TABLE 6 - Parameters estim ated by the semivariogram fitted by the weighte d least squares method by the spherical model (*) for the properties Calcium (Ca) and
Magnesium (Mg) in the area of 26 ha in the years 2014 and 2015.
Grid NPG C0 C1 C0 + C 1 a SDI_Seidel CV(%) M(SE) SD (SE) SAI SPI SOGI Calcium 2014 1* 52 1.26 1.08 2.34 259.44 13.60 Mod 46.09 0.0064 1.0234 0.8867 0.0000 44.34 2* 26 0.79 1.18 1.98 213.01 14.45 Mod 40.75 0.0565 0.9463 0.0000 0.0753 3.77 3* 17 1.18 0.59 1.77 284.09 10.75 W eak 38.32 0.0306 0.9467 0.4584 0.0749 26.67 4* 13 1.50 0.00 1.50 547.61 0.00 W eak 34.57 0.0237 0.9550 0.5805 0.0668 32.37 Calcium 2015 1* 100 1.66 0.89 2.55 114.87 5.07 W eak 54.04 0.0148 1.0275 0.5502 0.0000 27.51 2* 50 2.30 0.00 2.30 359.06 0.00 W eak 47.77 0.0223 0.9772 0.3222 0.0490 18.56 3* 33 2.39 0.00 2.39 505.14 0.00 W eak 49.43 0.0329 0.9982 0.0000 0.0285 1.43 4* 25 1.34 0.00 1.34 547.61 0.00 W eak 39.46 0.0187 1.0136 0.4316 0.0135 22.26 Magnesium 2014 1* 52 0.30 0.09 0.38 162.48 4.16 W eak 51.04 0.0042 1.0024 0.9302 0.0039 46.71 2* 26 0.19 0.13 0.32 244.26 11.26 W eak 45.77 0.0525 1.0063 0.1279 0.0000 6.40 3* 17 0.1 1 0.24 0.35 255.30 19.73 Mod 46.10 0.0602 0.9400 0.0000 0.0659 3.29 4* 13 0.26 0.08 0.34 821.42 12.04 W eak 43.69 0.0196 0.9477 0.6744 0.0582 36.63 Magnesium 2015 1* 52 0.34 0.12 0.46 120.48 3.56 W eak 61.50 0.0100 1.0399 0.5215 0.0143 26.79 2* 26 0.50 0.04 0.54 813.38 3.41 W eak 55.67 0.0065 1.0131 0.6890 0.0397 36.44 3* 17 0.59 0.02 0.61 813.13 1.51 W eak 57.19 0.0209 1.0550 0.0000 0.0000 0.00 4* 13 0.36 0.00 0.36 821.42 0.00 W eak 46.17 0.0056 1.0240 0.7321 0.0294 38.07 NPG - Number of points of the grid sampling; C0 - Nugget ef fect; C 1 - Contribution; C0 +C 1 - Sill; a - range; SDI - Spatial dependence index; Str - Strong; Mod - Moderate; W eak - W eak; CV (%) - Coefficient of variation; M(SE) - Mean of standard error; SD SE - Standard deviation of standard error; SAI - Standardized
accuracy index; SPI - Standardized precision index; SOGI - Standard optimal grid indicator
TABLE 7 - Ranking of grids as a function of the mean SOGI (%), considering soil fertility and collection seasons.
Area: Ranking Grid Number of points Mean SOGI (%)
112ha 1st 1 224 34.28 a 1st 2 112 27.43 a 2nd 4 57 20.08 b 2nd 3 79 17.32 b 50ha 1st 1 100 38.59 a 2nd 2 50 28.78 b 2nd 4 25 27.81 b 3rd 3 33 6.30 c 26ha 1st 1 52 32.58 a 2nd 2 26 22.92 b 2nd 4 13 19.68 b 2nd 3 17 16.67 b 4 CONCLUSIONS
By applying the methodology, through the SAI, SPI and SOGI, it was possible to identify the most recommended grid for the tested properties.
Based on this study conditions, it is recommended the georeferenced sampling, obeying the use of grids with 2.0 points per hectare, for precision coffee growing.
5 REFERENCES
BACHMAIER, M.; BACKERS, M. Variogram or semivariogram? variance or semivariance? Allan variance or introducing a new term? Mathematical Geosciences, Berlin, v. 43, n. 6, p. 735-740, Aug. 2011.
CARVALHO, L. C. C. Determinação da densidade amostral ótima para a geração de mapas temáticos na Cafeicultura de Precisão. 2016. 230 p. Tese (Doutorado em Engenharia Agrícola) - Universidade Federal de Lavras, Lavras, 2016.
CHERUBIN, M. R. et al. Eficiência de malhas amostrais utilizadas nacaracterização da variabilidade espacial de fósforo e potássio. Ciência Rural, Santa Maria, v. 44, n. 3, p. 425-432, Mar. 2014.
CHERUBIN, M. R. et al. Dimensão da malha amostral para caracterização da variabilidade espacial de fósforo e potássio em Latossolo Vermelho. Pesquisa Agropecuária Brasileira, Brasília, v. 50, n. 2, p. 168-177, Feb. 2015. FERRAZ, G. A. S. Cafeicultura de precisão: malhas amostrais para o mapeamento de atributos do solo, da planta e recomendações. 2012. 134 p. Tese (Doutorado em Engenharia Agrícola) - Universidade Federal de Lavras, Lavras, 2012.
FERRAZ, G. A. S. et al. Geostatistical analysis of fruit yield and detachment force in coffee. Precision Agriculture, Dordrecht, v. 13, n. 1, p. 76-89, Jan. 2012. FERRAZ, G. A. S. et al. Methodology to determine the soil sampling grid for precision agriculture in a coffee field. DYNA, Medellín, v. 84, p. 316-325, 2017. NANNI, M. R. et al. Optimum size in grid soil sampling for variable rate application in site-specific management. Scientia Agricola, Piracicaba, v. 68, n. 3, p. 386-392, May/June. 2011.
RAGAGNIN, V. A.; SENA JÙNIOR, D. G.; SILVEIRA NETO, A. N. Recomendação de calagem a taxa variada sob diferentes intensidades de amostragem. Revista Brasileira de Engenharia Agrícola e Ambiental, Campina Grande, v. 14, n. 6, June. 2010. RODRIGUUES JUNIOR, F. A. et al. Geração de zonas de manejo para a cafeicultura empregando sensor SPAD e análise foliar. Revista Brasileira de Engenharia Agrícola e Ambiental, Campina Grande, v. 15, n. 8, Aug. 2011.
SEIDEL, E. J.; OLIVEIRA, M. S. Novo índice geoestatístico para a mensuração da dependência espacial. Revista Brasileira de Ciência do Solo, Viçosa, v. 38, n. 3, p. 699-705, May/June. 2014. SOUZA, Z. M.; MARQUES JÚNIOR, J.; PEREIRA, G. T. Variabilidade espacial da estabilidade de agregados e matéria orgânica em solos de relevos diferentes. Pesquisa Agropecuária Brasileira, Brasília, v. 39, n. 5, p. 491-499, Feb. 2004.