Mauro Filipe Ramalho da Costa
Bachelor in Sciences of Physics EngineeringDecontamination and deodorization of
2,4,6-trichloroanisole on cork
Dissertation submitted in partial fulfillment of the requirements for the degree of
Master of Science in Physics Engineering
Adviser: Orlando M. N. D. Teodoro, Professor,
Decontamination and deodorization of 2,4,6-trichloroanisole on cork
Copyright © Mauro Filipe Ramalho da Costa, Faculty of Sciences and Technology, NOVA University of Lisbon.
The Faculty of Sciences and Technology and the NOVA University of Lisbon have the right, perpetual and without geographical boundaries, to file and publish this dissertation through printed copies reproduced on paper or on digital form, or by any other means known or that may be invented, and to disseminate through scientific repositories and admit its copying and distribution for non-commercial, educational or research purposes, as long as credit is given to the author and editor.
This document was created using the (pdf)LATEX processor, based in the “novathesis” template[1], developed at the Dep. Informática of FCT-NOVA [2].
Ac k n o w l e d g e m e n t s
First of all i would like to thank to the Faculty of Sciences and Technology of the NOVA University of Lisbon (FCT-UNL) for having been a place that I could call home throughout the five years of this course.
I would also like to thank to the following persons for all the teachings and support offered:
Professor Orlando, for accepting to be my adviser and for all the teachings and pa-tience, not only in this master’s thesis but also throughout the many disciplines in the course where we have met.
Nenad, for always being so receptive and for always having a suggestion regarding the many phases of our work.
Afonso and Ana for being so supportive and helpful with the technical work in Metrovac and for always being in a good mood.
Professor Jorge Silva and Professor Célia Henriques for being so helpful and for lend-ing us several materials and equipment in many of our work phases.
Professor Moutinho for his enthusiasm and curiosity in our work.
Mr. Faustino and Mr. Mesquita for lending us their workshops whenever it was needed.
My parents for doing the impossible so I could be finishing this same sentence. All my friends for still being my friends after I had to skip many dinners.
A b s t r a c t
The presence of 2,4,6-trichloroanisole (2,4,6-TCA) in cork was identified as a problem for the cork industry in the early 80’s and also considered as a potent compound towards the origin of organoleptic defects in wines. These defects are easily detected by the consumers and it only takes as little as about 5 ng/L to be detected. However, there is a certain difficulty when trying to detect such low concentration levels with mass spectrometry. Heavily contaminating the cork substrates with TCA could be a solution for this detection limitation.
By artificially contaminating the samples and by using quadrupole mass spectrom-etry (QMS) coupled with temperature-programmed desorption (TPD), we verified the presence of a TCA desorption peak in a cork substrate. We also verified that heating above a temperature of 160ºC in a high vacuum atmosphere allows the removal of this contaminant from cork substrates. A TCA quantification method that was developed with this work confirmed that the majority of the TCA was removed with the TPD experiment when heating above the TPD peak.
The main outcome of this experiment is the proposed process to remove TCA from cork stoppers by heating at temperatures close or above the TPD peak. Such process would have the goal of making cork and its derivative products free of TCA, or at least below the human detection threshold. In order to achieve this goal, it is necessary to understand how the TCA adsorption occurs, and that will be the objective and the con-tribution of this thesis work - to confirm the nature of the TCA adsorption and, most importantly, an attempt to determine which group of its molecule is effectively adsorbing onto the cork substrates. For this purpose, other substrates and compounds were chosen to be experimented due to their similarities with the constitution of cork constitution and the chemical structure of TCA, respectively. This experiment showed that cellulose does not have a relevant role in the adsorption process.
Keywords: Cork, Trichloroanisole, Adsorption, Temperature-Programmed Desorption,
R e s u m o
A presença de tricloroanisol (2,4,6-TCA) em cortiça foi identificada como um pro-blema para a indústria corticeira no início dos anos 80 e foi também considerado um potencial composto na origem de defeitos organolépticos em vinhos. Esses defeitos são facilmente detectáveis pelos consumidores sendo a sua detecção possível com uma con-centração de apenas 5 ng/L. No entanto, existe uma certa dificuldade na detecção destes niveis de concentração utilizando espectrometria de massa. Uma forte contaminação nos substratos de cortiça com TCA poderá ser uma solução para esta limitação na detecção.
Ao contaminar amostras artificialmente e usando espectrometria de massa do tipo quadrupolo (QMS) juntamente com desorção a temperatura controlada (TPD), verificou-se a preverificou-sença de um máximo de desorção de TCA num substrato de cortiça. Também verificou-se verificou que o processo de aquecimento a temperaturas superiores a 160ºC é capaz de remover TCA do substrato de cortiça quando em alto vácuo. Um método de quantificação de TCA, desenvolvido com este trabalho confirmou que a maioria de TCA era removido com um processo TPD, quando aquecido a temperaturas acima do pico detectado.
Com este resultado experimental é possível propor um processo de remoção de TCA das rolhas de cortiça aquecendo-a temperaturas próximas ou superiores do pico TPD. Tal processo teria a finalidade de remover o TCA da cortiça e dos seus derivados, pelo menos de forma a que este composto não seja detectável. Por forma a atingir este objetivo, é necessário compreender de que modo a adsorção de TCA ocorre, sendo esse o principal objectivo e contribuição desta tese - confirmar a natureza da adsorção do TCA e, mais importante, uma tentantiva de determinar qual o grupo desta molécula que efectivamente se liga aos substrato de cortiça. Para esta finalidade, outros substratos e compostos foram escolhidos para serem testados, devido às suas semelhanças com a constituição da cortiça e da estrutura química do TCA. Com este ensaio verificou-se que a celulose não tem um papel relevante na adsorção.
Palavras-chave: Cortiça, Tricloroanisol, Adsorção, Dessorção a Temperatura Controlada,
C o n t e n t s
List of Figures xv
List of Tables xvii
List of Symbols xix
List of Acronyms xxi
1 Introduction 1
1.1 Contextualization . . . 1
1.2 Field contributions . . . 2
1.3 Understanding TCA adsorption in cork substrates . . . 5
2 Concepts and experimental techniques 7 2.1 Physical and Chemical Adsorption . . . 7
2.2 Thermal analysis techniques . . . 10
2.3 Adsorption analysis methods . . . 11
2.4 Mass Spectrometry . . . 15
3 Cork and adsorbates 17 3.1 Cork - Origins and Constitution . . . 17
3.1.1 Cellular structure . . . 18
3.1.2 Chemical structure . . . 19
3.2 Trichloroanisole - Genesis and analysis . . . 20
3.3 Substrates and adsorbates selection . . . 23
4 Experimental Procedure 27 4.1 Experimental Setup . . . 27
4.1.1 Vacuum System . . . 27
4.2 Samples Preparation . . . 30
4.2.1 Substrates . . . 30
4.2.2 Contamination Procedures . . . 30
4.2.3 Spray contaminations . . . 32
CO N T E N T S
5 Results and Analysis 33
5.1 Quantification of the desorbed TCA . . . 33
5.2 Desorption from clean cork . . . 36
5.3 Temperature programmed desorption of TCA on cork . . . 40
5.3.1 Pre-heating effects on TCA desorption from cork . . . . 42
5.3.2 Sidetrack experiments . . . 45
5.4 Desorption from cork-related substrates . . . 46
5.5 Desorption of TCA-like molecules . . . 50
6 Conclusion 55 6.1 Future Work . . . 57
Bibliography 59
L i s t o f F i g u r e s
2.1 Elements and processes involved in adsorption. Image obtained from [18]. . 8 2.2 Lennard-Jones potential for a certain physisorption and chemisorption
pro-cess. Image obtained from [18]. . . 9 2.3 Different orders of desorption reactions. In figure (a) is represented the first
order and in (b) the second order spectra. Figures adapted from [21]. . . 11 2.4 Relation between the desorption energy with peak’s temperature for a first
order desorption with a linear variation of temperature. Different heating rates were also considered. . . 13 2.5 Diagram indicating the different steps of Taylor-Weinberg-King method for
a desorption spectra of silver from a rubidium substrate. Image obtained from [21]. . . 15 3.1 Cork’s sections, with the respective scale, as observed with scanning
elec-tron microscopy: a) transversal; (b) radial and (c) radial section. A three-dimensional diagram of cork’s structure is also presented adressing the re-spective sections. Adapted from [25]. . . 18 3.2 Diagram representing different paths of TCA formation [29]. . . . 21 3.3 Mass spectrum of 2,4,6-trichloroanisole with its molecule representation. The
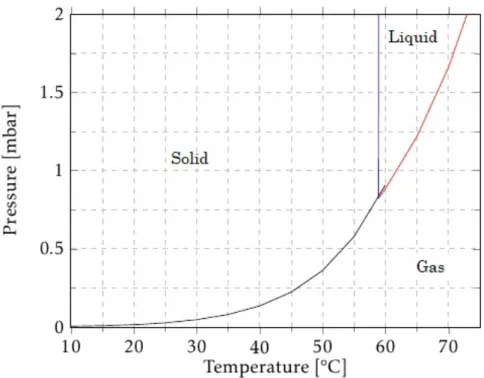
expected molecule fragments are also represented in the respective masses. Adapted from NIST chemistry WebBook [31]. . . 22 3.4 TCA phase diagram. Each coloured line is separating two different TCA
phases. Blue line separates the solid from the liquid phase, red curve sep-arates liquid from gas and the black curve is separating gas from solid phase. This diagram was courtesy ofCork Supply. . . . 23 3.5 Chemical structures of the different adsorbates used: a) Trichloroanisole (TCA);
b) Trichlorobenzene (TCB); c) Anisole. Adapted from NIST chemistry Web-Book [31–33]. . . 24 3.6 Mass spectrum of TCB. Adapted from NIST chemistry WebBook [32]. . . 25 3.7 Mass spectrum of anisole. Adapted from NIST chemistry WebBook [33]. . . 25 4.1 Schematic of the final setup of the vacuum system used. . . 28 4.2 Picture of the oven with the auxiliary net compressing the samples against the
L i s t o f F i g u r e s
4.3 Representation of how the stoppers were cut in order to prepare the cork
substrates and its approximate dimensions. . . 31
5.1 Relation of the calibrated helium signal with the helium partial pressure. . 35
5.2 Example of a three-dimensionalQuadstarsoftware spectrum obtained. . . . 37
5.3 Desorption Spectra of clean slices of cork. In the left column the slice was ap-proximately 5 mm thick and in the right column it was apap-proximately 1 mm thick. Each row of spectra corresponds to a relevant temperature in the des-orption of TCA. . . 38
5.4 Mass spectrum of the hydrocarbon C16 (hexadecane) and its chemical struc-ture. Adapted from NIST chemistry WebBook [34]. . . 39
5.5 TCA desorption peak in a cork substrate. . . 41
5.6 TCA desorption peak in a cork substrate without pre-heating at 50ºC after contamination. . . 42
5.7 TCA desorption from cork substrates. In each graph, the circle marks repre-sent the pre-heated samples and the square marks reprerepre-sent the samples that were not heated before the TPD process. . . 43
5.8 Desorption spectra of TCA on a teflon substrate. . . 45
5.9 Desorption spectra of TCA on a cork substrate obtained after pumping the samples for a week, in a high vacuum system. . . 46
5.10 Desorption spectra of the different adsorbates while using slices of cork as substrate. . . 47
5.11 Desorption spectra of the different adsorbates while using a lignin substrate. 48 5.12 Desorption spectra of the different adsorbates while using a cellulose substrate. 49 5.13 TCA desorption spectra from the different substrates used. . . . 50
5.14 TCB desorption spectra from the different substrates used. . . . 51
5.15 Anisole desorption spectra from the different substrates used. . . . 52
L i s t o f Ta b l e s
2.1 Parameters with the corresponding values after a calibration of the balzers equipment. . . 16 3.1 Relevant dimensions to obtain the total internal surface of an average cork
L i s t o f S y m b o l s
τ Monolayer formation time
λ Free mean path
α,β Heating Rate
νn Pre-exponential factor
A Aperture Section
CHe Conductance for helium
CT CA Conductance for TCA D Diameter of the restriction
Eact Activation Energy
Edes Desorption Energy Edis Dissociation Energy
Kn Knudsen number
M Molar mass of the solid material
MHe Molar mass of helium MT CA Molar mass of TCA
P Pressure
PHe Partial pressure of helium QHe Throughput of helium
QHe,Ref Throughput of helium from the reference leak
QT CA,Ref Throughput of TCA from the reference leak
QT CA,unk Throughput of TCA from the contaminated substrates
R Ideal gas constant
SignalHe Signal of helium measured
SignalHe,Ref Signal of helium measured from the reference leak
T Temperature
T0 Initial temperature
Tp Temperature at which the peak’s maximum occurs kn Rate constant
L I S T O F S Y M B O L S
rdes Rate of desorption
L i s t o f Ac r o n y m s
EGA Evolved-gas analysis
GC-MS Gas Chromatography-Mass Spectrometry
IL-SDME Ionic liquid-based single drop microextraction
IMS Ion mobility spectrometry
PID Proportional-integrative-derivative
QMS Quadrupole mass spectrometry
SBSE Stir bar sorptive extraction
SFE Supercritical fluid extraction
SPME Solid-Phase Microextraction
TBA 2,4,6-tribromoanisole
TBP 2,4,6-tribromophenol
TCA 2,4,6-trichloroanisole
TCB 1,3,5-trichlorobenzene
TCP 2,3,4,6-tetrachlorophenol
L I S T O F AC R O N Y M S
TPD Temperature-programmed desorption
UHV Ultra-high vacuum
C
h
a
p
t
e
r
1
I n t r o d u c t i o n
A general introduction to the topic of this thesis is done in this chapter. The contextual-ization and the source of the problem is described and discussed. It is also mentioned the background related to this field and how it contributed with different aspects. In the end of this chapter there is an introduction to our contribution on this subject and what are the intended goals.
1.1 Contextualization
Portugal is the main producer of cork in the world. This requires special concerns towards the quality of cork. Regarding its different applications, different tests have to be done in order to guarantee the quality of the cork.
We will focus on one of the main usages of the cork - cork stoppers. This piece of refined cork serves the purpose of containing and preserving the state of certain beverages, typically wine, thus the cork stopper should not have releasable contaminants that would degrade its state.
Wine producers typically use cork stoppers. However for a few years, some producers stopped using cork as the preferred material for stoppers and searched for other solutions such as synthetic stoppers. This was due to the contamination of wine leading to the well-knowncork tainton wines. It was later determined that this organoleptic defect was mainly caused by 2,4,6-trichloroanisole (TCA) presence on the cork [1].
C H A P T E R 1 . I N T R O D U C T I O N
It was proven that cork stoppers can be excellent barriers to the transmission of off -flavours from external sources [2]. In the work of Capone et al. they used closed wine bottles and verified that after contaminating the exterior surface of a cork stopper with deuterium labelled TCA, it would not contaminate the wine and most of it stayed in the outer part of the cork even after three years of bottle storage. This means that the cork would only contaminate with TCA if the cork’s contamination happened prior to the bottle closure [2]. They also pointed that while observing the slow passage of TCA through the length of the cork supported the argument that the contamination only takes place if the contaminated regions get in direct contact or close enough to the wine.
1.2 Field contributions
The different approaches to this subject are grouped in this section by the different aspects on which they contributed:
• Quality Control • Detection methods
• Degradation or removal of contaminants
In order to properly understand the detection values in this section, an important term must be introduced and discussed. This term isreleasable TCAand defines the amount of TCA in a soak when in equilibrium with a given piece of cork, meaning that there is no migration of this off-flavour from the cork to the soak nor the opposite. Hervé et al., that applied the releasable TCA concept as a quality control tool on natural corks, observed that it seems to take approximately 24 hours to reach a TCA equilibrium with the whole piece of cork soaked [3].
The soak consists of a solution of ethanol with water and it is often prepared with the purpose of recreating ethanol concentrations in wines, which should be approxi-mately 90% water and 10% ethanol.
Thus, whenever referring to a detection value, for instance the human detection threshold of TCA which is of 5 ng/L, this value indicates that there are 5 ng of TCA in a litre of the soak solution.
Hervé’s group also draw more conclusions towards the releasable TCA. They observed that there is a poor correlation between the total amount of TCA present in a cork stopper and the releasable TCA during the soak process.
1 . 2 . F I E L D CO N T R I B U T I O N S
strong correlation that was observed between the releasable TCA and the TCA found in the bottled wines. However, unlike what happens with the cork soak, which only requires approximately a day to reach equilibrium, in this case it required 14 months [3]. By the end of this experiment, the authors noticed that there was about half of the releasable TCA measured in the beginning of the experiment in the wine.
Another example of a quality control system is given byCork Supplywith their In-nocorksystem [4]. It consists of a chamber where the natural cork stoppers are inserted. These samples receive an influx of compressed air which carries both water vapour and ethanol towards the chamber. The gas flux is under controlled temperature conditions. This process allows TCA to be extracted from the cork and along with the compressed air flux prevents re-adsorption onto the cork. Then, taking into account the removed TCA and other odours, they control which samples have the proper quality to hit the market [4].
As far as detection methods are concerned, different approaches are here described. The group of Evans et. al described and used Solid-Phase Microextraction (SPME) coupled with Gas Chromatography-Mass Spectrometry (GC-MS) in order to analyse TCA in wines [5]. This method required no solvents and the sampling procedure was auto-mated. It was also possible to quantify the analysed TCA down to 5 ng/L. The process had yet to be applied to different cork-related compounds, which may contribute to the unpleasant cork-taint.
Seven years later, in 2004, Z. Penton lowered the detection limit to under 1 ng/L using SPME coupled with GC-MS as well but with different equipments [6].
In 2011, Marquez-Sillero et al. combined Ionic liquid-based single drop microextrac-tion (IL-SDME) with Ion mobility spectrometry (IMS) in order to detect TCA both in water and wine samples. The limit of detection was set in between 0.2 ng/L and 0.6 ng/L. With this experiment they also corroborated that the cork stoppers were the source of the contamination in the wine samples since only those that had the stoppers were contami-nated [7].
The group of Fontana et al. proposed an extraction method of TCA from wine samples. It consisted of Ultrasound-assisted emulsification extraction (USAEME) and combined with GC-MS was able to reach detection limits of 0.6 ng/L, also allowing quantitative extractions [8].
Another approach was done by Horst R. in which he explains what lead him to abandon one methodology of work for another. He felt the need to drop SPME for Stir bar sorptive extraction (SBSE) in order to improve the limits of detection (from 2.9 ng/L to 0.3 ng/L) and to increase its productivity, since it allowed to process multiple samples. These methods were always combined with GC-MS.
C H A P T E R 1 . I N T R O D U C T I O N
In May 2016, Amorim Cork announced that their quality control system is able to guarantee and deliver cork stoppers that no longer cause the cork taint [10]. Using a sophisticated and fast GC-MS technique, they affirm that they are able to detect an indi-vidual contaminated cork stopper with more than 0.5 ng/L in just a matter of seconds allowing the technology to be adapted on an industrial scale. However, the cork stoppers identified as being above the TCA threshold defined by Amorim Cork, are removed from the usable lot.
Cork treatment and removal or degradation methods were also proposed.
In 2000, Taylor et. al developed a Supercritical fluid extraction (SFE) method which was then combined with GC-MS with selected ion monitoring to allow quantification of the removed TCA from cork stoppers [11].
An attempt on trying to remove taste and odour of TCA from water by using tight ultrafiltration membranes was done by Park et al. In their work they noticed that their main concern was the TCA adsorption on the membranes surface [12].
The patent FR2884750(A1) uses a set-up that has the intended goal of lowering the partial pressure that the released TCA from cork exerts, to a sufficiently low pressure level [13]. This pressure level is not specified in the patent. The system has a mass spec-trometer and it may have lamp in order to heat the stoppers. However, in this patent the temperature control is optional and the samples seem to consist of both non-contaminated and contaminated stoppers. It should be noticed that there are no mass spectrometers with enough sensitivity to detect naturally contaminated cork stoppers, which should be a problem in this patent.
Vlachos et al. tried to treat cork barks and natural cork stoppers by sterilising them. They used different types of gases in this steralization. Gaseous ozone was used on cork barks while a combination of steam and ozone was used for cork stoppers. Even though ozone was enough to sterilise and conserve the cork bark for a week, it wasn’t enough to contribute to the deodorization of cork stoppers [14].
Also Vlachos et al., on a different investigation, tried a degradation of TCA by gas-phase photocatalytic, while in a presence of a nanocrystalline titania film. It was devel-oped in order to treat cork stoppers. The photodegradation was obtained while using black light tubes of low intensity emitting near-UV, meaning that the solar light could also be used for this degradation [15].
Another degradation experiments were realized. Back in 2001, Careri et al. irradi-ated TCA with an electron beam and analyses were done with the GC-MS technique. This irradiation caused the degradation of TCA into different compounds such as 2-chloroanisole, 4-2-chloroanisole, 2,4-dichloroanisole and 2,6-tricloroanisole. Quantitative data showed that with the increase of the radiation dose, the TCA amount decreased while the concentration of its derivatives, except 2,6-trichloroanisole, increased [16].
1 . 3 . U N D E R S TA N D I N G TCA A D S O R P T I O N I N CO R K S U B S T R AT E S
the TCA present in contaminated cork stoppers by using gamma-rays. This contributes to the reduction of the sensory defects since it creates molecular residues which do not have odour characteristics [17].
1.3 Understanding TCA adsorption in cork substrates
The molecules of TCA are bound with cork substrates, which means that it should be possible to remove them when given a certain amount of energy. Acknowledging this, it should be possible to observe a manifestation of the removed TCA. This is only observable when combining gas chromatography with mass spectrometry (GC-MS) since the GC technique pre-concentrates the TCA, allowing it to be properly detected by the mass spectrometer. A direct measurement of the desorbed TCA is not possible, if only naturally contaminated cork stoppers are considered.
However, if we artificially contaminate cork substrates with a reasonable amount of TCA and submit them to a given temperature, it should be sufficient to detect the desorbed contaminant by mass spectrometry, when in a vacuum atmosphere.
Combining both temperature programmed desorption with quadrupole mass spec-trometry allowed us to observe a TCA desorption peak. This experimental result allowed us to set new objectives.
A long term objective for this work is to design an appropriate system of extraction of TCA or other off-flavours from cork stoppers. However, in order to do so, it is necessary to properly understand the details behind this particular case of adsorption, and that will be our contribution with this work.
Thus, the objectives of this thesis are identifying whether the adsorption is a chemisorp-tion or a physisorpchemisorp-tion and, most importantly, which group of 2,4,6-TCA molecule is effectively bonding with the cork substrate.
For this purpose, different experiments were conducted. However, the substrate con-taminating procedure was kept consistent, meaning that the substrates were always arti-ficially contaminated with the sufficient amount to properly detect the removed TCA.
C
h
a
p
t
e
r
2
C o n c e p t s a n d e x p e r i m e n ta l t e c h n i q u e s
In this chapter the physical phenomenons and experimental techniques that will be more frequently referred throughout this dissertation are discussed. Starting with the phe-nomenon behind temperature-programmed desorption, adsorption is the first to be de-scribed. Later the technique itself will be explained as well as a brief explanation on Quadrupole mass spectrometry (QMS).
2.1 Physical and Chemical Adsorption
There are different types of sorption to be considered. Besides the absorption case, there are two other types of sorption to be explained: physical and chemical adsorption.
Before explaining the adsorption processes, a couple terms have to be introduced. These terms are adsorbate or adparticles and adsorbent material. The adsorbent refers to the solid material where the colliding particles adhere and stick to the material. The particles that adhere or are adsorbed are the adsorbate or adparticles and could either be in a gas phase or liquid phase. Making a brief analogy with the work in this thesis, the adsorbate is TCA, while the adsorbent material is cork, more specifically the substrate’s surface.
In figure 2.1 are represented the terms for the elements participating in an adsorp-tion process. The white circles represent atoms in the solid material and the grey circles represent the particles being adsorbed. In it is possible to observe how adsorption oc-curs. Whenever an incident gas particle collides with the material and enough energy is involved, an adsorption may occur. If it is adsorbed, it stays on the surface of the material until it has enough energy again to be desorbed. This desorption energy can be provided thermally, by heating the surface.
C H A P T E R 2 . CO N C E P T S A N D E X P E R I M E N TA L T E C H N I Q U E S
Figure 2.1: Elements and processes involved in adsorption. Image obtained from [18].
on a migration or diffusion of the adparticles into the solid material interstitial sites or lattice defects or even moving along grain boundaries of crystallites [18]. Adsorption consists on a phenomenon that occurs at the surface of a solid material and may be described as when an attractive interaction between a surface and a particle holds enough energy to overcome the effect of the thermal motion [19].
Two other terms that should not be mistaken, even though they are often used in the same context are desorption and outgassing. While desorption occurs in the surface, outgass is the process in which a particle dissolved in a solid has to travel to the surface and then desorb [18].
There are two categories of adsorption, physical and chemical adsorption:
• Physical adsorption relies essentially on van der Waals forces or dipole forces to stablish the physisorption and are typically characterised by dissociation energies below 50 kJ/mol [18, 19];
• Chemical adsorption or chemisorption estabilishes an atomic bonding and its dis-sociation energies are usually above the 50 kJ/mol. It occurs whenever the overlap of the molecular orbitals of the adsorbed particle and the surface atoms allow the formation of a chemical bond [18, 19].
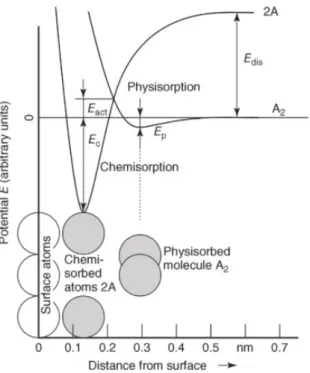
In the following figure 2.2, both physisorption and chemisorption phenomenons are indicated regarding on how the potential energy develops with the increase of the dis-tance from the solid material’s surface. Depending on the curve, this potential is either regarding a diatomic molecule A2, or two atoms 2A.
2 . 1 . P H YS I CA L A N D C H E M I CA L A D S O R P T I O N
Figure 2.2: Lennard-Jones potential for a certain physisorption and chemisorption pro-cess. Image obtained from [18].
The energy Edis is considered when dissociating the molecule A2 into two atoms. For instance if the molecule A2, approaching the surface, receives enough energy to overcomeEdisat a distance above 0.6 nm, it would dissociate and could possibly lead to
chemisorption. However, near the surface it would be easier to dissociate this molecule by only overcoming the activation energyEactinstead of the previousEdis. After dissociation,
chemisorption can take place and adsorb both atoms A at a distance of 0.15 nm from the surface.
Regarding the 2A curve, the potential well is closer to the surface, in this case be-tween 0.1 nm and 0.25 nm, establishing a more energetic bond with the adsorbent mate-rial.
Nonetheless, it is clear that the physisorption requires less energy to break the estab-lished bonds than the chemisorption.
This adsorption phenomenon can be used within diverse applications, such as vac-uum technology, where the adsorption is used to achieve lower levels of pressure. For instance, by using a porous material we have a higher surface area to adsorb some un-desired compounds that may be in the vacuum system. Furthermore, if we cool this material, we potentially increase its efficiency since it translates into a deeper energy well which consequently means it requires a higher energy to desorb the gas from that porous material.
C H A P T E R 2 . CO N C E P T S A N D E X P E R I M E N TA L T E C H N I Q U E S
the time formation of a monoatomic layer with the pressure, is given in equation 2.1:
τ= nm
PNA √
2πMRT (2.1)
Withτ the time formation of a monolayer in seconds,nmthe number of particles in a monolayer per cm2,P the pressure in mbar,Rthe ideal gas constant,M the molar mass of the solid material andT the temperature in absolute units. A monoatomic layer will have approximately 1015particles/cm2when fully covered [18].
For instance, it takes less than a second for a geometric surface area of 1 cm2, under a pressure of 1×10⁻⁵mbar, to be covered with a monoatomic layer of air, assuming that
the every particle that collides with the surface permanently adsorbs.
2.2 Thermal analysis techniques
There are several methods to do thermal analysis. Each of these methods focus on a diff er-ent property, for example, thermogravimetry analyses mass, dielectric thermal analysis or the permittivity [20]. In this work, we pretend to analyse gases, specifically TCA that desorbs from cork substrates. Thus the thermal method that will be used is evolved gas analysis.
Evolved-gas analysis (EGA) consists on a technique that tracks the amount of gas or vapour that evolves from a sample, which is under decomposition or desorption, in function of time or temperature. The temperature of the sample has to be controlled [20].
A particular case of EGA is temperature-programmed desorption also called Ther-mal desorption spectroscopy (TDS), typically when experiments are performed using well-defined surfaces of single-crystalline samples under Ultra-high vacuum (UHV) sys-tem [19].
TPD experiments consist on letting gas or gases adsorb into a surface which will be posteriorly heated with a controlled (programmed) heating rate. The temperature increase is usually a linear function of time. While the sample is heated, gases desorb from the surface and are detected, by mass spectrometry.
The TPD techniques are relevant in the determination of kinetic and thermodynamic parameters of decomposition surface reactions or desorption processes [19].
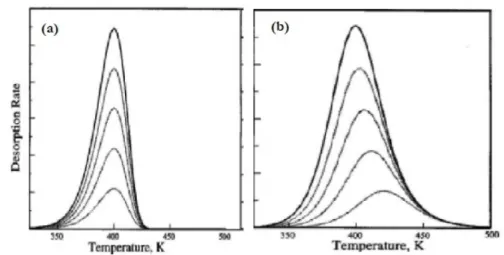
It is possible to distinguish between different types of desorption. These are called orders of desorption and each order is separated regarding the process that originated it and the shape of the peak obtained, when analysing the adsorption. Figure 2.3 exhibits the different desorption spectra behaviours.
2 . 3 . A D S O R P T I O N A N A LYS I S M E T H O D S
Figure 2.3: Different orders of desorption reactions. In figure (a) is represented the first order and in (b) the second order spectra. Figures adapted from [21].
The second order (2.3b) is a dissociative type of desorption. It is a result of when a molecule adsorbs and dissociates while doing it. The desorption peak of this spectra has a symmetric shape [21].
2.3 Adsorption analysis methods
In 1962, P. A. Redhead discussed methods of analysis regarding the thermal adsorption of gases. In it, the author described methods on how to determine the desorption energy, the rate constant of the desorption and the reaction’s order from flash-filament desorption experiments [22].
Although the samples were heated by flash-filament method, which is a different pro-cess than ours, the adsorption parameters can still be obtained applying the methods described, as long as the temperature-time relation for the heating rate is properly con-trolled. Thus, methods for the determination of the desorption parameters previously indicated, will be described in this section and in chapter 5 will be applied to our data.
In Redhead’s work, two different types of temperature variation were considered: a linear variation of sample temperature T(t) = T0 + βt and a reciprocal variation
1
T =
1
T0 − αt. In both cases,t is the time variable,T0the initial desorption temperature andα,βthe heating rates. In our case we will use a linear temperature variation withβ
being:
β=dT
dt (2.2)
The desorption rate is often expressed by a rate law ofnthorder [19]:
rdes=− dσ
dt =kn∆σ
C H A P T E R 2 . CO N C E P T S A N D E X P E R I M E N TA L T E C H N I Q U E S
Withσ being the surface coverage (molecules/cm2), n the order of the desorption reaction andknthe rate constant.
Notice that the reason for the existence of a desorption peak is due to the fact that TPD peaks are a convolution of surface coverage and rate of desorption. Taking into account that the surface coverage decreases with temperature, while the rate constant has a exponential factor that makes it increase with the temperature, it is expectable to find a desorption peak.
The rate constant indicates how fast the desorption process occurs. For example, while performing a TPD more molecules will desorb per unit of time as the temperature increases.
Knowing that the rate constantknis described by theArrheniusequation we obtain:
kn=νne−E/RT (2.4)
WithE being the desorption energy of desorption and being expressed as J.mol,R
the ideal gas constant in J.mol.K−1andν
na pre-exponential factor, which in this case is
related to the lattice oscillations or the frequency on which the adsorbed particles oscillate towards desorption, usually assuming a value of 1013Hz.
Thus, the rate law is usually referred as thePolanyi-Wigner equation, defining the desorption energyE:
rdes=− dσ
dt =νne
−E/RTpσn (2.5)
If we now also consider the linear heating rate and substitute the timetin the Polanyi-Wignerequation 2.5 withdt = (1/β)dT it yields [19]:
rdes=− dσ dT =
νn β e
−E/RTpσn (2.6)
Knowing that atT =Tmaxthe desorption rate has to be null and solving the differential
equation:
Edes RTp2
=ν
βnσ
n−1e(−Edes/RTp) (2.7)
With this equation, Redhead determined that the temperature,Tp, at which the
desorp-tion peak’s maximum is located is independent of the surface coverage while considering a first order desorption. Assuming a desorption of first order and then solving in order to the desorption energyEdes, we obtain the Redhead’s general equation:
Edes=RTp lnνTp β − ln
Edes RTp !
(2.8)
2 . 3 . A D S O R P T I O N A N A LYS I S M E T H O D S
error introduced with this estimation is below 1.5%, when assuming a ν/β value be-tween 108K−1to 1013K−1[22].
Obtained equation 2.8, it is now possible to determinate desorption energies for a single desorption spectra using aνvalue of 1013.
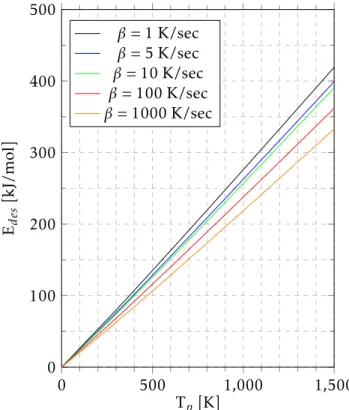
By plotting the desorption energy against peak’s temperature we obtain the graph in figure 2.4:
0 500 1,000 1,500
0 100 200 300 400 500
Tp [K] Ed
es
[kJ/mol]
β= 1 K/sec
β= 5 K/sec
β= 10 K/sec
β= 100 K/sec
β= 1000 K/sec
Figure 2.4: Relation between the desorption energy with peak’s temperature for a first order desorption with a linear variation of temperature. Different heating rates were also considered.
It is possible to see the relation of Edes with the temperature of the maximum of the peak. Each curve represents a different heating rate which is defined byβ, taking a pre-exponential factor of 1013K−1.
Considering both Redhead’s general equation, equation 2.7, and the graph obtained in 2.4, it is possible to take conclusions. Regarding the temperature of the peak, if the heating rate is increased, we should expect to see the peak position shifting towards higher temperatures and having an increase in the desorption peak’s intensity.
C H A P T E R 2 . CO N C E P T S A N D E X P E R I M E N TA L T E C H N I Q U E S
For instance, if we determine a peak’s position, Tp1, as being 100ºC, while using a heating rate of 1 K/sec, we look at the 1 K/sec curve and determine the desorption energy. Then, using the curve corresponding to the heating rate that we pretend to use, we use the previously determined desorption energy to obtain the new peak’s positionTp2. The desorption energy is characteristic of the system, meaning that it will not be changed with the heating rate and therefore we may use it to determine shifts in the position of peaks. Notice that the heating rate curves are represented in K/sec and not K/min, so that should be taken into account when predicting Tpvalues.
This method was the analysis described by Redhead to determine the desorption energy, however this may imply errors considering the assumptions that were done. Nonetheless it is a very useful method while obtaining an estimation for the desorption energy in desorptions of first order, since it is only required to determine the desorption peak’s maximum experimentally, in order to obtain the desorption energy, which is the case of this work.
Alternatively, if we take equation 2.7 and apply the natural logarithm to both sides and rearranging, it yields:
ln
Tp2 β = Edes RTp2
+ln Edes Rν
!
(2.9)
Tracing the natural logarithm ofTp2/βversus the reciprocal of temperature in absolute units, for a series of differentβ, we obtain a linear variation. Then, from the slope we determine the desorption energy and from the interception with the coordinates, the rate constant value. This alternative method is known as the heating rate variation method since for each curve different values ofβare assumed.
Another method was proposed by Taylor-Weinberg-King as the complete analysis method [23]. This method allows a more precise determination of both Edes and the
rate constant. It is applied in a similar way to the heat varying rate method. A natural logarithm is applied but in this case instead of using the general Redhead equation, we use equation 2.6, from which we obtain, after rearranging the equation 2.10:
ln(rdes) =ln νnσn
β
!
− E RTp2
(2.10) To further describe this method, we will be using an example in order to be easily understood. In figure 2.5 it is represented the complete analysis of a desorption spectra of silver from a rubidium substrate [21].
2 . 4 . M A S S S P E C T R OM E T RY
Figure 2.5: Diagram indicating the different steps of Taylor-Weinberg-King method for a desorption spectra of silver from a rubidium substrate. Image obtained from [21].
natural logarithm of the rate desorptionln(rdes) against the reciprocal of the temperature
1/T, which is then represented in 2.5c. From it, it is possible to obtain the desorption energy by determining the slope.
2.4 Mass Spectrometry
To perform TPD, a technique to detect the desorbed species is required. Typically a mass spectrometer is used, as was our case.
A quadrupole mass spectrometer may be considered as having three main compo-nents: the ion source with the adequate optics of extraction, the analyser and the detector. The ions are produced typically by electron impact bombardment and the colliding elec-trons are originated by thermal emission from a heated filament [19]. In our case this filament was a tungsten wire and later it was replaced with iridium. Then, the ions that we pretend to analyse are guided by electrostatic lenses towards the analyser where they are selected taking into account their mass/charge ratios. The analyser consists of four parallel cylindrical rods and has applied voltages in order to filter the ions. If the ions travelling in between the rods are heavier or lighter than intended to, they are deflected from the path and do not reach the detector. The ions that reach the detector collide with collector and are then registered using a pre-amplifier. Besides the channeltron electron multiplier, there may be a pre-amplifier to further amplify the gain so it should be possible to do an easy analysis.
C H A P T E R 2 . CO N C E P T S A N D E X P E R I M E N TA L T E C H N I Q U E S
Even though they were the same model, the overall performance of the system increased after substituting the first spectrometer with the second equipment. The substitution took place before advancing towards the second phase of work and it improved a few aspects regarding the whole acquisition process. It allowed to perform faster data acquir-ing processes since it was possible to easily follow the peaks of interest with the mass spectrometer software. The observed intensities in each peak increased and instead of having large peaks covering more than two mass units, as it was observed with the initial spectrometer, the resolution improved and it was possible to see a peak in each mass unit. Since the detector allowed higher intensities to be observed, it was possible to afford a decrease of the adsorbate volume used in the contaminations, further described.
Both mass spectrometer, that were used in the experiments, have some parameters that have to be properly defined in order to achieve the calibration of the equipment and to allow the observation of the ions detected in the corresponding masses of the mass spectra. Otherwise, when performing TPD experiments the desorption spectra obtained could be misleading.
Thus the relevant parameters are mostly related with the extraction optics and the electrostatic lenses, which voltages areextraction,deflection,focus,ion ref andQMA gnd. For future reference, while using the same model equipment the values used are indicated in table 2.1.
Table 2.1: Parameters with the corresponding values after a calibration of the balzers equipment.
Parameter Value [V]
Extraction 40.5 Deflection 258.6
Focus 26.1 Field Axis 9.8
Notice that while theextraction,focusandfield axisparameters are measured regarding theion ref parameter, the focus is measured in relation with theQMA gnd.
Another procedure worth noting about the mass spectrometer should be the spe-cial care about the mass spectrometer’s filament, while introducing and changing sam-ples. In order to preserve and keep the filament intact, the pressure should not be above 1×10⁻⁵mbar, at least when the filament is working, otherwise the filament might
C
h
a
p
t
e
r
3
C o r k a n d a d s o r b a t e s
In the first part of this chapter, the cellular and the chemical constitution of cork are described. The cork cell’s geometry is also discussed.
Later, in the second part of this chapter we focus on one of the main concerns of this work, the TCA as a cork contaminant. How it is formed and how it contaminates cork and consequentially wine, are subjects that will be approached. A detailed description on relevant properties of TCA is also done.
Ending this chapter, we discuss the reason for the selection of other substrates and adsorbates which were experimented in this work.
3.1 Cork - Origins and Constitution
Cork is the bark of the cork oak tree,Quercus suber, and is a raw material. It is character-istic tree of the Mediterranean region and it is obtained after the cork oak has attained a proper size to get its cork bark removed [24]. This procedure is done without damaging the tree. The cork will then regrow and within 8 to 10 years the process of removal is repeated.
This material has several applications, but the most acknowledged is as a stopper to wine bottles, preserving the beverage within.
It should be noticed that even though many other substitutes for cork were developed, these are only viable for the purpose they were initially developed [24], for example, synthetic bottle stoppers were designed solely for that purpose.
C H A P T E R 3 . CO R K A N D A D S O R BAT E S
In the following sections, both the cellular structure and chemical structure of this material will be described.
3.1.1 Cellular structure
Robert Hooke (1635-1703) described cork using a microscope for the first time in the 16th century. He sketched and described this material as containing small holes which Hooke called cells from the Latincellameaning small rooms [25]. Later, in 1950, Joaquim Vieira Natividade (1899-1968) observed cork using an optical microscope and gathered all information known about cork on a book of his own, entitledSubericultura.
Since Hooke’s observation, it is known that cork is a cell material. These cells are struc-tured like a honeycomb and shaped as prisms with their bases being typically hexagons. The cell walls are approximatelly 1.5 mm thick, being very thin compared to the rest of the structure. It is also possible to state that only 8% to 9% of the total volume is a solid fraction in early cork and 15% to 22% in late cork [25].
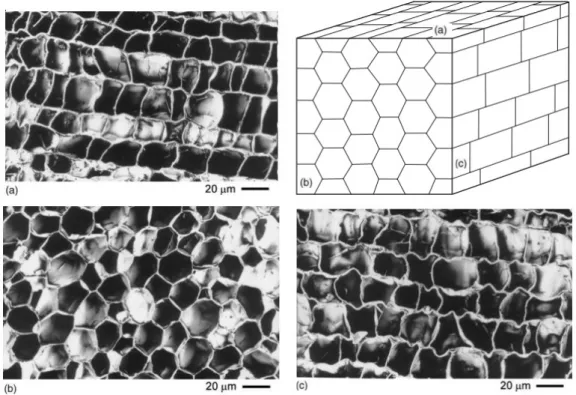
Different sections of cork’s cellular structure are presented in the figure 3.1. Thus to have a proper understanding of the micrographs, three sections were assumed. The radial section is along the growing direction of cork and the tangential section is parallel to the vertical axis of the tree trunk. Both radial and transversal sections have the same axis, however, the transversal section is shifted by 90 degrees and it may be taken as a top or bottom view.
3 . 1 . CO R K - O R I G I N S A N D CO N S T I T U T I O N
Taking into account the micrographs presented, it is possible to evaluate the dimen-sions of the cork cells. The height of the prism ranges from 30 to 40 µm, the base edge from 13 µm to 15 µm and the cell’s walls from 1 µm to 1.5 µm thick.
A relevant property is the cork density which has a mean value of 170 kg/m3and de-pends on the cells’ density. It also dede-pends on lenticular channels, on the cells’ geometry and irregularities on the cell walls [26].
Another property to be considered while mentioning adsorption is the total internal surface of a cork’s cell. Assuming an hexagonal prism with the already mentioned dimen-sions, we are able to determine the base area (4.4×10⁻⁶cm2to 5.8×10⁻⁶cm2) and later
the cell’s total internal surface (3.2× 10⁻⁵ cm2 to 4.8×10⁻⁵ cm2). Also knowing that
the amount of cells ranges from 4×10⁷ per cm3 to 20×107per cm3 (acknowledging both early cork and late cork), we may determine the total internal surface of an average sized cork (with a diameter of 2 cm and 4.5 cm high). Thus the number of cells in a cork bottle stopper are 5.7×10⁸to 2.8×10⁹and therefore we have an internal surface of 1.82×104cm2to 1.35×105cm2or 1.82 m2to 13.5 m2. These results are gathered in the table 3.1.
Table 3.1: Relevant dimensions to obtain the total internal surface of an average cork stopper.
Min Value Max Value
Cell’s Total Surface [cm²] 3.20×10⁻⁵ 4.80×10⁻⁵
Number of Cells [cm−³] 4.00×10⁷ 2.00×10⁸
Cells in a Stopper 5.65×10⁸ 2.83×10⁹
Stopper’s Total Internal Surface [m²] 1.82 13.50
3.1.2 Chemical structure
Cork is mainly constituted by suberin and lignin with suberin being the main compo-nent of cork’s cell walls. Besides these compocompo-nents there are also polysaccharides and extractive materials.
The average chemical composition as it was determined by Pereira [26], is for suberin 39%, lignin 22%, polysaccharides 18%, extractive materials 15%, ashes 1% and carbohydrates which are mainly glucose and xylose. This study used virgin cork of 40 trees with no specific geographical location.
Suberin is a polymer made of long chain of aliphatic (non-aromatic) alcohols and acid monomers. While being more than a third of cork’s material, it is the most abundant compound in cork and its percentage ranges from 33% to 50%.
C H A P T E R 3 . CO R K A N D A D S O R BAT E S
Lignin is the second most abundant of cork materials and is very likely to be decisive regarding the rigidness of cork’s cell walls [26]. It constitutes in average 22% of cork’s material and has variations which range from 20% to 25% within a single tree [26]. Lignin will be one of the substrates used in the experiments later described.
Polysaccharides are constituted by cellulose and hemicelluloses in similar proportions and correspond in average to 18% of cork’s material [26].
Celluloses are linear polymers. In 1988, Pereira estimated that only 9% of cork’s cell wall was cellulose, meaning that cellulose is not the most relevant component defining its chemistry or even its properties. Furthermore, the glucose associated to this material corresponds to approximately 50% of cork’s monosaccharides [26].
Hemicelluloses are polysaccharides which are heteropolymers and are usually sorted by the main sugars present.
The extractive materials are waxes and non-polar compounds that are easily removed from cork using solvents such as water, alcohol or dicloromethane. The removal of such materials does not affect the cork’s cellular structure.
Among the extractive materials it is possible to find all different types of molecules and chemical families. They are usually separated into the aliphatic group and the phe-nolics group, which are possible to extract using the mentioned polar solvents [25].
The aliphatic group consists of triterpenes (such as cerin, friedelin, betulin, betulinic acid and sterols), n-alkanes (from C16 to C34), n-alkanols (from C20 to C26) and fatty acids (such as monoacids, diacids and hydroxyacids) [25].
The phenolic group is composed of simple phenols (such as phenols, benzoic acids and cinnamic acids) and polymeric phenols (tannins) [25].
3.2 Trichloroanisole - Genesis and analysis
In the 80’s, polychlorophenolic biocides such as pentachlorophenol, were used as fungi-cides, in order to protect some materials from microbes. However, there were some biocides that had 2,3,4,6-tetrachlorophenol (TCP) which was then metabolized by mi-crobial action to 2,3,4,6-tetrachloroanisol - one of the compounds causing the cork taint in wines [28]. This compound was found to be carcinogenic and was prohibited. Later, it was substituted by 2,4,6-tribromophenol (TBP) but even though it did not cause any health issues, it would still be metabolised into 2,4,6-tribromoanisole (TBA) and end up having sensory attributes such as the mouldy and earthy odours that TCA also presents. TCP is also obtainable through the chlorine bleaching process of cork after the natural formation of phenol has occurred.
3 . 2 . T R I C H LO R OA N I S O L E - G E N E S I S A N D A N A LYS I S
Figure 3.2: Diagram representing different paths of TCA formation [29].
Thus, TCA results of microbiological action in TCP, while TCP may originate either by naturally produced phenol which was submitted to chlorine bleaching from cleaning and hygiene products or simply caused by the application of agrochemichals. Re-used water in cork boiling processes may also contaminate subsequent cork pieces with TCA, even though it may be a superficial contamination [30].
We are interested in detecting TCA by mass spectrometry, thus we should know what to expect from its mass spectrum, which is presented in the figure 3.3.
Several peaks are presented in its spectrum so we focused on the most intense, since it would also be easier to detect. Therefore the peaks that will be followed are the ones at the masses 195, 197, 199 and 201. Besides the molecule of TCA, it is also represented in the mass spectrum of TCA the fragmentations that may occur within its molecule. Notice that the peak groups which have the same amount of chlorine atoms share the same shape.
It is possible to observe in the TCA spectrum, the fingerprint of the three chlorine atoms, not only in the peaks already mentioned but also in the peaks between masses 167 and 173 and between masses 210, and 216. This pattern is easy to identify based on the relative intensities of the individual peaks and on the group shape.
Chlorine has two stable isotopes which have masses of 35 and 37, with a relative abundance of 76% and 34%, respectively. Since the molecule of TCA has three chlorine atoms, there are four different combinations for these isotopes. These combinations translate into four peaks, each having a corresponding mass, regarding the chlorine isotopes that are present in TCA’s molecule. Thus, the relative intensities of the peaks in relation to the most intense, are approximately, 95%, 30% and 3%, as it is possible to see in figure 3.3.
C H A P T E R 3 . CO R K A N D A D S O R BAT E S
Figure 3.3: Mass spectrum of 2,4,6-trichloroanisole with its molecule representation. The expected molecule fragments are also represented in the respective masses. Adapted from NIST chemistry WebBook [31].
solid phase towards the gas phase, the sublimation of TCA occurs, by crossing the red frontier, TCA evaporates. The molar enthalpy of phase transition is 83.551 kJ/mol, from liquid to solid phase and of 61,969 kJ/mol, from gas to liquid phase (these enthalpy values are courtesy of an unpublished work ofCork Supply). The experimental melting point is at approximately 60°C (blue line).
Consider the triple point of TCA, which occurs at 58.9°C at a pressure of 0.823 mbar. Within these conditions, it is possible to find TCA in its three phases simultaneously. Above this pressure, TCA is also found in all phases, but it has to meet the proper condi-tions. For instance, consider a pressure a thousand times below the atmospheric pressure, of 100 Pa or 1 mbar. When the temperature is below 58.9°C, TCA is in solid phase, if it is above 62°C, it is in a gas phase. Below the triple point pressure, it is only possible to find TCA in its solid or gaseous phase.
There is TCA inside a flask at the secondary lines, which is in solid phase, and it has the purpose of being used as leak reference. Therefore, we intend that it stays in solid phase inside the flask. To prevent eventual losses by temperature changes, this flask is kept at room temperature inside a cup that is filled with water.
3 . 3 . S U B S T R AT E S A N D A D S O R BAT E S S E L E C T I O N
Figure 3.4: TCA phase diagram. Each coloured line is separating two different TCA phases. Blue line separates the solid from the liquid phase, red curve separates liquid from gas and the black curve is separating gas from solid phase. This diagram was courtesy ofCork Supply.
vacuum and the secondary lines are also connected to a rotary pump. Hence, as long as the pressure is below 2×10⁻² mbar and the system is below a temperature of 23ºC, in
both the main chamber or in the secondary lines, we guarantee that TCA is in vapour phase.
3.3 Substrates and adsorbates selection
In this work, different substrates and adsorbates were used. A simple piece of sliced cork will work as substrate, however two more types of substrates were used, lignin and cellulose. Unfortunately it was not possible to obtain suberin, the main constituent of cork, leaving this interesting variable to be tested in future experiments. The substrates were prepared, manipulated and sent to us byRAIZ, a laboratory from a well known paper producer.
C H A P T E R 3 . CO R K A N D A D S O R BAT E S
for adsobates were 1,3,5-trichlorobenzene (TCB) and anisole.
Figure 3.5: Chemical structures of the different adsorbates used: a) Trichloroanisole (TCA); b) Trichlorobenzene (TCB); c) Anisole. Adapted from NIST chemistry WebBook [31–33].
TCA is constituted by three chlorine atoms and a methoxyl radical which consists of CH3O. Taking its chemical structure into consideration, two obvious choices come up: trichlorobenzene and anisole. While both share the same benzene ring, TCB was chosen due to the three chlorine atoms (figure 3.5b) that are present in the molecule of TCA and anisole was chosen since it shares the methoxyl radical with TCA (figure 3.5c). In other words, this decision was to determine whether it was the three chlorine atoms anchoring to the cork substrate or if it was the methoxyl radical.
The mass spectrometer had to be adjusted in order to detect the intended ion masses, whether it was detecting TCB or anisole. We have taken into consideration the mass spectra published at NIST’s web page for both contaminants and for each we picked the most intense ones.
Regarding the mass spectra of trichlorobenzene (figure 3.6), the main peaks are at masses 180, 182 and 184.
For the anisole mass spectrum (figure 3.7), we followed the peak at 108 mass units and we often followed the peak at mass 78, in order to guarantee the mass calibration of the system.
Future experiments should explore contaminants such as chlorobenzene and tetra-chlorobenzene to understand how are the chlorine atoms contributing to the TCA adsorp-tion.
3 . 3 . S U B S T R AT E S A N D A D S O R BAT E S S E L E C T I O N
Figure 3.6: Mass spectrum of TCB. Adapted from NIST chemistry WebBook [32].
C
h
a
p
t
e
r
4
E x p e r i m e n ta l P r o c e d u r e
A detailed description of the vacuum system is done in this chapter, referring to which valves, pumps, different types of pressure gauges and different auxiliary equipment were used. Substrates preparation and contamination procedures are also described, for in-stance how the solutions were prepared and what was done in order to allow an easy reproduction of this process. A brief review on what we took into consideration while selecting the adequate heating rate is done in the final sections.
4.1 Experimental Setup
There were different set-ups, each one contributed to the improvement of the overall performance, however we will only focus and describe its last version.
4.1.1 Vacuum System
The vacuum system (see figure 4.1) is composed by two main pumps (a rotary P1and a tur-bomolecular P2) connected to the main chamber and one auxiliary pump (rotary) which is pumping the other system segments. However, for better readability, two auxiliary pumps, P3and P4, are represented instead of one.
The system can be divided in three sections: • High vacuum system
• TPD sample holder • TCA quantification
C H A P T E R 4 . E X P E R I M E N TA L P R O C E D U R E
Notice that if the vacuum system walls are at room temperature, it is easier for TCA molecules to adsorb onto them (see figure 3.4). Therefore, all sections were kept warm by heating tapes through the whole process, which were adjusted by aVariacautotransformer. Furthermore, the chamber was covered with aluminium foil to prevent heat losses as much as possible. This way, the main chamber was kept approximately at 100°C and the different segments were kept at approximately 75°C.
Figure 4.1: Schematic of the final setup of the vacuum system used.
The main chamber is a spherical chamber of 15 cm radius connected to the primary pumping system through a gate valve V1, to the quadrupole mass spectrometer through a flange and to an helium reference leak also through a flange. This helium reference is relevant in the quantification method of TCA, further described in section 5.1. The chamber is also connected to the other two sections through a metering valve V2 to the TPD sample holder section and through two different tube segments to the TCA quantification side. One segment has a needle valve V3and a flow restriction while the other segment has an in-line valve V4. Besides that, the chamber also has a penning ionization gauge G1to measure the pressure in it.
It is in the high vacuum system section that it is detected and analysed the desorbed TCA coming from the contaminated substrates or from the TCA leak flask. The base pressure in it should be as low as possible in order to increase the free mean path of the molecules of interest, which consequentially translates into an increase of intensities measured, since less particle collisions will take place.
The pressure in the chamber ranged from 1×10⁻⁷mbar to 1×10⁻⁵mbar. This was
4 . 1 . E X P E R I M E N TA L S E T U P
In the TPD sample holder section there are a pirani gauge G2 and an aluminium oven where the contaminated substrates stay through the TPD process. The reason for it to be aluminium is due to the high thermal conductivity of this material. The oven is surrounded by a resistance which is then connected to a power source, allowing it to heat to the desired temperature. The power source is anIsotech 606D, with enough power to keep the heating rate constant, even near the target temperature. For instance, a voltage of 24 V and 4.5 A were enough to reach 220°C, while keeping approximately the same heating rate.
The power source is then controlled by a Proportional-integrative-derivative (PID) controller. This equipment, which is anOmron E5CCdigital controller, plays an impor-tant role in the TPD process. Given a heating rate, it allows, using its own algorithm and a solid state relay, to turn the power source on and offat its own pace, maintaining the desired rate. It is possible to adjust the PID constants, in order to avoid overshooting the target temperature and to reduce, as much as possible, the temperature oscillations at the target temperature.
Besides this controller, the oven also has a net inside itself as an accessory in order to compress the samples against the oven walls, so it guarantees that the samples are as close to the oven temperature as possible (see figure 4.2).
Figure 4.2: Picture of the oven with the auxiliary net compressing the samples against the oven walls.
The TPD sample holder section is connected to an auxiliary rotary pump P4through a copper pipe and to the TCA quantitative control through an in-line valve V2.
C H A P T E R 4 . E X P E R I M E N TA L P R O C E D U R E
This quantification is important to determine if a desorption process is effective or not. By measuring the detected TCA, while performing a TPD, and knowing the amount of adsorbate used in the contamination, we have an idea of the desorption efficiency. The ideal case for a desorption process would be detecting as much TCA as the amount used in the contamination process.
There is always a chance that the TCA detected is desorbing from other material than the substrate. However, since the TCA readsorption cases were covered, whether by heating the chamber and tube walls or by the high pumping speeds, the amount of TCA detected due to this phenomenon should be negligible. Thus, we will be considering that the detected TCA is desorbing from the contaminated substrates.
Regarding the TCA’s desorption origin in the substrate, it is difficult to precise whether the TCA is desorbing from the surface or from the substrate’s bulk.
In a future work it is possible to improve the TCA’s quantification section by building and installing reference leaks for the different adsorbates used and not just for TCA.
4.2 Samples Preparation
Different types of samples were used while trying to learn the physics of the desorption of TCA from a cork substrate. Four different types of substrates were used in this work, however the substrates that required more effort preparing were the cork substrates.
4.2.1 Substrates
Adsorption is a surface phenomenon. Therefore, an ideal substrate to test the TCA des-orption would be an atomically flat layer of cork.
We are interested on studying the TCA that desorbs from the surface of cork. Hence, a first approach on a cork substrate consisted of eight slices of cork. These slices were sawed from the edges of two cork stoppers and were approximately 5 mm thick (see fig. 4.3). Each slice had an exposed area of 9 cm2.
On later tests, the thickness of these slices was reduced to a thickness of about 1 mm, in order to decrease bulk contributions. To obtain this thickness a recently boiled piece of cork had to be sliced, otherwise the cork would break while slicing it.
Most of the substrates produced were used in TPD tests once, only a few exceptions were used more than once, but no noticeable change was observed in the obtained spectra.
4.2.2 Contamination Procedures
4 . 2 . SA M P L E S P R E PA R AT I O N
Figure 4.3: Representation of how the stoppers were cut in order to prepare the cork substrates and its approximate dimensions.
A mother solution for each of the contaminants was prepared. While TCA and TCB are solid compounds, anisole is in a liquid state, meaning that while preparing its solution there will be slight differences.
The solutions of TCA or TCB had a concentration of 1 g/L and the anisole solution a concentration of 1 cm3/L. All solutions are contained on 100 ml Erlenmeyer flasks.
In order to obtain the concentrations for the solid contaminants, we weighted 0.1 g on a balance and added it to 100 ml of analytical ethanol, which corresponds to 79 g when weighted, since ethanol has a density of 0.79 g/mL. Then we dissolved the solute and it was assumed that the dissolution had a negligible increase on the final volume.
The main difference while preparing the solution for anisole consists on taking into account the volume of the liquid contaminant. Instead of weighting 79 g of ethanol, we measured 78.9 g, meaning that we added 0.1 ml of anisole to perform a total volume of 100 ml. In this case, we did not neglect the volume of the solute.
The contamination process was kept consistent. Using a syringe of 50 µl the contami-nant was dosed and dropped on the surface of the subtrate. Notice that it was not injected. Initially a volume of 400 µl was used in the contamination process, however, after the replacement of the mass spectrometer the substrates required less amount of adsorbate to be properly detected, which lead to a decrease in the volume to 100 µl. Also notice that we used amounts of contaminant well above the detection threshold, to allow an easier detection, better define the shape of the desorption peaks observed and to study the different relations of the adsorbates with the different substrates.
![Figure 2.1: Elements and processes involved in adsorption. Image obtained from [18].](https://thumb-eu.123doks.com/thumbv2/123dok_br/16538311.736623/30.892.228.659.161.436/figure-elements-processes-involved-adsorption-image-obtained.webp)

![Figure 3.2: Diagram representing di ff erent paths of TCA formation [29].](https://thumb-eu.123doks.com/thumbv2/123dok_br/16538311.736623/43.892.198.693.139.423/figure-diagram-representing-di-erent-paths-tca-formation.webp)

![Figure 3.7: Mass spectrum of anisole. Adapted from NIST chemistry WebBook [33].](https://thumb-eu.123doks.com/thumbv2/123dok_br/16538311.736623/47.892.202.691.719.1055/figure-mass-spectrum-anisole-adapted-nist-chemistry-webbook.webp)
