of Chemical
Engineering
ISSN 0104-6632 Printed in Brazil www.scielo.br/bjce
Vol. 35, No. 03, pp. 1129-1140, July - September, 2018 dx.doi.org/10.1590/0104-6632.20180353s20170216
FRACTIONATION PROCESS OF ESSENTIAL OILS
BY BATCH DISTILLATION
Rafael N. Almeida
1, Rafael de P. Soares
1and Eduardo Cassel
2,*
1 PPGEQ – DEQUI, Universidade Federal do Rio Grande do Sul, Rua Engenheiro Luiz Englert, s/nº - Prédio 12204, 90040-040. Porto Alegre, RS, Brasil. 2 Faculdade de Engenharia, Pontifícia Universidade Católica do Rio Grande do Sul,
Avenida Ipiranga 6681, Pr.30, 90619-900, Porto Alegre, Brasil.
(Submitted: April 24, 2017; Revised: August 4, 2017; Accepted: August 7, 2017)
Abstract - The greatest obstacle in simulating processes involving essential oils is the small number of thermo-physical properties and experimental data available in the literature. In this work, thermodynamic models are investigated in order to predict such properties, which are requisites for the modelling and simulation of the
Eucalyptus essential oil batch distillation processes. A group contribution method was used to predict the vapor pressure (CSGC-PVR) when experimental data were unavailable. Regarding the activity coefficients, a fully predictive model based on quantum calculations (COSMO-SAC) is used. Moreover, this work also uses those predicted properties in a dynamic model, capable of describing the fractionation process by batch distillation. The simulations were performed in the equation-oriented simulator EMSO to demonstrate the feasibility of the proposed method. The proposed method suggests a simulated recovery of a 98.89% eucalyptol fraction from E. globulus and a 98.53% citronellal fraction from E. citriodora.
Keywords:Eucalyptus essential oil, thermodynamic modeling, simulation, COSMO-SAC, dynamic model.
INTRODUCTION
Essential oils are a mixture of terpenes and other volatile compounds, many of them with important industrial applications, in medicine, pharmacology, cosmetics and food industry (Bonaccorsiet al., 2009).
However, if any specific compound has a practical
application, it is desirable to properly separate
the mixture, adding value to the final product.
Eucalyptus citriodora oil contains about 85% of the
monoterpenoids citronellol and citronellal, whereas
Eucalyptus globulus oil contains 70-90% of eucalyptol
(1,8-cineole), another major monoterpenoid (Juergens
et al., 1998). Both citronellol and citronellal are used
as starting materials for the production of fragrances (Bauer et al., 2008). The first is also used in insect
repellents (Guenther, 2013) and the second is effective
against bacterial and fungal infections (Pattnaik et al., 1996; Ramezani et al., 2002). Eucalyptol is widely
used in medicinal, perfumery and flavor preparations
(Babu and Singh, 2009; Baxendale, 2015) and notably it has been reported to present various tumor inhibitory properties (Juergens et al., 1998).
Most terpenes are thermally unstable, decomposing or oxidizing at high temperatures or in the presence of light or oxygen (Simoes, 2001). Batch vacuum
distillation works at lower temperatures and offers flexibility to operate with different mixtures in the
same industrial plant and also the possibility of operating with small volumes (Jimenez et al., 2002; Mujtaba, 2004). The quality of the distillate can be
controlled through manipulation of the reflux ratio, which affects the dynamics of the process (Adari and
Jana, 2008; Garcia et al., 2014; Reid et al., 1987).
The literature is limited about fractionation of essential oil components using batch vacuum distillation. Farah et al. (2006) report the use of fractional distillation to separate components of
Myrtus communis L. without the use of vacuum.
Castillo-Herrera et al. (2007) reported the use of fractional distillation during the hydrodistillation process to obtain Lippia graveolens H.B.K essential oil and to increase the phenolic content. Regarding the modeling and simulation of essential oil fractionation processes, it has received little attention from the
scientific community because of its complexity and highly specific application. Since an essential oil is
a mixture of thermolabile compounds and has little known physical properties, studies on the subject are scarce. Other registered studies treat the distillation process as a step to obtain fractions in order to perform chemical and biological analysis, describing the laboratory scale apparatus, but not considering it as the main objective (Babu and Singh, 2009; Babu and
Kaul, 2007; Castillo‐Herrera et al., 2007; Farah et al.,
2006). Two of them even use the reflux ratio strategy
and are focused on the batch distillation process, but none of them describe the phenomena involved in the process and all the aspects of the phase equilibrium (Beneti et al., 2011; Silvestre et al., 2016).
The essential oil industry is mostly built on a heuristic basis, due to its long tradition and relation to the perfumery industry. The development of tools that could assist the design and project of essential oil fractionation columns is indispensable when one tries to predict the behavior of such complex mixtures. The estimation of physical properties is the crucial step when it comes to the simulation of
essential oil rectification processes, due to the reduced
experimental data available. Thus, this work seeks
to define thermodynamic correlations that describe
the properties required for the calculation of phase
equilibrium, vapor pressure and activity coefficient.
Most of the empirical equations for the vapor pressure are based on integrated forms of the Clausius-Clapeyron relation, varying according to the dependence of the enthalpy of vaporization on temperature, the Antoine equation (Antoine, 1888) being the most widespread of all. However, the parameters for such equations must be estimated by correlation of experimental data and care should be taken when extrapolating these equations. In this way, there are numerous equations based on the theory of corresponding states and group contribution method in order to estimate the vapor pressure (Ambrose and
Walton, 1989; Asher et al., 2002; Pankow and Asher, 2008; Riedel, 1954; Tu, 1994; Wagner, 1973).
The most significant method for the prediction of activity coefficients is the UNIFAC method and
its variations (Fredenslund, 2012). Despite the wide application of this method, it requires a large number of experimental data for the determination of the interaction parameters between each pair of groups. For the application in the present work, parameters for some of the groups and subgroups of the molecules of interest were not found in the literature, preventing the direct use of these models. The COSMO-SAC (Gerber and Soares, 2010) method arises as an alternative for
obtaining the activity coefficient.
On the other hand, the batch distillation process is widely studied and numerous models have been developed, but all these were employed for the separation of well-known mixtures such as petroleum fractions (Galindez and Fredenslund, 1988; Greaves
et al., 2003; Logsdon and Biegler, 1993; Mujtaba and
Macchietto, 1997; Wendt et al., 2000). Therefore, this
work also aims to define a dynamic model, validating
the proposed method by combining the mass balance model and the thermodynamic correlations in order to describe the separation of essential oil constituents by batch vacuum distillation.
METHODOLOGY
Essential oils
For the proposed method, the essential oils
extracted from two different plant species were
selected: Eucalyptus citriodora Hook and Eucalyptus
globulus Labill. These essential oils were chosen due to
their large production and economical potential of the fractions (Batish et al., 2008). The characterizations performed by Maciel et al., (2010) are used as the standard compositions for the two essential oils in this work. Eucalyptus citriodora essential oil has citronellal as the major component, and eucalyptol is the main constituent of Eucalyptus globulus essential oil.
Phase equilibrium
At low pressures, one can perform the calculation
of phase equilibrium using the modified Raoult's law
(Eq. 1) without loss of accuracy, since the vapor phase
behaves as an ideal gas and the effects of non-ideality
in the liquid phase are accounted for by the activity
(1)
where P is the system pressure; yi and xi are the molar fractions in the vapor and liquid phases, respectively. Eq. 1 depends on two main thermodynamic properties, the vapor pressure of pure substances
(
P
i)
sat
and the
activity coefficient of component i in a mixture (γi).
Vapor pressure
The vapor pressure
(
P
i)
satof pure substances is one of the crucial properties of chemical engineering process design. Although the literature contains a large experimental database for most of the usual compounds, the data availability for essential oil constituents is still small, due to its characteristics,
long chains and specific functional groups. This justifies the need of predictive methods to relate the
vapor pressure as a function of temperature for these compounds (Pankow and Asher, 2008).
Li et al. (1994) proposed a method to estimate
the physical properties of pure components by combining the theory of corresponding states with the group contribution method. The feature of this method, referred to as CSGC (Corresponding-States with Group Contribution), is the use of the internal critical properties concept, determined by the group contribution method (Eqs. 2 and 3).
(2)
(3)
The parameters ∆Ti and ∆Pi are estimated by the author and are presented for each functional group in the original work, as well as the constants AT, BT, CT e DT e AP, BP, CP and DP . Once these internal critical properties are obtained, they are applied in the corresponding states method (Eq. 4) to calculate the reduced vapor pressure. Therefore, this method
combines the simplicity and precision of the first
method and the extensive estimation capacity of the second method.
(4)
The CSGC method is capable to estimate numerous physical properties, but since in this paper we only deal with vapor pressure, it will be designated as CSGC-PRV, as presented by the author. This method
has only two input variables; the functional groups of the molecule and its normal boiling temperature (Tb).
Activity coefficient
In this study the COSMO-SAC method (Lin and Sandler, 2002) was employed to calculate activity
coefficients. This method is based on the COSMO
theory (Conductor-like Screening Model) (Klamt, 1995). This model, based on computational quantum
mechanics, allows the prediction of activity coefficients
without any experimental data. COSMO-RS was the
first model of this type proposed by Klamt (1995)
and, since then, various versions have been published aiming at both a greater range of possible applications and higher accuracy of the method. The calculations required for using this kind of models have been implemented in numerous quantum chemistry software packages. In this work the MOPAC (Molecular Orbital Package) (Stewart, 1990) package was used.
Lin and Sandler (2002) proposed a variation of the COSMO-RS, called COSMO-SAC (COSMO
Segment Activity Coefficient). The COSMO-SAC
technique, as well as the COSMO-RS method, use only the molecular structure and its surface charge density determined by COSMO computations to predict the
activity coefficient of substances in mixtures. In the COSMO-SAC model, the activity coefficient can be defined as the result of two contributions (Eq. 5):
(5)
The first contribution is the difference between the
free energies of restoring the charges around the solute molecule in solution S and restoring the charges in a pure liquid i, scaled by an empirical factor β. The
second contribution is the Staverman-Guggenheim (SG) combinatorial term. The residual part accounts
mainly for the effects that arise from energetic
interactions between groups, as the combinatorial part
accounts for size and shape differences in the molecules
(Garber and Soares, 2013). In the present work, this variant of the COSMO-SAC method implemented in the JCOSMO package is used and consists of a Java code developed by Gerber and Soares (2010).
Dynamic model - batch distillation
Simulating the rectification process of a complex
mixture can require a considerable computational
effort. Thereby, the introduction of a few simplifications leads to a reduction in the number of equations and variables, without significant loss of
yiP i iPi
sat \ c
=
/
T* T A B n T C n T D n T
c b T T i i T i i
i M
T i i
i M
i
M 2 3
T T T
= # +
/
+ T/
Y+ T/
Y&( )
, ln( )
P
A B n P C n P D n P
T
101 325
* c
P P i i P i i i
M
P i i M i i M b 2 3
T T T
=
+ + R W+
"
/
/
/
%ln
P
A
ln
T
B
C
T
DT
* * * * r sat r r r 6
= -
+
+
ln
i
G
RT
G
ln
* * S res i res i SG
T
T
accuracy (Mujtaba, 2004). The model implemented in
this work consisted of the differential molar balances
and equilibrium relationships. It takes as fundamental considerations a constant liquid holdup on each tray and in the condenser; negligible vapor holdup and total condensation. These hypotheses generate
constant internal flowrates and eliminate the need to
use hydrodynamic correlations between trays. The vaporization rate is determined as a function of the enthalpy of vaporization and the reboiler composition.
The temperature profile is calculated as a result of
the thermodynamic equilibrium. Other important assumptions are also made, such as the established phase equilibria and perfect tray, reboiler and condenser mixing, adiabatic operation and no sub cooling in the condenser (Domenech and Enjalbert, 1981).
The mass balance for a column with N trays (stages), in reference to a generic compound i in the condenser, can be written as:
(6)
where V is the vapor molar flow rate; HN+1 is the condenser holdup; and yi and xi are the vapor and liquid compositions, respectively. The mass balance for the trays from p=1,2,..,N is given by:
(7)
where Hp is the liquid holdup in the tray p and R is the
reflux ratio. The reboiler and the global mass balances
are described in Eq. 8 and Eq. 9, respectively:
(8)
(9)
The vapor molar flow rate V is constant (Eq. 10) because there is no holdup in both vapor and liquid phases and is determined according to the heat power
Qo supplied to the system:
(10)
The model also incorporates for the vapor and liquid phases the thermodynamic equilibrium relationship (Eq. 1) and the restriction on the composition sums (Eq. 11 and Eq. 12) as follows:
(11)
(12)
The dynamic nature of the batch distillation process implies the withdrawal of distillate cuts, each one determined by a pre-established endpoint (temperature, composition, etc.). At the beginning of the process, the top product is essentially constituted by the most volatile substances. They should be collected in a vessel until their depletion in the mixture. Subsequently, heavier substances will become part of
the top product and must be collected in a different vessel, featuring different cuts in the distillate.
A possible way to mathematically describe the
collection of different cuts in different vessels is via
integrators (Eq. 13), as follows:
(13)
where D is the distillate rate,
D
i Tais the accumulation of component i in the tank Ta and KTa is the tank trigger key. This key is always zero, except for the case where the vessel Ta is collecting the desired fraction. The total accumulation (Eq. 14) and composition (Eq. 15) are calculated based on the accumulation by component:
(14)
(15)
where
x
iTa is the composition of component i in the tankTa and
D
T Tais the total molar accumulation in the tank.
With these indicators, the recovery and the different
cut composition can be computed in the simulator.
A specific cutoff criterion for each processed
mixture should be adopted in order to obtain a product with high purity. In general, the instant composition analysis of the distillate is not possible, but can be inferred from the top temperature of the column, since the two properties are closely related. Thus, the top temperature plateaus are used for making a decision about when the distillate accumulation tanks must be switched.
The enthalpy of vaporization of each substance is obtained directly through the Clausius-Clapeyron relationship valid for moderate pressures and vapor behavior as an ideal gas, since the vapor pressure is known in the desired temperature range. The calculation (Eq. 16) is performed in an external routine and the values entered in the model.
,
y
dt
dx
H
V
x
, , i N Ni N i N
1
1 1
=
-+
+ R + W
(
)
y
y
dt
dx
H
V
R
R
x
x
1
, , , , , i p pi p 1 i p i p 1 i p
=
# --
+
+
+-
&y
dt
dx
S
V
x
R
R
x
x
1
,
, , , ,
i
i i i i
0
0 0 1 0
=
"-
+
+
Q
-
V
dt
dS
R
V
1
=-
+
V
x
h
Q
, i i vap i n 0 1T
=
=o
/
x
i T,1
i n 1
=
=/
y
i T,1
i n 1
=
=/
dx
dD
D x
,k
i Ta
i N 1 Ta
$
$
=
+D
TD
(16)
Simulations
Once the mixture to be separated is defined and
the substances involved are known, the molecules were created in the software Avogadro (Hanwell et al.,
2012), where the molecular structure is first optimized
in order to reach the lowest energy state via the Universal Force Field (UFF) with a steepest descent
algorithm. The file with the atomic coordinates is
then processed by the quantum chemical package MOPAC (Stewart, 1990), screening the surface charge
density which generates a COSMO distribution profile (σ-profile).
The process model was implemented in the generic process simulator EMSO (Soares and Secchi, 2003). EMSO is an equation-oriented process simulator, suitable for dynamic simulations. The thermodynamic properties required for the dynamic model were calculated by the methods described above and loaded into the industrial processes simulator iiSE thermodynamic package, where the creation and edition of substances and properties take place quite
efficiently. A communication plugin is established
between the two programs, so that the properties
are updated dynamically. Thus, the σ-profile and the coefficients for the estimation of the vapor pressure are
inserted to iiSE, which in turn returns the equilibrium data to the EMSO simulator.
The batch distillation model developed in this work, due to its transient nature, requires the liquid molar fractions in each tray as initial conditions.
Since most batch distillation processes start first by putting the column in total reflux until a steady state
is achieved (Mujtaba, 2004), in this work, the model initial conditions are set by submitting the column to
a system of total reflux, establishing the equilibrium
throughout the column. Once the steady state of a total
reflux system is reached, the compositions are stored
and used as a starting point to the separation batch.
The essential oil rectification process simulation
main objective is to determine the total number of fractions, the recovery of each cut and its composition.
For this, a constant reflux ratio, R = 8, was assumed for all experiments, which was defined in accordance with the Mujtaba (2004) recommendation. Different
strategies can be adopted in this regard, but extensive
research is required for an optimum reflux ratio. The
column has 18 trays and a total column holdup of 5%, with constant pressure of 10 kPa.
RESULTS AND DISCUSSION
Vapor Pressure
The first step of this study was the validation of the
predictive method CSGC-PRV used to calculate the vapor pressure of pure compounds. With the exception of compounds with more economic importance, vapor pressure experimental data for most of the compounds required for this work were not found in the literature. The vapor pressure of four substances found in
the eucalyptus essential oils (α-pinene, β-pinene,
citronellol, isopulegol) was compared with the values obtained by the predictive method (CSGC-PRV). All the experimental data were obtained from the NIST Standard Reference Database Number 69, except for isopulegol (Kobe et al., 1941). Figure 1 shows curves for experimental data and CSGC-PRV model data.
The differences between the experimental data
and the values predicted from the CSGC-PRV model reach the maximum of 5.39%, and the maximum absolute error of 3.53 kPa. The results are good, taking into account the complexity of the molecules and the fact that the model uses only the normal boiling temperature and their functional groups. Li et al. (1994)
also indicate the use of this model for compounds with long carbon chains as well as for polar compounds, in accordance with the molecules used in this work. As a demonstration of the accuracy of the method, the authors performed a comparison between other predictive methods, and the CSGC-PRV showed deviations smaller than the Riedel (1954), Vetere (1991) and Gomez-Nieto and Thodos (1977) methods.
Activity coefficient
As for the activity coefficient calculations, to the
best of our knowledge there are no experimental data available for all the components present in eucalyptus essential oils, implying the use of predictive models. However, since all molecules involved have similar
chemical nature, activity coefficients near to an ideal behavior (γ ≈ 1) are expected. Table 1 lists the activity coefficients predicted by the COSMO-SAC method
for the initial composition of two eucalyptus essential oils.
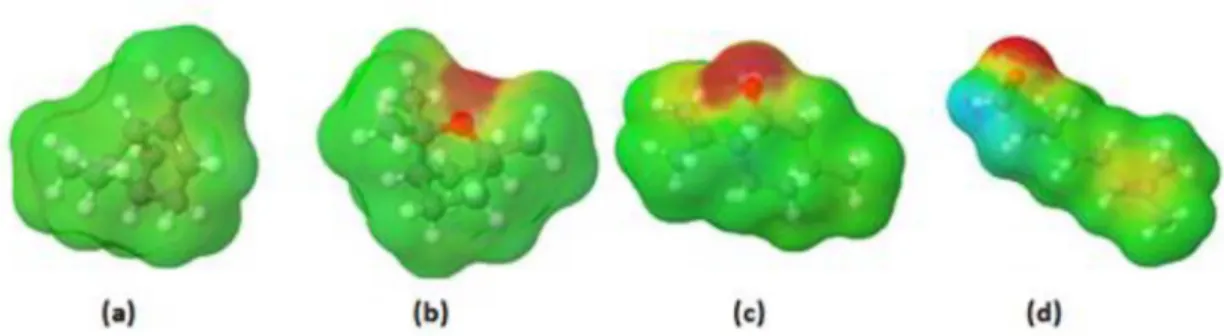
Most of the eucalyptus essential oil constituents
are terpenoids, with different chain sizes, conferring significant differences in their vapor pressures, but still preserving a high chemical affinity. The JCOSMO
program allows the visualization of the charge density surface of the molecule, predicted by the COSMO
dT
dP
RT
P
h
i sat
i
sat vap
2
T
method. The major compounds of eucalyptus essential
oils (α-pinene, eucalyptol, isopulegol, and citronellal)
were selected to illustrate (Figure 2) the charge density surfaces, highlighting the areas where there
are significant surface charge gradients, generating
possible non-idealities in mixture behavior.
Dynamic model - batch distillation
The main objective was to insert all the thermodynamic information in the dynamic model, describing an essential oil batch distillation process. Therefore, the model is initially set without any accumulation tank and a complete batch is simulated in order to determine the temperature levels and the behavior of the top composition. The top temperature
of the column is the criterion adopted for the change of the accumulation tank. Figure 3 shows the
well-defined temperature levels produced by the simulation,
which have been used as a principle for essential oil fractionation.
It should be noted that the temperature profile is
achieved only through the established equilibrium in
each tray. The main cuts are those with a well-defined
and constant temperature plateau, as a representation of the relationship between equilibrium temperature and composition. The temperature transitions
characterize the off-cuts. Once each level is defined
in correspondence with each cut, the simulation is performed again with the tank switching on.
E. globulus oil has an initial composition restricted
to four components (Table 2), as determined by Maciel
et al., (2010), and it was chosen to show the efficiency
of the separation when the original mixture has a main component desired in higher purity. Table 2 shows the results of simulation of E. globulus essential oil, where two main-cuts (MC) and two recycle cuts were obtained (OC). The recovery of MC11 and MC12 cuts was 2.84% and 30.46% of the initial amount of
essential oil, respectively. The other two off-cuts have
variable composition, but from the industrial point of view, they can be treated in a recycle batch. The
recovered oil fractions are rich in α-pinene (98.82%)
and eucalyptol (98.89%), respectively.
Figure 4 shows the evolution of the distillate composition along the batch time for E. globulus
essential oil, and one can note the correlation between
the composition profiles and the temperature levels
in Figure 3. After 25 min a temperature threshold is established, determined by the equilibrium between
limonene and eucalyptol. In the specific case of this
Figure 1. Vapor pressure vs. temperature. Continuous lines: CSGC-PRV model; symbols:
experimental data. (NIST Database; Kobe et al., 1941). (a) Isopulegol (■) and α-pinene (△). (b) β-pinene (+) and citronellol (●).
Table 1. Experimental composition and predicted activity coefficients by COSMOS-SAC method for E. citriodora and E. Globulus experimental oils.
E. citriodora E. globulus
Constituents Mole fraction1
Activity Coeficient2
Mole fraction1
Activity Coeficient2 eucalyptol 0.0194 1.1336 0.8463 1.0004
α-pinene 0.0064 1.3775 0.0419 1.0341
o-cymene - - 0.0296 0.9960
citronellol 0.1446 0.9961 -
-citronellal 0.7126 1.0057 -
-isopulegol 0.0764 1.0354 -
-limonene 0.0041 1.2850 0.0823 1.0199
β-pinene 0.0102 1.3549 -
-myrcene 0.0022 1.2861 -
-
(E)-caryophyllene 0.0171 1.5860 -
-(Z)-β-ocimene 0.0037 1.2195 -
-γ-terpinene 0.0033 1.2337 -
Figure 2. Three-dimensional images of charge density surfaces generated by JCOSMO. (a) α-pinene; (b) eucalyptol;
(c) isopulegol; (d) citronellal.
Figure 3. Temperature vs. time - column top profile for the E. globulus and E. citriadora essential oils.
Simulated conditions: 18 trays, column holdup of 5%, 10 kPa, reflux ratio = 8.
Table 2. Crude oil compositions of E. globulus and major cuts
obtained from the simulation of the fractionation process.
Constituents Initial MC11 OC11 OC12 MC12
eucalyptol 0.8463 0.0019 0.4028 0.8280 0.9889
α-pinene 0.0419 0.9882 0.2237 0.0063
-o-cymene 0.0296 0.0025 0.1002 0.0437 0.0028
limonene 0.0823 0.0075 0.2733 0.1220 0.00827 Recovery - 2.84% 5.48% 55.56% 30.46%
essential oil, these two compounds compete equally, which prevents a higher purity for MC12. The four cuts are represented by vertical bars, of which the
first one corresponds to MC11. The two intermediate
fractions have high potential for recycling.
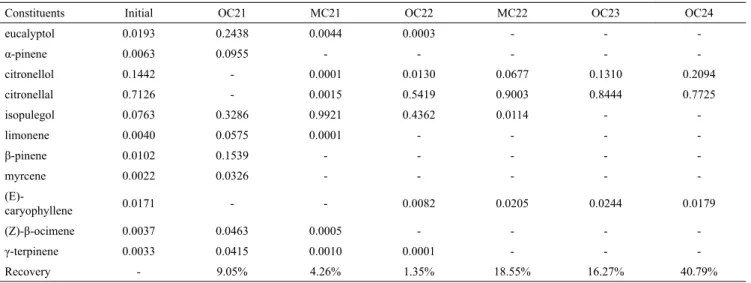
E. citriodora essential oil, a much more complex
mixture with 11 components (Table 3), also determined by Maciel et al., (2010), produced two main-cuts and
four off-cuts. This simulation is intended to show that even a complex mixture can produce cost-effective fractions. The first main-cut obtained represents
4.26% recovery of the initial essential oil with 99.22% isopulegol purity, which could be directly put on the market. Isopulegol is used in the manufacture
of fragrances with blossom compositions; it is also important as an intermediate in the manufacture of menthols (Chuah et al., 2001). Silva et al. (2007) have
also reported depressant and anxiolytic-like effects of
isopulegol.
The other main-cut, with 90.03% citronellal purity and 18.55% recovery, must be redirected to a new batch if a higher concentration is desired. This is a useful strategy and frequently used in order to obtain
Figure 4. Composition vs. time – distillation product of the E.
globulus essential oil. Simulated conditions: 18 trays, column
process in the same column configuration: 18 trays, 5% column holdup and internal reflux ratio equals to 8. The distillate profile of this new batch is shown in
Figure 6, which produces a 98.53% citronellal fraction, recovering 53.09% of this recycle batch feed.
The results show that the vapor pressure is the determining factor in the equilibrium relationships of the mixtures. Due to the similar chemical nature of the compounds, the non-idealities in the liquid phase
(activity coefficient) are a less significant property for
the given essential oils. On the other hand, volatility
differences can be visualized by a parallel with the
product composition at the top of the column in Figures 4 and 5; those with higher volatility (in this case, lower
vapor pressure) are the first components to appear in the composition profile.
In the case of E. globulus oil, α-pinene (C10H16)
presents no oxygenated group, different from
eucalyptol (C10H18O), despite having similar carbon structures. In the case of E. citriodora essential oil,
Figure 5. Composition vs. time – distillation product of E.
citriodora essential oil. Simulated conditions: 18 trays, column
holdup of 5%, 10 kPa, reflux ratio = 8.
Figure 6. Composition vs. time – distillation product of the MC22
recycle batch. Simulated conditions: 18 trays, column holdup of
5%, 10 kPa, reflux ratio = 8.
Table 3. Crude oil compositions of E. citriodora and major cuts obtained from the simulation of the fractionation process.
Constituents Initial OC21 MC21 OC22 MC22 OC23 OC24
eucalyptol 0.0193 0.2438 0.0044 0.0003 - -
-α-pinene 0.0063 0.0955 - - - -
-citronellol 0.1442 - 0.0001 0.0130 0.0677 0.1310 0.2094
citronellal 0.7126 - 0.0015 0.5419 0.9003 0.8444 0.7725
isopulegol 0.0763 0.3286 0.9921 0.4362 0.0114 -
-limonene 0.0040 0.0575 0.0001 - - -
-β-pinene 0.0102 0.1539 - - - -
-myrcene 0.0022 0.0326 - - - -
-
(E)-caryophyllene 0.0171 - - 0.0082 0.0205 0.0244 0.0179
(Z)-β-ocimene 0.0037 0.0463 0.0005 - - -
-γ-terpinene 0.0033 0.0415 0.0010 0.0001 - - -
Recovery - 9.05% 4.26% 1.35% 18.55% 16.27% 40.79%
a high purity compound, such as citronellal used as a precursor in several organic syntheses (Chemat and Esveld, 2001; Lenardao et al., 2007). The off-cuts
OC21 and OC22 can be reused in a single recycle batch to produce eucalyptol and isopulegol. The two
remaining off-cuts, OC23 and OC24, could be added
to the original oil on a next batch, since they have a very similar composition to the crude oil. Table 3 shows the complete composition of all fractions.
Figure 5 shows quite clearly the link between the equilibrium temperatures at the column top in
Figure 3 and the distillate composition profile. Two
plateaus correspond exactly to the greater purity cuts. MC22 does not reach higher values of purity due to a strong competition between the citronellal and citronellol, which have almost identical structure,
differing only by their oxygenated segments.
citronellal (C10H18O) and isopulegol (C10H18O) are
isomers, the first being an aldehyde and the second
an alcohol, a determining factor in the molecular
interactions which significantly changes their vapor
pressure. Thus, the oxygenated groups determine the
volatility differences observed in the system.
The goal of this work was to create a computational tool using a dynamic model to simulate essential oil fractionation. Once this tool is established, there are several strategies to improve both purity and the amount of distillate. The adopted approach enables one to extend the fractioning calculations to other
essential oils, using different operational strategies and column configurations. The simulations presented
for the fractional distillation process of essential oils extend the knowledge, already so well established for
petroleum fractions, to a not yet explored field. The vast majority of the scientific literature on essential oils is based on their different forms of extraction
and biological activities of the compounds obtained. Studies aimed at the processing of these essential oils are still rare, and the lack of thermodynamic properties for their representation is still the biggest restriction. The branch of natural products is one of the fastest growing due to the concern for toxicity in preservatives and synthetic additives in food, cosmetics and hygiene industries, making the development of processing technologies for natural products inherent to this process.
CONCLUSIONS
The predictive method to estimate the vapor pressure of eucalyptus essential oil components was used and proved to be reliable when compared to a few
experimental data previously published. The σ-profiles
were generated for the substances with MOPAC and the COSMO-SAC package produced consistent values
of activity coefficients for the given mixtures. These
predictive thermodynamic models were successfully applied to a batch column dynamic model, generating consistent and promising results with respect to the commercial potential of these products. The E.
globulus simulation allows predicting a high purity
eucalyptol recovery (98.89%) and a small α-pinene
recovery, but still with 98.82%. For E. citriodora
two main-cuts were obtained, isopulegol (99.21%) and citronellal (90.03%). The citronellal cut exposes the situation where the essential oil composition can
vary and different strategies are presented for a higher
composition to be obtained.
ACKNOWLEDGMENTS
The authors are grateful to the Brazilian agency CNPq (Conselho Nacional de Desenvolvimento
Científico e Tecnológico) for the financial support.
NOMENCLATURE
Δhvap enthalpy of vaporization (kJ/mol)
D distillate rate (mol/s)
DiTa Molar holdup of component i in the tank Ta ( - )
DTTa total molar holdup in the Ta ( - )
HN+1 condenser molar holdup ( - ) Hp molar holdup on stage p=1,2..N ( - ) kTa tank Ta activation switch ( - ) M molar mass (g/mol)
N number of theoretical stages ( - ) ni number of moles of component i ( - ) P total system pressure (kPa)
Pc critical pressure (kPa)
Pc* CSGC-PRV internal critical pressure (kPa)
Pisat component i vapor pressure (kPa)
Pr reduced pressure (kPa)
Pr* CSGC-PRV internal reduced pressure ( - )
Pvpr reduced vapor pressure ( - ) Q power supplied to the reboiler (W)
R reflux ratio ( - )
S reboiler molar holdup ( - ) T temperature (K)
Tb normal boiling temperature (K) Tc critical temperature (K)
Tc* CSGC-PRV internal critical temperature (K)
Tr reduced temperature ( - )
Tr *CSGC-PRV internal reduced temperature ( - )
V vapor rate (mol/s)
xi component i mole fraction in the liquid phase ( - ) xi,p liquid phase mole fraction on stage p=1,2..N ( - ) xiTa component i mole fraction in tank Ta ( - )
yi component i mole fraction in the vapor phase ( - ) yi,p vapor phase mole fraction on stage p=1,2..N ( - )
REFERENCES
Adari, P. V. and Jana, A. K., Comparative Control Study of a High-Purity Ternary Batch Distillation. Chem. Prod. Process Model., 3(1), 1934-2659 (2008).
Antoine, M. C., Tensions Des Vapeurs; Nouvelle Relation Entre Les Tensions et Les Températures.
Comptes Rendus des Séances l'Académie des Sci.,
107, 681-684 (1888).
Asher, W. E., Pankow, J. F., Erdakos, G. B., Seinfeld, J. H., Estimating the Vapor Pressures of Multi-Functional Oxygen-Containing Organic Compounds Using Group Contribution Methods. Atmos. Environ., 36(9), 1483-1498 (2002).
Babu, G. D. K. and Singh, B., Simulation of Eucalyptus Cinerea Oil Distillation: A Study on Optimization of 1, 8-Cineole Production. Biochem. Eng. J., 44(2-3), 226-231(2009).
Babu, K. G. D. and Kaul, V. K., Variations in Quantitative and Qualitative Characteristics of Wild Marigold (Tagetes minuta L.) Oils Distilled under Vacuum and at NTP. Ind. Crops Prod., 26(3), 241-251 (2007).
Batish, D. R., Singh, H. P., Kohli, R. K., Kaur, S., Eucalyptus Essential Oil as a Natural Pesticide. For. Ecol. Manage., 256(12), 2166-2174 (2008). Bauer, K., Garbe, D., Surburg, H., Common Fragrance
and Flavor Materials: Preparation, Properties and Uses, John Wiley & Sons (2008).
Baxendale, I. R., A Short Multistep Flow Synthesis of a Potential Spirocyclic Fragrance Component. Chem. Eng. Technol., 38(10), 1713-1716 (2015). Beneti, S. C., Rosset, E., Corazza, M. L., Frizzo, C.
D., Di Luccio, M., Oliveira, J. V., Fractionation of Citronella (Cymbopogon winterianus) Essential Oil and Concentrated Orange Oil Phase by Batch Vacuum Distillation. J. Food Eng., 102(4), 348-354 (2011).
Bonaccorsi, I., Dugo, P., Trozzi, A., Cotroneo, A., Dugo, G., Characterization of Mandarin (Citrus
deliciosa Ten.) Essential Oil. Determination of
Volatiles, Non-Volatiles, Physico-Chemical Indices and Enantiomeric Ratios. Nat. Prod. Commun., 4(11), 1595-1600 (2009).
Castillo‐Herrera, G. A., García‐Fajardo, J. A., Estarrón‐Espinosa, M., Extraction Method That
Enriches Phenolic Content in Oregano (Lippia
graveolens HBK) Essential Oil. J. Food Process
Eng., 30(6), 661-669 (2007).
Chemat, F. and Esveld, E., Microwave Super-Heated
Boiling of Organic Liquids: Origin, Effect and
Application. Chem. Eng. Technol., 24(7), 735-744 (2001).
Chuah, G. .,Liu, S. .,Jaenicke, S., Harrison, L., Cyclisation of Citronellal to Isopulegol Catalysed
by Hydrous Zirconia and Other Solid Acids. J. Catal., 200(2), 352-359 (2001).
Domenech, S. and Enjalbert, M., Program for
Simulating Batch Rectification as a Unit Operation.
Comput. Chem. Eng., 5(3), 181-184 (1981).
Farah, A., Afifi, A., Fechtal, M., Chhen, A., Satrani,
B., Talbi, M., Chaouch, A., Fractional Distillation
Effect on the Chemical Composition of Moroccan
Myrtle (Myrtus communis L.) Essential Oils. Flavour Fragr. J., 21(2), 351-354 (2006).
Fredenslund, A., Vapor-Liquid Equilibria Using UNIFAC: A Group-Contribution Method, Elsevier, (2012).
Galindez, H. and Fredenslund, A. A., Simulation of Multicomponent Batch Distillation Processes. Comput. Chem. Eng., 12, 281-281 (1988).
Garcia, A. N., Loria, J. C. Z., Marin, A. R., Quiroz, A. V. C., Simple multicomponent batch distillation
procedure with a variable reflux policy. Braz. J.
Chem. Eng., 31(2), 531-542 (2014).
Gerber, R. P. and Soares, R. de P. , Prediction of
Infinite-Dilution Activity Coefficients Using
UNIFAC and COSMO-SAC Variants. Ind. Eng. Chem. Res., 49(16), 7488-7496 (2010).
Gerber, R. P. and Soares, R. P., Assessing the reliability
of predictive activity coefficient models for
molecules consisting of several functional groups. Braz. J. Chem. Eng., 30(1), 1-11 (2013).
Gomez‐Nieto, M. and Thodos, G., Generalized
Treatment for the Vapor Pressure Behavior of Polar
and Hydrogen‐bonding Compounds. Can. J. Chem.
Eng., 55(4), 445-449 (1977).
Greaves, M. A., Mujtaba, I. M., Barolo, M., Trotta, A., Hussain, M. A., Neural-Network Approach to Dynamic Optimization of Batch Distillation: Application to a Middle-Vessel Column. Chem. Eng. Res. Des., 81(3), 393-401 (2003).
Guenther, E., The Essential Oils-Vol 1: History-Origin in Plants-Production-Analysis, Read Books Ltd, (2013).
Hanwell, M. D., Curtis, D. E., Lonie, D. C., Vandermeersch, T., Zurek, E., Hutchison, G. R. Avogadro: An Advanced Semantic Chemical Editor, Visualization, and Analysis Platform. J. Cheminformatics, 4(1), 1-17 (2012).
Jiménez, L., Basualdo, M.S., Gómez, J.C., Toselli, L., &Rosa, M., Nonlinear dynamic modeling of multicomponent batch distillation: a case study. Braz. J. Chem. Eng.,19(3), 307-317 (2002).
Juergens, U. R., Stöber, M., Schmidt-Schilling, L.,
of Euclyptol (1.8-Cineole) in Bronchial Asthma: Inhibition of Arachidonic Acid Metabolism in Human Blood Monocytes Ex Vivo. Eur. J. Med. Res., 3, 407-412 (1998).
Juergens, U. R., Stöber, M., Vetter, H., Inhibition of Cytokine Production and Arachidonic Acid Metabolism by Eucalyptol (1.8-Cineole) in Human Blood Monocytes in Vitro. Eur. J. Med. Res., 3, 508-510 (1998).
Klamt, A., Conductor-like Screening Model for Real Solvents: A New Approach to the Quantitative Calculation of Solvation Phenomena. J. Phys. Chem., 99(7), 2224-2235 (1995).
Kobe, K. A., Okabe, T. S., Ramstad, M. T., Huemmer, P. M. P-Cymene Studies., VI. Vapor Pressure of p-Cymene, Some of Its Derivatives and Related Compounds. J. Am. Chem. Soc., 63(12), 3251-3252 (1941).
Lenardão, E. J., Botteselle, G. V., de Azambuja, F., Perin, G., Jacob, R. G., Citronellal as Key Compound in Organic Synthesis. Tetrahedron, 63(29), 6671-6712 (2007).
Li, P., Ma, P.-S., Yi, S.-Z., Zhao, Z.-G., Cong, L.-Z., A New Corresponding-States Group-Contribution Method (CSGC) for Estimating Vapor Pressures of Pure Compounds. Fluid Phase Equilib., 101, 101-119 (1994).
Lin, S.-T. and Sandler, S. I., A Priori Phase Equilibrium Prediction from a Segment Contribution Solvation Model. Ind. Eng. Chem. Res., 41(5), 899-913 (2002).
Logsdon, J. S. and Biegler, L. T., Accurate
Determination of Optimal Reflux Policies for the
Maximum Distillate Problem in Batch Distillation. Ind. Eng. Chem. Res., 32(4), 692-700 (1993). Maciel, M. V,Morais, S. M., Bevilaqua, C. M. L.,
Silva, R. A., Barros, R. S., Sousa, R. N., Sousa, L. C., Brito, E. S., Souza-Neto, M. A., Chemical Composition of Eucalyptus Spp. Essential Oils
and Their Insecticidal Effects on Lutzomyia
Longipalpis. Vet. Parasitol., 167(1), 1-7 (2010).
Mujtaba, I. M. Batch Distillation, Imperial College Press, (2004).
Mujtaba, I. M. and Macchietto, S., Efficient
Optimization of Batch Distillation with Chemical Reaction Using Polynomial Curve Fitting Techniques. Ind. Eng. Chem. Res., 36(6), 2287-2295 (1997).
Pankow, J. F. and Asher, W. E., SIMPOL.1: A Simple Group Contribution Method for Predicting Vapor Pressures and Enthalpies of Vaporization of
Multifunctional Organic Compounds. Atmos. Chem. Phys., 8(1), 2773-2796 (2008).
Pattnaik, S., Subramanyam, V. R., Bapaji, M., Kole, C. R., Antibacterial and Antifungal Activity of Aromatic Constituents of Essential Oils. Microbios, 89(358), 39-46 (1996).
Ramezani, H., Singh, H. P., Batish, D. R., Kohli, R. K., Antifungal Activity of the Volatile Oil of
Eucalyptus Citriodora. Fitoterapia, 73(3), 261-262
(2002).
Reid, R. C., Prausnitz, J. M., Poling, B. E., The Properties of Gases and Liquids. McGraw Hill, New York (1987).
Riedel, L., Eine Neue Universelle Dampfdruckformel Untersuchungen Über Eine Erweiterung Des Theorems Der Übereinstimmenden Zustände. Teil I. Chemie Ing. Tech., 26(2), 8-893 (1954).
Silva, M. I. G., de Aquino Neto, M. R., Teixeira Neto, P. F., Moura, B. A., doAmaral, J. F., de Sousa, D. P., Vasconcelos, S. M. M., de Sousa, F. C. F., Central Nervous System Activity of Acute Administration of Isopulegol in Mice. Pharmacol. Biochem. Behav., 88(2), 141-147 (2007).
Silvestre, W. P., Agostini, F., Muniz, L. A. R., Pauletti, G. F., Fractionating of Green Mandarin
(Citrus deliciosa Tenore) Essential Oil by Vacuum
Fractional Distillation. J. Food Eng., 178, 90-94 (2016).
Simoes, C. M. O., Farmacognosia: Da Planta Ao Medicamento, UFRGS, Florianópolis: UFSC, (2001).
Soares, R. de P. andSecchi, A. R., EMSO: A New Environment for Modelling, Simulation and Optimisation. Comput. Aided Chem. Eng., 14, 947-952 (2003).
Stewart, J. J. P., MOPAC: A Semiempirical Molecular Orbital Program. J. Comput. Aided. Mol. Des., 4(1), 1-103 (1990).
Tu, C.-H., Group-Contribution Method for the Estimation of Vapor Pressures. Fluid Phase Equilib., 99, 105-120 (1994).
Vetere, A., The Riedel Equation. Ind. Eng. Chem. Res., 30(11), 2487-2492, (1991).
Wagner, W., New Vapour Pressure Measurements for Argon and Nitrogen and a New Method for Establishing Rational Vapour Pressure Equations. Cryogenics (Guildf)., 13(8), 470-482 (1973). Wendt, M., Li, P., Wozny, G., Batch Distillation