Food Science and Technology
DOI:
D httpsI://doi.org/10.1590/fst.32517
OSSN 1678-457X (Dnline)
1 Introduction
Anthocyanins are a group of water-soluble blue, purple and red-colored pigments (Ognat et al., 2011). On the industry, there is a growing interest in these flavonoids due to their potential as a natural colorant and antioxidant capacity. Regular consumption of anthocyanin-containing foods has been associated with the prevention of degenerative (Ognat et al., 2011), cardiovascular diseases and cancer (Caridi et al., 2007).
On plants, anthocyanins play a protective role, protecting them from UV light, pathogens and oxidative damages (Caridi et al., 2007). They may be present in all tissues of the plant, including leaves, stems, roots, flowers and fruits and accumulate gradually during development. The anthocyanins content varies widely depending on the species, variety, environmental factors and growth, and storage conditions (Caridi et al., 2007). The maximum content is observed at harvest time and, during senescence, there is a reduction of this pigment (Chen et al., 2015).
The quantification of anthocyanins may be interesting for determining the harvesting point of the vegetables (Chen et al., 2015) as well as for industries and rural producers to evaluate the quality of fresh and processed products (Poiana et al., 2012), since their quality is directly related to the content of this pigment and other phenolic compounds present. A number of techniques can be used to determine the anthocyanin content of plants, including UV-visible spectrophotometry (Lees & Francis, 1972), mass spectrometry (Vera de Rosso et al., 2008) and nuclear magnetic resonance (NMR) (Ella Missang et al., 2003). However, some of these techniques require high preparation time, high cost and
specialized reagents. The biological properties of anthocyanins and their health benefits are increasingly intensifying efforts to discover and optimize methods of extraction, quantification and identification in natural sources using comprehensive and rapid methods (Ognat et al., 2011; Pappas et al., 2011).
The use of colorimeters has been considered an important tool for the quantification of anthocyanins (Heredia et al., 1998). The color measurement can be used as an indirect way of analyzing the colored components of a food product, since it is simpler and faster compared to the chemical analyses (Alves et al., 2008). Some studies demonstrate a correlation between the color measurements of the COELAB system, which determine a three-dimensional color space and represent the color stimulus as an achromatic signal (L*) and two chromatic channels representing blue-yellow (b*) and red-green (a*), and the presence of bioactive compounds such as carotenoids, anthocyanins and other phenolics, betalaine and chlorophyll in plants (Sant’Anna et al., 2013).
Studies involving the correlation of the anthocyanin content with the color of some fruits and anthocyanin content prediction using an infrared spectroscopy model system (Pappas et al., 2011; Chen et al., 2015; Montes et al., 2005), have already been done, however, studies related to the prediction of the anthocyanin content in fruits and vegetables using colorimetry were not found. Thus, the objective of this work was to develop prediction models for anthocyanin content of 13 fresh fruits and vegetables using L*, a*, b*, C* and h* values of the colorimeter.
Chromatic analysis for predicting anthocyanin content in fruits and vegetables
Luciana Marques VOEORA1, Letícia Mafle Guimarães MARONHD1, Juliana de Cássia Gomes RDCHA1*, Frederico Augusto Ribeiro BARRDS1, Paulo César STRONGHETA1
Received 28 Sept., 2017 Accepted 27 May, 2018
1 Departamento de Tecnologia de Alimentos, Universidade Federal de Viçosa, Viçosa, MG, Brasil
*Corresponding authorI: [email protected]
Abstract
The objective of this study was to develop simple mathematical models for the prediction of the total anthocyanin content of fruits and vegetables, using colorimetry. Phenolic extracts of 13 species of fruits and vegetables were produced using 70% acidified ethanol and 70% ethanol. The quantification of the total anthocyanins of the extracts was performed by the spectrophotometric method, and the color characterization was done through the tristimulus colorimeter. The correlation between the L* value and the anthocyanin content was high (r = - 0.95) for extracts produced with 70% ethanol and diluted 20 times. Linear equations based on colorimetric coordinates, with R2 from 0.80 to 0.99, were obtained using 70% ethanol and 70% acidified ethanol as extraction solvent, with or without dilutions. Therefore, colorimetry, as a rapid method that does not involve the use of specific solvents, can be used to predict the total anthocyanin content of fruits and vegetables.
Keywords: anthocyanins; colorimetry; mathematical models; fruits and vegetables.
2 Material and Methods
2.1 Fruits and vegetables used in the study
Samples of jabuticaba (Myrciaria jaboticaba), camu-camu (Myrciaria dubia), plum (Prunus salicina), raspberry (Rubus idaeus), strawberry (Fragaria sp,), red pitaya (Hylocereus undatus), jussara (Euterpe edulis), blueberry (Vaccinium myrtillus), blackberry (Morus nigra), red globe grape (Vitis vinífera), eggplant (Solanum melongena) and purple cabbage (Brassica oleracea) were obtained from the Viçosa, Minas Gerais, Brazil, retailer from January to June 2016. Açaí fruits (Euterpe oleracea) were obtained in Belém, Pará, Brazil. After collection, the fruits were immediately evaluated, except the açaí fruit, which was frozen and transported by air to the analysis laboratory.
2.2 Phenolic extraction and total anthocyanins determination
Phenolic extracts (extracts rich in phenolic compounds) were obtained fromI: skins of the plum, eggplant, grape and jabuticaba; pulp of the red pitaya; purple cabbage leaves; and whole fruits of the blackberry, camu camu, raspberry, blueberry, strawberry, açai and jussara.
The phenolic extract of each fruit or vegetable was obtained from 5 g of the ground material with 50 mL of solvent. On the case of jussara and açai, 25 g of the whole fruit was macerated with 50 mL of solvent. Two solvents were usedI: 70% ethanol solution with 1.5 mol·L-1 HCl (85I:15, v/v) and 70% ethanol. The suspension was allowed to stand in the absence of light and under refrigeration (7 ± 1 °C) for 24 hours. After 24 hours, the samples were filtered on Whatman No. 1 paper under vacuum in a Buchner funnel and the volume was completed to 50 mL.
The quantification of total anthocyanins in the phenolic extracts was done using a SHOMADZU spectrophotometer (UV-1601PC, Kyoto, Japan), according to the method proposed by (Lees & Francis, 1972). The extracts were subjected to a reading in a spectrophotometer at 535 nm and the total anthocyanin content was obtained using the Equation 1 C’ = (A x FD) / (ℇ x b), where C’I: total anthocyanin content (mg. L-1); AI: absorbance (535 nm); ℇI: absorbance coefficient of cyanidines (98.2); bI: thickness of the cuvette (1 cm); FDI: dilution factor of the extract. The total anthocyanin content was expressed in mg.100 mL-1 of extract.
For each evaluated species 5 replicates were made and, for each replicate, approximately 100 g of the material was ground. The analyses were performed in duplicate.
2.3 Colorimetric characterization of the phenolic extracts
The color characterization of each phenolic extract, obtained with 70% acidified ethanol and 70% ethanol, was performed in a ColorQuest XE colorimeter (Spera, Hunter Lab, Reston) under D65 illuminant and Hunterlab’s Universe software. L* (luminosity), a* (intensity of red and green) and b* (intensity of yellow and blue) were read by reflectance. The hue (h*) value was calculated using the Equation 2 h* = arctan (b*/a*) and the saturation (C*) value was calculated using the Equation 3 C* = *2 *2
a +b from
the values of a* and b*.
2.4 Correlations between anthocyanin content and colorimetric coordinates
Phenolic extracts from the 13 species of fruits and vegetables obtained with the two extraction solvents (70% acidified ethanol and 70% ethanol) were used. Phenolic extracts were diluted 2, 5, 10 and 20 times. The L*, a* and b* values of the colorimetric measurement and the C* and h* values were obtained for all phenolic extracts.
The correlation between the L*, a*, b*, C* and h* values and the total anthocyanin content was determined by the Pearson correlation (r). To find r value, it was assessed for each solvent (70% acidified ethanol and 70% ethanol) and for each dilution (2, 5, 10 and 20 times), all 5 replicates, or, in other words, 65 phenolic extracts obtained from the 13 fruits and vegetables.
2.5 Development of prediction models
Linear regression models were found according to Equation 4I:
1 1 2 2 3 3 4 4 5 5
Y=βo+βX +β X +βX +β X +βX (4)
WhereI: being Y the response function of the experimental data for the total anthocyanin content; X1, X2, X3, X4 e X5 are independent variables corresponding to L*, a*, b*, C* and h* colorimetric coordinates respectively, and β are the estimated coefficients adjusted to the anthocyanin content of the phenolic extracts obtained with 70% acidified ethanol and 70% ethanol, diluted 2, 5, 10 and 20 times, with the colorimetric coordinates. On order to obtain the models, mean values of total anthocyanins and colorimetric parameters of 65 phenolic extracts obtained from the 13 fruits and vegetables were used.
2.6 Statistical Analysis
The mean content of total anthocyanins for the two extraction solvents was compared using the F test, p <0.05. Correlations between L*, a* and b* coordinates of the colorimetric measurement and C* and h* parameters with the total anthocyanin content, determined by the Pearson correlation (r), and the multiple linear regression models used to predict the content of anthocyanins were obtained by the Stepwise method using the OBM SPSS software (V. 21.0, OBM Corp. Released 2012).
3 Results and discussion
3.1 Total anthocyanin content
reducing the risk to the manipulator and the contamination of the environment.
Solvent acidification increased anthocyanins extraction efficiency for some fruits and vegetables. The increase in anthocyanin content was 1.2, 1.6, 5.8 and 30 times for raspberry, plum, eggplant and purple cabbage (Table 1), respectively, suggesting that denaturation of cell membranes, either by physical or chemical constitution, is difficult in these species, or that the anthocyanins are more strongly adhered to the vacuoles of the cells. On the case of purple cabbage, this large increase in the extraction with the acidification of the extraction solvent has already been demonstrated by Chandrasekhar et al. (2012). Moreover, the stability of the anthocyanins increases with the decrease of the pH of the medium.
Acidification of the extraction solvent at pH 2 was not efficient for the release of a greater content of anthocyanins from the vacuoles of the cells of açaí, jussara, blueberry, blackberry, camu-camu, red pitaya, strawberry, Red Globe grapes and jabuticaba. For the last six, the content of anthocyanins in the phenolic extract was lower when using acidified ethanol. Acidification may be necessary to promote denaturation of cell membranes with subsequent release of anthocyanins present in the vacuole of some plant species (Rodriguez-Saona & Wrolstad, 2001), however, it is necessary to know the behavior of different species for an efficient extraction. Ot has been reported that the extraction of acylated anthocyanins under acidic conditions may cause their total or partial hydrolysis (Revilla et al., 1998) and the extraction efficiency may be related to the type of acid used (Montes et al., 2005). Pompeu et al. (2009) have shown that the use of 70-80% (v/v) ethanol as the extracting solvent containing 0.065 and 0.074 mol·L-1 of hydrochloric acid increases the extraction efficiency of the total phenolics and total anthocyanins of açaí fruit. However, in our work, there was no effect of acidification
of the solvent (70% ethanol) with hydrochloric acid at pH 2.0 in the extraction of anthocyanins from these fruits.
Fruits and vegetables can be divided into three large groups according to the aglycone bound to the C15 skeleton of the anthocyanin moleculeI: pelargonidin, cyanidin/peonidine and a group of multiple anthocyanins. All anthocyanins are soluble in polar solvents, and the use of water added to the solvent facilitates the extraction of more hydrophilic anthocyanins (Fuleki & Francis, 1968). Additionally, the use of water as extracting solvent for anthocyanins may be efficient for some species that contain a large amount of water in their constitution, such as cherries (Grigoras et al., 2012). Dn the other hand, the use of acidified solvents to extract anthocyanins can produce proanthocyanidins and flavanols, which may result in an overestimation of the total anthocyanins, as discussed in the study done by Revilla et al. (1998). Despite these drawbacks, many authors continue to use extraction with solvents containing hydrochloric acid to extract anthocyanins from a variety of sources (Montes et al., 2005; Fan et al., 2008; Teixeira et al., 2008; Zanatta et al., 2005; Dai et al., 2009; Patil et al., 2009; Pompeu et al., 2009).
Thus, based on the literature and results of this study, the acidification of the extraction solvent is not always necessary to increase extraction efficiency of anthocyanins, however, the acidification is important in order to improve the stability of anthocyanins from fruits and vegetables.
3.2 Colorimetric characterization of the phenolic extracts
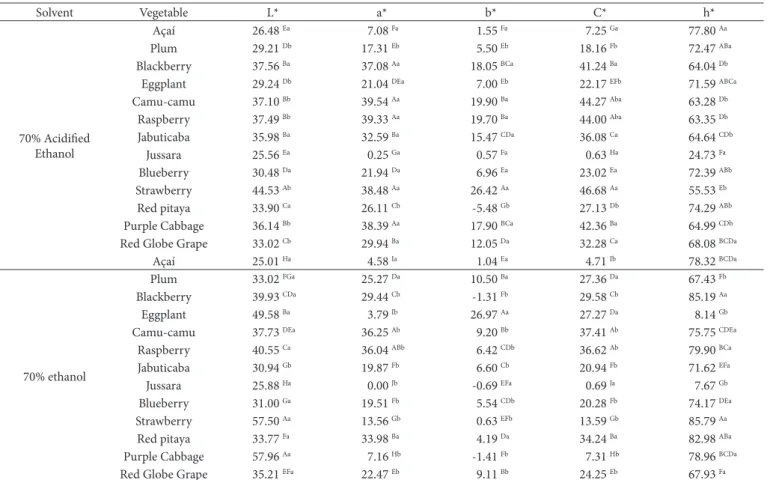
The colorimetric parameters (L*, a*, b*, C and h*) allowed the characterization of the color of each phenolic extract, without dilutions. The values of L* ranged from 44.53 (strawberry) to 25.56 (jussara), and from 25.01 (açaí) to 57.96 (purple cabbage) in extracts produced with acidified ethanol and 70% ethanol, respectively. On general, higher L* values, a parameter related to light transmission, were obtained for the phenolic extracts
Table 1. Minimum, maximum and average total anthocyanins content, among the five replications, in the phenolic extracts of the fruits and vegetables studied, for two extraction solvents.
Vegetal
Anthocyanin content (mg·100 mL-1 of the extract)
70% acidified ethanol 70% ethanol
Mina Maxb AVERAGE Mina Maxb AVERAGE
Açaí 6.10 11.87 8.35 4.64 9.15 6.88 ns
Plum 11.60 12.15 11.80 6.92 7.19 7.06 *
Blackberry 2.53 2.78 2.64 2.61 4.53 3.85 *
Eggplant 3.44 3.81 3.65 0.54 0.71 0.63 *
Camu-camu 0.29 4.20 3.73 4.10 4.68 4.39 *
Raspberry 3.44 3.68 3.59 2.32 3.15 2.83 *
Jabuticaba 5.24 6.52 6.08 7.48 8.75 7.97 *
Jussara 287.84 346.91 325.86 244.39 338.08 288.11 ns
Blueberry 6.53 11.36 8.60 5.77 8.46 7.08 ns
Strawberry 0.68 0.70 0.70 1.08 1.13 1.10 *
Red pitaya 0.56 1.37 0.76 2.44 2.57 2.50 *
Purple Cabbage 5.94 7.11 6.54 0.21 0.23 0.22 *
Red Globe Grape 5.75 6.26 6.00 7.10 8.40 7.66 *
produced with 70% ethanol, compared to the extracts produced with acidified ethanol (darker extracts) (Table 2). The lowest L* values (darkest extracts) were observed for phenolic extracts obtained from açaí and jussara fruits (Table 2). The L* coordinate represents how light or dark the sample presents itself, with values ranging from 0 (totally black) to 100 (totally white). The increase of the L* value with the increase of the pH can be related to the change in the form of the anthocyanins present in the phenolic extracts (Heredia et al., 1998; Montes et al., 2005).
The high L* value obtained with the strawberry phenolic extract, for both solvents, confirmed the low concentration of anthocyanins in the extracts. On the case of purple cabbage, lower L* values were obtained with the phenolic extracts produced with acidified solvent compared to 70% ethanol, suggesting a darker extract (i.e. more concentrated). This result confirms the higher efficiency of acidified ethanol extraction for purple cabbage, confirming the higher content of anthocyanins measured in the extract, as already observed in Table 1.
The a* coordinate can assume values from -80 (green) to +100 (red) (Alves et al., 2008). On this study, higher a* values (+0.25 to +39.54) were obtained in extracts produced with 70% acidified ethanol. The a* values for the jussara phenolic
extracts were the lowest observed for both solvents. This fact can be explained by the high concentration of anthocyanins in the jussara fruit phenolic extract (Table 1).
Numerous processes, including pH, may affect the color and stability of anthocyanins potentially leading to changes in the nutraceutical properties of bioactive compounds (Sant’Anna et al., 2013). These pigments are subject to chemical transformations in aqueous medium in the fundamental state. On an acidic medium, anthocyanins are in the form of ozone salts with a bright-red color. As the pH increases to neutral, they tend to have a quinoidal structure with a purple coloration and in alkaline medium, their hue changes to blue (Giusti & Wrolstad, 2001), suggesting that the change in the structure of the anthocyanins and the color change of the product can be measured by colorimetric techniques (Sant’Anna et al., 2013).
The effect of pH on the color of anthocyanins was visually observed with purple cabbage (data not shown). The phenolic extracts of this vegetable when acidified showed intense red color and, when not acidified, they tended to purple. This observation confirms the data obtained for the a* coordinate of the colorimetric measurement when comparing the two extraction solvents, since the a* value obtained in the phenolic extracts produced with
Table 2. Mean colorimetric coordinates of the phenolic extracts from fruits and vegetables, obtained with two extraction solvents (70% acidified ethanol and 70% ethanol), without dilutions.
Solvent Vegetable L* a* b* C* h*
70% Acidified Ethanol
Açaí 26.48 Ea 7.08 Fa 1.55 Fa 7.25 Ga 77.80 Aa
Plum 29.21 Db 17.31 Eb 5.50 Eb 18.16 Fb 72.47 ABa
Blackberry 37.56 Ba 37.08 Aa 18.05 BCa 41.24 Ba 64.04 Db
Eggplant 29.24 Db 21.04 DEa 7.00 Eb 22.17 EFb 71.59 ABCa
Camu-camu 37.10 Bb 39.54 Aa 19.90 Ba 44.27 Aba 63.28 Db
Raspberry 37.49 Bb 39.33 Aa 19.70 Ba 44.00 Aba 63.35 Db
Jabuticaba 35.98 Ba 32.59 Ba 15.47 CDa 36.08 Ca 64.64 CDb
Jussara 25.56 Ea 0.25 Ga 0.57 Fa 0.63 Ha 24.73 Fa
Blueberry 30.48 Da 21.94 Da 6.96 Ea 23.02 Ea 72.39 ABb
Strawberry 44.53 Ab 38.48 Aa 26.42 Aa 46.68 Aa 55.53 Eb
Red pitaya 33.90 Ca 26.11 Cb -5.48 Gb 27.13 Db 74.29 ABb
Purple Cabbage 36.14 Bb 38.39 Aa 17.90 BCa 42.36 Ba 64.99 CDb
Red Globe Grape 33.02 Cb 29.94 Ba 12.05 Da 32.28 Ca 68.08 BCDa
Açaí 25.01 Ha 4.58 Oa 1.04 Ea 4.71 Ob 78.32 BCDa
70% ethanol
Plum 33.02 FGa 25.27 Da 10.50 Ba 27.36 Da 67.43 Fb
Blackberry 39.93 CDa 29.44 Cb -1.31 Fb 29.58 Cb 85.19 Aa
Eggplant 49.58 Ba 3.79 Ob 26.97 Aa 27.27 Da 8.14 Gb
Camu-camu 37.73 DEa 36.25 Ab 9.20 Bb 37.41 Ab 75.75 CDEa
Raspberry 40.55 Ca 36.04 ABb 6.42 CDb 36.62 Ab 79.90 BCa
Jabuticaba 30.94 Gb 19.87 Fb 6.60 Cb 20.94 Fb 71.62 EFa
Jussara 25.88 Ha 0.00 Jb -0.69 EFa 0.69 Ja 7.67 Gb
Blueberry 31.00 Ga 19.51 Fb 5.54 CDb 20.28 Fb 74.17 DEa
Strawberry 57.50 Aa 13.56 Gb 0.63 EFb 13.59 Gb 85.79 Aa
Red pitaya 33.77 Fa 33.98 Ba 4.19 Da 34.24 Ba 82.98 ABa
Purple Cabbage 57.96 Aa 7.16 Hb -1.41 Fb 7.31 Hb 78.96 BCDa
Red Globe Grape 35.21 EFa 22.47 Eb 9.11 Bb 24.25 Eb 67.93 Fa
acidified ethanol was 5 times higher than the a* value produced without acidification.
The b* coordinate can range from -50 (blue) to +70 (yellow) (Alves et al., 2008). On this study, b* values varied from -5.48 to 26.42 (for 70% acidified ethanol) and from -1.41 to 26.97 (for 70% ethanol) (Table 2). Comparing the two extraction solvents for the same studied vegetable, phenolic extracts produced with 70% acidified ethanol showed, in general, higher b* values, indicating a greater tendency of the extracts to yellow coloration in detriment to the blue coloration.
The hue (h*) characterizes the color quality, allowing it to be differentiated, varies from 0 to 360º. On the phenolic extracts produced with 70% ethanol, the h* value ranged from 24.73 (jussara) to 77.80 (açaí); While in their acidified phenolic extracts, the h* value ranged from 7.67 (jussara) to 85.79 (strawberry) (Table 2). The h* value for the phenolic extracts, regardless of the solvent, ranged from 0 to 90º, confirming their red to yellowish-red coloration.
Chroma (C*) or color saturation indicates whether the colors of the phenolic extracts are stronger or lighter depending on the solvent. Greater differences in C* values were observed for the phenolic extracts of strawberry and purple cabbage when compared to the two extraction solvents. On the case of purple cabbage, the C* values confirm the visual observation that phenolic extracts produced with 70% ethanol were darker (tending to purple) and phenolic extracts produced with acidified ethanol were lighter (tending to red). This difference was also observed for the anthocyanin content in the extracts, since the content increased from 0.22 mg / 100 mL to 6.54 mg / 100 mL when the acidification of the solvent was performed. For the strawberry, phenolic extracts obtained with ethanol 70% showed a C* value of 3.5 times smaller than that obtained with acidified ethanol. This result suggests a possible correlation between C* and anthocyanin content of the phenolic extracts obtained from the 13 species studied. The reduction of C* value with the increase of pH (from 1.5 to 5), was observed in phenolic extracts of grape skins (Heredia et al., 1998). The increase of pH led to
the reduction of C* values of phenolic extracts obtained from Chinese bayberry (Myrica rubra) (Bao et al., 2005).
Differences between C* and h* with solvent acidification were found, suggesting qualitative and quantitative differences between the anthocyanins present in the phenolic extracts. The C* value is the quantitative component of chromaticity, and the hue (h*) value, the qualitative. Quantitative differences in the phenolic extract of jabuticaba changing the extraction solvent were observed by Montes et al. (2005).
3.3 Correlations between total anthocyanin content and colorimetric coordinates
High correlations between the color measurements L*, a*, b*, C* and h*, and the total anthocyanin content in the phenolic extracts (with and without dilutions) obtained from 13 fruits and vegetables were observed Table 3. L* values were higher as dilution increased (2, 5, 10 and 20 times). A low variation in the a* value was observed among the phenolic extracts, diluted or not, with 70% acidified ethanol. On general, b* values were higher in the phenolic extract without dilution, and reduced as the dilutions increased, indicating a tendency to the blue color.
The anthocyanins content is strongly correlated, r above 0.9, to the L* coordinate for phenolic extracts produced with 70% ethanol and diluted 20 times (Table 3). According to Sant’Anna et al. (2013), the change in L* values is a good indicator of the alteration in the polyphenol content.
Ot is known that methods with high correlation can be used interchangeably, without affecting the interpretation of the results, because they bring similar information. This high correlation between the total anthocyanin content and the L* coordinate indicates that colorimetry can be an important tool for the prediction of the anthocyanin content of fruits and vegetables.
The negative r value found for L* correlation and the total anthocyanin content indicates that high L* values are related to low anthocyanin values, thus, low L* values are desirable because they are related to more efficient anthocyanin extractions.
Table 3. Colorimetric coordinates (Mean of 13 samples ± standard deviation) and Pearson Correlation (r) between the L* (r1), a* (r2), b* (r3), C* (r4) and h* (r5) coordinates, and the total anthocyanin content of 13 fruits and vegetables for both extraction solvents (70% acidified ethanol and 70% ethanol) and the dilutions (2, 5, 10 and 20 times).
SDLVENT PHENDLOC
EXTRACTS L* r1 a* r2 b* r3 C* r4 h* r5
Acidified (HCl) 70% ethanol
Without dilution 33.59 ± 1.47 -0.47** 26.85 ± 3.56 -0.63** 11.11 ± 2.61 -0.37** 29.75 ± 1.81 -0.60** 64.30 ± 1.66 -0.85** 1I:2 37.68 ± 1.85 -0.52** 32.04 ± 3.31 -0.76** 11.24 ± 2.46 -0.37** 34.74 ± 1.60 -0.75** 68.79 ± 0.69 0.64** 1I:5 43.38 ± 2.44 -0.56** 35.15 ± 3.59 -0.61** 7.06 ± 2.88 0.39** 38.44 ± 2.32 0.01 75.92 ± 1.64 -0.30* 1I:10 48.71 ± 2.73 -0.60** 33.16 ± 3.70 -0.35** -1.19 ± 1.82 0.25* 33.78 ± 1.61 -0.36** 78.14 ± 0.98 -0.11 1I:20 54.50 ± 2.75 -0.73** 26.29 ± 3.37 -0.03 -3.75 ± 1.54 0.62** 27.07 ± 1.49 -0.01 75.53 ± 1.11 -0.10
70% Ethanol
Without dilution 38.31 ± 2.98 -0.37** 19.38 ± 3.52 -0.44** 5.90 ± 2.10 -0.25* 21.87 ± 1.47 -0.52** 66.15 ± 3.24 -0.65** 1I:2 45.44 ± 3.32 -0.51** 19.02 ± 3.78 -0.40** 3.24 ± 1.99 -0.15 21.00 ± 1.55 -0.46** 52.81 ± 6.00 -0.20 1I:5 55.58 ± 3.29 -0.74** 12.26 ± 3.42 -0.23 1.47 ± 2.36 -0.04 14.43 ± 1.55 -0.28* 60.47 ± 3.34 0.28* 1I:10 61.41 ± 3.21 -0.86** 6.98 ± 2.54 -0.06 1.02 ± 1.97 0.02 9.08 ± 1.21 -0.06 60.88 ± 3.17 0.23 1I:20 64.86 ± 3.10 -0.95** 3.77 ± 1.82 0.49** 0.96 ± 1.28 0.15 5.52 ± 0.84 0.41** 55.09 ± 3.24 0.25*
A high correlation between the colorimetric coordinate L* and the anthocyanin content has been reported in literature by Montes et al. (2005) in a study with jabuticaba. The coordinates a* and b* correlate well with the anthocyanin content of the 13 fruits and vegetables in extracts with 70% acidified ethanol, diluted or not, compared to non-acidified extract; however, the coordinate a* did not correlate well with the anthocyanin content in phenolic extracts produced with 70% acidified ethanol and diluted 20 times (Table 3).
The C* and h* values showed a correlation (r) greater than 0.6 with the total anthocyanin content of some phenolic extracts, mainly with acidified 70% ethanol (Table 3). Phenolic extracts produced with 70% acidified ethanol, without dilution, presented a negative correlation (r) of 0.85 with the h* value (Table 3); this negative correlation indicates that h* value increases when the total anthocyanin content is reduced, which was also demonstrated by Sant’Anna et al. (2013). Ot also indicates that the pigment is associated with the red intensity of the phenolic extract produced.
3.4 Development of prediction models based on colorimetric coordinates
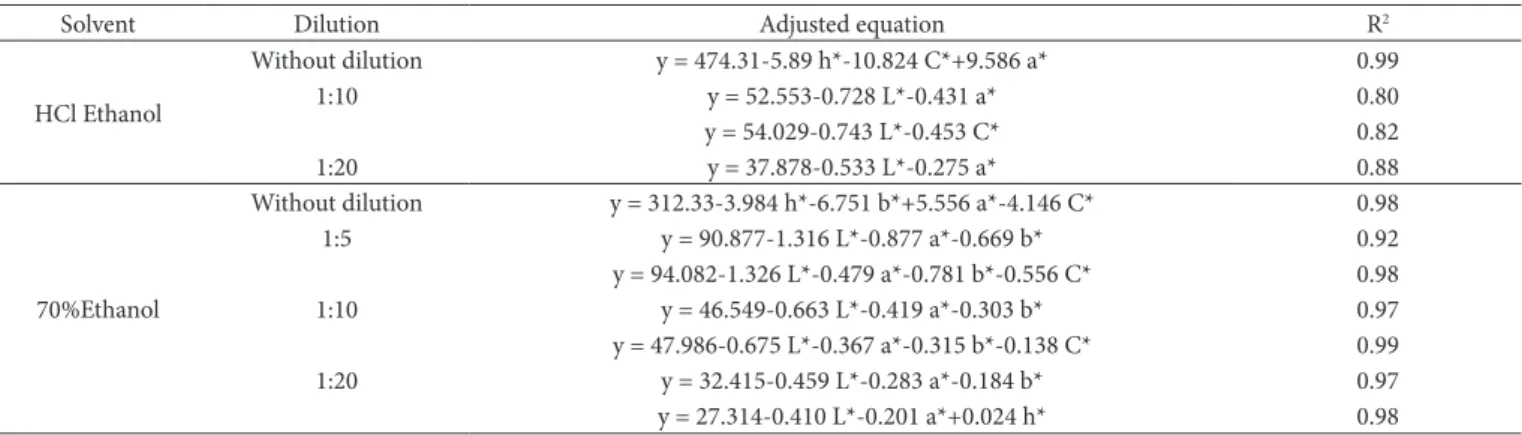
Simple mathematical models with high values of R2 were obtained in this study, where 13 fruits and vegetables containing different total anthocyanins contents were used (Table 4). For phenolic extracts produced with acidified 70% ethanol, the adjusted equation with the highest r2 value (y = 474.31-5.89 h* - 10.824 C* + 9.586 a*, R2 = 0.99) was obtained for the phenolic extract without dilution (Table 4). Using the L* and a* or L* and C* values, it was possible to predict the anthocyanin content in the phenolic extracts diluted 10 and 20 times, using equations with R2 greater than 0.80 (Table 4). No equations with high R2 were obtained for the phenolic extracts diluted 2 and 5 times.
Ot was possible to adjust at least one linear regression to predict total anthocyanin content of the phenolic extracts produced with 70% ethanol without acidification and diluted 5, 10 and 20 times using different colorimetric coordinates. The equation with the highest
R2 value (y = 47.986-0.675 L*-0.367 a*-0.315 b*-0.138, R2 = 0.99) was obtained for the phenolic extract diluted 10 times (Table 4). The equation obtained for the phenolic extract without dilution was y=312.33–3.984 h* -6.751 b*+5.556 a*-4.146 C*, R2 = 0.98.
Knowledge of the content of bioactive compounds, such as anthocyanins, from natural sources has become very important in the preparation of food supplements or nutraceuticals, functional foods, additives and in the pharmaceutical and cosmetic industries. Ot is known that the anthocyanin content is maximum when grapes, used in the manufacture of wine, are maturing, which is the ideal harvest season. This fact indicates the importance of predicting the total anthocyanin content of grapes during ripening through fast and less tedious methods (Chen et al., 2015).
Ot was possible to predict, using colorimetric coordinates of the phenolic extracts obtained from different fruits and vegetables, the anthocyanin content very close to the actual value (Figure 1) using linear equations with higher R2 for each dilution and extraction solvent, with or without acidification, as shown in Table 4.
The maximum variation between the actual and predicted anthocyanin content obtained was 5% for phenolic extracts produced with 70% ethanol and acidified 70% ethanol diluted 20 times. Ot was not possible to fit a multiple linear regression model with r2 greater than 0.80 in the case of phenolic extracts produced with acidified 70% ethanol, diluted 2 and 5 times, and phenolic extracts produced with 70% ethanol diluted 2 times.
This study proved that the spectrophotometric method for quantification of anthocyanins in fruits and vegetables could be perfectly replaced by the colorimetric method. The use of the colorimetric method, in addition to reducing costs and time, reduces the amount of toxic and non-toxic reagents used in traditional methods. When the hue (h*) and saturation (C*) are calculated, it is possible to further reduce the analysis time, since equations with high R2 were obtained for phenolic extracts, requiring no dilutions. Furthermore, tristimulus colorimeters allow a qualitative analysis of the extracts, being an advantage over the quantitative method based on the measurement of the
Table 4. Adjusted multiple regression equations to determine the total anthocyanin contents of 13 fruits and vegetables using colorimetric coordinates (L*, a*, b*, C* and h*).
Solvent Dilution Adjusted equation R2
HCl Ethanol
Without dilution y = 474.31-5.89 h*-10.824 C*+9.586 a* 0.99
1I:10 y = 52.553-0.728 L*-0.431 a* 0.80
y = 54.029-0.743 L*-0.453 C* 0.82
1I:20 y = 37.878-0.533 L*-0.275 a* 0.88
70%Ethanol
Without dilution y = 312.33-3.984 h*-6.751 b*+5.556 a*-4.146 C* 0.98
1I:5 y = 90.877-1.316 L*-0.877 a*-0.669 b* 0.92
y = 94.082-1.326 L*-0.479 a*-0.781 b*-0.556 C* 0.98
1I:10 y = 46.549-0.663 L*-0.419 a*-0.303 b* 0.97
y = 47.986-0.675 L*-0.367 a*-0.315 b*-0.138 C* 0.99
1I:20 y = 32.415-0.459 L*-0.283 a*-0.184 b* 0.97
y = 27.314-0.410 L*-0.201 a*+0.024 h* 0.98
absorbance at 535 nm. Thus, the present study indicates the reliability and feasibility of predicting the total anthocyanin content of fruits and vegetables using colorimetric coordinates, providing an alternative to the traditional method.
4 Conclusions
Multiple linear regression models with high r2 were obtained and can be used to predict the total anthocyanin content of the fruits and vegetables used in this study, facilitating the definition of the harvest point and, as such, can be used as an important starting point to define the quality of fresh and processed products, which is related to the content of anthocyanins.
The tristimulus colorimeter allows a qualitative analysis of phenolic extracts, which is an advantage over the quantitative method based on absorbance measurement at 535 nm, because of its speed, low cost and no need of specialized reagents. The results confirm the reliability and feasibility of predicting the total anthocyanin content of different fruits and vegetables using colorimetry.
Acknowledgements
The authors would like to thank the research support agenciesI: Capes, Fapemig and Cnpq for financial support.
References
Alves, C. C. D., Resende, J. V., Cruviel, R. S. R., & Prado, M. E. T. (2008). Estabilidade da microestrutura e do teor de carotenóides de pós
obtidos da polpa de pequi (Caryocar brasiliense Camb.) liofilizada.
Ciência e Tecnologia de Alimentos, 28(4), 830-839.
Bao, J., Cai, Y., Sun, M., Wang, G., & Corke, H. (2005). Anthocyanins, flavonols, and free radical scavenging activity of Chinese Bayberry (Myrica rubra) extracts and their color properties and stability.
Journal of Agricultural and Food Chemistry, 53(6), 2327-2332. httpI:// dx.doi.org/10.1021/jf048312z. PMidI:15769176.
Caridi, D., Trenerry, V. C., Rochfort, S., Duong, S., Laugher, D., & Jones, R. (2007). Profiling and quantifying quercetin glucosides in onion (Allium cepa L.) varieties using capillary zone electrophoresis and
high performance liquid chromatography. Food Chemistry, 105(2),
691-699. httpI://dx.doi.org/10.1016/j.foodchem.2006.12.063. Chandrasekhar, J., Madhusudhan, M. C., & Raghavarao, K. S. M. S.
(2012). Extraction of anthocyanins from red cabbage and purification
using adsorption. Food and Bioproducts Processing, 90(4), 615-623.
httpI://dx.doi.org/10.1016/j.fbp.2012.07.004.
Chen, S., Zhang, F., Ning, J., Liu, X., Zhang, Z., & Yang, S. (2015). Predicting the anthocyanin content of wine grapes by NOR hyperspectral
imaging. Food Chemistry, 172, 788-793. httpI://dx.doi.org/10.1016/j.
foodchem.2014.09.119. PMidI:25442621.
Dai, J., Gupte, A., Gates, L., & Mumper, R. J. (2009). A comprehensive study of anthocyanin-containing extracts from selected blackberry cultivarsI: Extraction methods, stability, anticancer properties and
mechanisms. Food and Chemical Toxicology, 47(4), 837-847. httpI://
dx.doi.org/10.1016/j.fct.2009.01.016. PMidI:19271318.
Ella Missang, C., Guyot, S., & Renard, C. M. (2003). Flavonols and Anthocyanins of Bush Butter, Dacryodes edulis (G. Don) H.J. Lam,
Fruit. Changes in Their Composition during Ripening. Journal of
Agricultural and Food Chemistry, 51(25), 7475-7480. httpI://dx.doi. org/10.1021/jf0346399. PMidI:14640602.
Fan, G., Han, Y., Gu, Z., & Chen, D. (2008). Dptimizing conditions for anthocyanins extraction from purple sweet potato using response
surface methodology (RSM). Lebensmittel-Wissenschaft + Technologie,
41(1), 155-160. httpI://dx.doi.org/10.1016/j.lwt.2007.01.019. Fuleki, T., & Francis, F. (1968). Quantitative methods for anthocyanins.
1. Extraction and determination of total anthocyanin in
cranberries. Journal of Food Science, 33(1), 72-77. httpI://dx.doi.
org/10.1111/j.1365-2621.1968.tb00887.x.
Grigoras, C. G., Destandau, E., Zubrzycki, S., & Elfakir, C. (2012). Sweet cherries anthocyaninsI: An environmental friendly extraction and
purification method. Separation and Purification Technology, 100,
51-58. httpI://dx.doi.org/10.1016/j.seppur.2012.08.032.
Heredia, F. J., Francia-Aricha, E. M., Rivas-Gonzalo, J. C., Vicario, O. M., & Santos-Buelga, C. (1998). Chromatic characterization of
anthocyanins from red grapes - O. pH effect. Food Chemistry, 63(4),
491-498. httpI://dx.doi.org/10.1016/S0308-8146(98)00051-X. Ognat, O., Volf, O., & Popa, V. O. (2011). Review A critical review of
methods for characterisation of polyphenolic compounds in fruits
and vegetables. Food Chemistry, 126(4), 1821-1835. httpI://dx.doi.
org/10.1016/j.foodchem.2010.12.026. PMidI:25213963.
Lees, D., & Francis, F. (1972). Standardization of pigment analyses in
cranberries. HortScience, 7, 83-84.
Giusti, M. M., & Wrolstad, R. E. (2001). Characterization and measurement of anthocyanins by UV‐visible spectroscopy. On R. E. Wrolstad &
S. J. Schwartz (Eds.), Current protocols in food analytical chemistry
(Chap.1; pp. F1.2.1-F1.2.13). New YorkI: John Wiley & Sons, Onc. httpI://dx.doi.org/10.1002/0471142913.faf0102s00
Montes, C., Vicario, O. M., Raymundo, M., Fett, R., & Heredia, F. J. (2005). Application of tristimulus colorimetry to optimize the extraction of anthocyanins from Jaboticaba (Myricia Jaboticaba
Berg.). Food Research International, 38(8–9), 983-988. httpI://dx.doi.
org/10.1016/j.foodres.2005.01.016.
Pappas, C. S., Takidelli, C., Tsantili, E., Tarantilis, P. A., & Polissiou, M. G. (2011). Quantitative determination of anthocyanins in three sweet cherry varieties using diffuse reflectance infrared Fourier
transform spectroscopy. Journal of Food Composition and Analysis,
24(1), 17-21. httpI://dx.doi.org/10.1016/j.jfca.2010.07.001. Patil, G., Madhusudhan, M. C., Ravindra Babu, B., & Raghavarao, K.
S. M. S. (2009). Extraction, dealcoholization and concentration of
anthocyanin from red radish. Chemical Engineering and Processing:
Process Intensification, 48(1), 364-369. httpI://dx.doi.org/10.1016/j. cep.2008.05.006.
Poiana, M. A., Alexa, E., & Mateescu, C. (2012). Tracking antioxidant properties and color changes in low-sugar bilberry jam as effect of
processing, storage and pectin concentration. Chemistry Central
Journal, 6(4), 2-11. httpI://dx.doi.org/10.1186/1752-153X-6-4. PMidI:22248151.
Pompeu, D. R., Silva, E. M., & Rogez, H. (2009). Dptimisation of the solvent extraction of phenolic antioxidants from fruits of Euterpe
oleracea using Response Surface Methodology. Bioresource Technology,
100(23), 6076-6082. httpI://dx.doi.org/10.1016/j.biortech.2009.03.083. PMidI:19581082.
Revilla, E., Ryan, J.-M., & Martín-Drtega, G. (1998). Comparison of several procedures used for the extraction of anthocyanins from
red grapes. Journal of Agricultural and Food Chemistry, 46(11),
4592-4597. httpI://dx.doi.org/10.1021/jf9804692.
Rodriguez-Saona, L.E, & Wrolstad, R. (2001). Extraction, isolation and
purification of anthocyanins. Current Protocols in Food Analytical
Chemistra, 1(1) 1-11.
Sant’Anna, V., Gurak, P. D., Marczak, L. D. F., & Tessaro, O. C. (2013). Tracking bioactive compounds with colour changes in foods - A
review. Food Chemistry, 98, 601-608. httpI://dx.doi.org/10.1016/j.
foodchem.2013.09.106.
Teixeira, N., Stringheta, P. C., & Dliveira, A. (2008). Comparação de
métodos para quantificação de antocianinas. Revista Ceres, 55(4),
297-304.
Vera de Rosso, V., Hillebrand, S., Cuevas Montilla, E., Bobbio, F. D., Winterhalter, P., & Mercadante, A. Z. (2008). Determination of
anthocyanins from acerola (Malpighia emarginata DC.) and açaí
(Euterpe oleracea Mart.) by HPLC-PDA-MS/MS. Journal of Food Composition and Analysis, 21(4), 291-299. httpI://dx.doi.org/10.1016/j. jfca.2008.01.001.