September 2017
João Pedro Pereira Mendes
Bachelor of Science in Chemical and Biochemical Engineering
Chromatographic purification of virus particles
for advanced therapy medicinal products
Dissertation submitted in partial fulfillment of requirements for the degree of Master of Science in
Chemical and Biochemical Engineering
Adviser: Ricardo Silva, Post-Doc Researcher, ITQB-UNL
Co-adviser: Cristina Peixoto, Competence Driven R&D Lab Head,
ITQB-UNL
Examination Committee:
Chairperson: Professor Mário Fernando José Eusébio, FCT-UNL
i
Chromatographic purification of virus particles for advanced therapy medicinal products
Copyright © João Pedro Pereira Mendes, Faculdade de Ciências e Tecnologia, Universidade Nova de Lisboa.
iii
v
Acknowledgments
5 years later, many working hours later, many unslept hours later, many tears, many smiles, many failures and successes later, it came to an end. This is the goal line of a journey that wasn´t always easy but had its moment and was worth it. To all those who helped along the way, thank you so much.
To Ricardo, my adviser, for his help, patience, knowledge and guidance. For giving me a glimpse of the real world; for allowing me to work side-by-side and learn from his work; for teaching me what being an engineer means; and far and for most, for always believing and impelling me to do better and be better.
To Cristina, my co-adviser, for the opportunity to develop this thesis at IBET, for the risk took and the gamble made. But most important, for the encouraging words and the confidence shown throughout the journey that motivated me to do my best.
To my lab colleagues, my friends, Mafalda, Sofia, Sara, Ana, Hugo, Tiago e Ana Sofia, for their support and sympathy, for the moments inside and outside the lab, for being there when I needed a kind word or being called up, but primarily for making me feel part of the team.
To my friends, Tiago, Jessica and all the others that my journey gave the opportunity to meet, for the stories that I’ll remember forever, the late hours studying and a friendship worthy of a tale, it was my honour to finish this by your side and have you as friends.
To my mother, my father and my sister for their support and love, for the countless moments of sharing and complicity, for the values, the education and for being there every time I needed.
To Mariana, my best friend, my love, my everything, for these incredible 5 years, for the person that you are, for being by my side when I needed the most, for every moment, without you this wouldn’t be possible.
vii
Abstract
The increasing number of cancer diagnoses in the last decades is associated with
behavioral risks, in addition with those genetically originated. The fight against the disease
usually relapses in not selective mechanisms like chemotherapy or radiotherapy, that induce the
organism in deep alterations and side effects. One of the alternative strategies relies on the use
of advanced therapies medicinal products suchlike viruses, to carry out the treatment in each
cell taking advantage of their invading abilities. The cost of producing this oncolytic virus directly
influences process engineering, and thus, numerous efforts have been made to improve each
purification step.
The development of the downstream process begins with the clarification of the
viruses harvested from the bioreactor with two depth-filtration steps. This allows a gradual
removal of larger impurities like cell debris with a complete virus recovery. Afterwards, a
tangential flow filtration step enables volume reduction. After concentration, the retentate is
subjected to diafiltration which allows not only the permeation of impurities but also the
formulation of the concentrated product for the next processing step.
The following step in the purification train is anion exchange chromatography. The
chromatographic media used was selected after successive screening tests with a library of
resins and membranes. The conditions used reflect the study carried out, in the sense that the
load employed corresponds to the DBC10% obtained of 6.2 x 10¹¹ (TP/ml) particles per millilitre
and the elution of the viruses is preceded by a low salt concentration elution (200 mM) in order
to remove impurities. The yield obtained is 85%. The purification process ends with polishing
and sterile filtration to achieve the specified conditions, through a size-exclusion
chromatography and membrane filters, respectively, obtaining a total yield of 53%.
The study also opens perspectives on innovation and future development with the
performance of multi-column chromatography assays and automated filtration tests, both in
ix
Resumo
O aumento do número de diagnósticos de cancro nas últimas décadas deve-se a riscos comportamentais, em associação aos originados geneticamente. O combate à doença recai comummente em mecanismos pouco seletivos como quimioterapia ou radioterapia, que induzem no organismo profundas alterações e efeitos secundários. Uma das estratégias alternativas recai na utilização de vírus modificados para realizar o tratamento em cada célula, tirando partido das capacidades invasoras dos vírus. O custo de produção destes vírus oncolíticos influencia diretamente a engenharia de processo, e assim sendo, inúmeros esforços têm sido enveredados no sentido de melhorar e otimizar cada passo da purificação.
O desenvolvimento do processo de downstream inicia-se com a clarificação dos vírus recolhidos do bioreator por meio de dois depth-filters. Este passo permite a remoção gradual de impurezas maiores com uma completa recuperação de vírus. Seguidamente, um conjunto otimizado de filtrações tangenciais permite redução do volume. Após a concentração, o retentado é submetido a diafiltrações que possibilitam não apenas a permeação de impurezas, mas também a formulação do produto concentrado para o próximo passo de processamento.
O passo seguinte consiste na purificação cromatográfica por troca iónica. O meio cromatográfico utilizado foi selecionado após testes sucessivos com uma biblioteca de resinas e membranas. As condições utilizadas refletem o estudo efetuado no sentido em que carga empregue corresponde à DBC10% obtida de 6.2x10¹¹ TP/ml (partículas por mililitro) e a eluição
dos vírus propriamente ditos é precedida de uma eluição com pouca concentração de sal (200 mM) de forma a retirar grande parte das impurezas. O rendimento obtido é de 85%. O processo de purificação termina com polimento e filtração estéril tendo como objetivo alcançar as condições especificadas, através de cromatografia de exclusão molecular e filtros de membrana, respetivamente, tendo sido obtido um rendimento total de 53%.
xi
Motivation
The uprising number of diagnosed patients and cancer-related deaths appeals for increased dedication and research on this field; besides the clear necessity for better treatments, scientific interest and clinical development have never been so pronounced.
R&D for oncolytic virus therapies appeared at the beginning of the 20th century,
“surrounded” by theoretical potential and hope for an alternative strategy for the emerging cancer diseases. One hundred years later, the development is remarkable, with some already being clinically available. But a lot has yet to be done. Despite all efforts, and mainly due to huge production and purification costs, the therapy is too expensive, and therefore, hardly affordable.
xiii
Contents
Acknowledgments ... v
Abstract ... vii
Resumo ... ix
Motivation ... xi
Contents ... xiii
List of Figures ... xv
List of Tables ... xvii
List of Abbreviations ... xix
1 Introduction... 1
1.1 Cancer and Oncolytic Therapies ... 3
1.2 Upstream Process ... 5
1.3 Downstream Process ... 6
1.4 Intermediate purification ... 8
1.5 Overview of different purification pathways ... 12
1.5.1 Multicolumn chromatography ... 14
1.6 Modelling ... 17
1.7 Analytical Methods ... 18
2 Methods and Materials ... 19
2.1 Virus production ... 21
2.2 Clarification ... 21
2.3 Ultra/Diafiltration ... 21
2.4 Purification (AEX) ... 22
2.5 Polishing (Size Exclusion Chromatography) ... 23
2.6 Analytical methods ... 23
2.6.1 Total protein quantification ... 23
2.6.2 Total dsDNA Quantification ... 23
2.6.3 Nanoparticle Tracking Analysis ... 24
2.6.4 Turbidity analysis ... 24
2.6.5 Dynamic Light Scattering ... 24
2.6.6 Quantitative Real Time PCR ... 25
2.6.7 High-Performance Liquid Chromatography ... 25
3 Implementation and Development of an analytical tool for process monitoring ... 27
xiv
3.2 NanoSIGHT Calibration Curve ... 29
3.3 HPLC-SEC Calibration Curve ... 31
3.4 Combined approach ... 33
3.4.1 Detection Limits and Errors ... 35
4 Results and Discussion ... 37
4.1 Development of a purification process for oncolytic virus ... 39
4.1.1 Clarification studies ... 40
4.1.2 Ultrafiltration and Diafiltration Steps... 42
4.1.3 Chromatography purification ... 44
4.1.4 Polishing scouting ... 52
4.1.5 Sterile filtration ... 54
4.2 Development of a multicolumn chromatography purification step ... 55
5 Conclusion and Future Work ... 65
5.1 Conclusion ... 67
5.2 Future Work ... 69
xv
List of Figures
Figure 1 - Oncolytic viruses diversity (a) and implemented modes of action (b) [8] ... 3
Figure 2 - Common five steps of oncolytic viruses purification process [13] ... 6
Figure 3 – HPLC-SEC chromatography profile (wavelength 280 nm) [7] ... 10
Figure 4 - Purification process for adenovirus using chromatography [7] ... 13
Figure 5 - Elution (a) and Countercurrent Chromatography (b, c) [71] ... 15
Figure 6 - Two-column, in open-loop, SEC purification step (P – Product; F – Feed; W – Waste; E – Eluent) [72] ... 16
Figure 7 - Analytical Methods ... 18
Figure 8 - NanoSIGHT assay with 3 measurements ... 30
Figure 9 - NanoSIGHT assay for Ultra/Diafiltration ... 30
Figure 10 - NanoSIGHT Correlation ... 31
Figure 11 - HPLC-SEC assay for Ultra/Diafiltration (wavelength 280 nm) ... 32
Figure 12 - HPLC-SEC Correlation (wavelength 280 nm) ... 33
Figure 13 - NanoSIGHT correlation for design range (a), ... 34
Figure 14 - Noise amplitude at the baseline (wavelength 280 nm) ... 35
Figure 15 - Maximum particle concentration acceptable, right figure is focused on the 80 – 110 mAu region of the left plot ... 36
Figure 16 - Standard downstream processing train for adenovirus purification [7]... 39
Figure 17 – Pressure variation for different filters: A (a), B (b) for observed water fluxes ... 41
Figure 18 - Pressure over time: A with a pore size of 5 µm (a), B with pores of 0,2 µm (b) ... 41
Figure 19 - Results of clarification: Turbidity (a) and NanoSIGHT (b) ... 42
Figure 20 - Flux in Ultra/diafiltration for a cassette membrane filter cartridge with 200 cm2 ... 43
Figure 21 - HPLC-SEC comparing product and impurities (wavelength 280 nm) using Membrane filter ... 44
Figure 22 – Zeta Potential for adenovirus ... 45
Figure 23 - DBC10% of membrane adsorber (wavelength 280 nm): 50 ml injection (a) and 250 ml injection (b) ... 46
Figure 24 - Chromatogram using AEX media A (wavelength 280 nm) ... 47
Figure 25 – Chromatogram using AEX B (wavelength 280 nm) ... 47
Figure 26 - Elution experiment on AEX resin B (wavelength 280 nm) for 150 (a), 487 (b), 825 (c), 1162 (d) and 1500 (e) mM ... 49
xvi
Figure 28 – Virus recovery ratios for low salt concentration elutions ... 51
Figure 29 - Virus recovery ratios for high salt concentration elutions ... 51
Figure 30 - Purification Validation Assays (wavelength 280 nm): 0 mM (a) and 200 mM (b) .... 52
Figure 31 - Polishing Assay with a 500 µl injection ... 52
Figure 32 - Loading assays: 5% (a), 10% (b), 20% (c) ... 53
Figure 33 - Polishing Validation Run... 54
Figure 34 - Two-column chromatography array ... 55
Figure 35 - Multicolumn scheme (a) and single column inlets (b) ... 56
Figure 36- BSA and Tryptophan breakthrough ... 57
Figure 37 - BSA and Tryptophan Multicolumn Chromatography Assay 1 ... 58
Figure 38 - BSA and Tryptophan Multicolumn Chromatography Assay 2 ... 59
Figure 39 - BSA and Tryptophan Multicolumn Chromatography Assay 3 ... 60
Figure 40 - Adenovirus breakthrough in AEX media B ... 61
Figure 41 - Adenovirus multicolumn chromatography assay 1 (0.67 ml/min) ... 62
Figure 42 - Adenovirus multicolumn chromatography assay 2 (0.5 ml/min) ... 62
xvii
List of Tables
Table 1 - Adenovirus production cells [26] ... 5
Table 2 - Chromatography Strategies’ Comparison [32] ... 9
Table 3 - Water Fluxes for different filters: (A) and (B) calculated from observed Flow rates ... 40
Table 4 - Ultra/diafiltration results for Membrane Filter ... 43
Table 5 - Chromatography comparative study... 48
Table 6 - Loading assay ... 53
Table 7 - Sterile filtration assay ... 54
Table 8 - BSA and Tryptophan Multicolumn Chromatography Assay 1 ... 58
Table 9 - BSA and Tryptophan Multicolumn Chromatography Assay 2 ... 59
xix
List of Abbreviations
AEX Anion-exchange Chromatography
BSA Bovine Serum Albumin
CIP Cleaning-in-place
CV Column Volume
DNA Deoxyribonucleic Acid
FDA Food and Drug Association
GBM Glioblastomas
GF Gel Filtration
GMP Good Manufacturing Practices
GS Gliosarcoma
HIC Hydrophobicity Interaction Chromatography
HPLC High-Performance Liquid Chromatography
IEX Ion-exchange Chromatography
IZAC Immobilized Zinc Affinity chromatography
MAMC Metal Affinity Membrane Chromatography
MCSCGP Multicolumn Solvent Gradient Chromatography
NTA Nanoparticles Tracking Analysis
PBS Phosphate Buffered Saline
QC Quality Control
q-PCR Real Time PCR
R&D Research and Development
SEC Size-exclusion chromatography
SMB Simulated Moving Bed
TFF Tangential Flow Filtration
1
1
1
Introduction
3
1.1 Cancer and Oncolytic Therapies
Cancer is one of the most notorious and fast growing diseases enhanced by the dietary and behavioural risks of nowadays society like high body mass index, lack of physical activity or tobacco and alcohol use [1,2]. Presenting itself as the second biggest death cause in 2015, with more than 8.8 million registered cases, cancer is responsible for almost 1 in every 6 deaths [1].
Traditional and more common treatments include chemo and radiation therapies, which through medication or intense radiation doses try to kill cancer cells or reduce tumours [3]. Although some satisfactory results can be achieved, their pathway is dangerous and may induce other systemic problems due to the amount and severity of dosage or lack of specificity for cancer/tumour cells. So new treatments have been developed, such as hormone therapy or stem cells transplant [3]. Among these innovative strategies are oncolytic virus therapies which take advantage of pathogenic agents to induce specific behaviours on target cells. By genetically engineering the perfect modified virus, scientists can promote virus replication and cell lysis dependent on the infected cell being normal or cancerous [4]. This is one of the most important advantages of virus therapy as it reduces toxicity and effects on non-cancerous cells [5,6].
Virus particles have been growing as a platform for drug production and thoroughly investigated as one of the most promising approaches for gene therapy vectors and viral vaccines [7]. The amount of possibilities brought by the multiple oncolytic viruses available, like reovirus or adenovirus, gives researchers a good amount of ways to solve tumours’ killing problems, from oncolysis amplification to gene therapy (Fig. 1).
4
Targeting mechanisms and tumour selectivity are driven by several factors depending on the chosen oncolytic virus. Researchers’ first concern is the cell entry mechanism, being via virus-specific or receptor-mediated. Tumour cells often express viral receptors, and while the increased selectivity for those highly decreases immune responses, it also increases success possibility. Other factors include rapid cell division inside tumour cells or deficiencies in antiviral type I. Even though these might seem problematic, the increased cell division may induce higher virus replication selectivity in tumour cells. Associated with the lack of enough antiviral, it can, upon cell lysis, release virus among cell debris, developing immunosuppression near the tumour and inducing pathways for antitumor immunity [9].
As research and interest grow on this topic, so does the range of studied viruses as potential candidates for cancer therapeutics. Examples of these are Vaccinia, Herpes or Adenovirus, with many published clinical trials, and other ones like Polio and Parvovirus, still without any reported [9].
The first therapy approved by the FDA (the United States Food and Drug Administration) that uses oncolytic viruses is Imlygic (talimogene laherparepvec). This “first-of-its-kind” therapy targets metastatic melanoma using modified live oncolytic herpes virus on lesions that couldn’t be completely removed by surgery [10]. The main advantage of this approach is the limited toxicity associated with the “ability to use each individual tumour as a source of antigen to generate a highly specific antitumor immune response” [11].
The interest on these new treatments is reflected on researchers’ publications and clinical trials ongoing. Regarding adenovirus vectors, the amount of clinical trials increased from approximately 25% in the early 2000’s [12,13] , to a 50% growth per year since 2012, on gene therapy targeting cancer [14]. Reported studies presented results on tumour/cancer cells located on bone (osteosarcoma) [15], brain [16], skin (melanoma) [17] and head or neck [18]. In fact, world’s first adenovirus oncolytic therapy was approved in China, back in 2005, to treat head or neck cancer. This treatment paired oncolytic virus with chemotherapy, increasing response rates to almost 80% compared to 40% when prescribing only the standard procedure. The oncolytic used was H101, an adenovirus serotype 5 with deleted E3 gene [19,20].
5
of these adenoviruses are taking place. Currently, in phase 1, trials conducted by VCN Biosciences, S.L. and DNAtix, Inc., are measuring primarily safety/tolerability and efficacy, on therapies developed to target specifically advanced solid tumours and recurrent brain, glioblastomas (GBM) or gliosarcoma (GS) [9].
Recombinant adenoviruses are gaining relevance as gene transfer vectors for gene therapy owing to its characteristics for this purpose [21]. Morphologically being non-enveloped with a diameter from 70 to 120 nanometres, and presenting double-stranded DNA associated with high transductions efficiencies and gene expression levels [12,22,23], makes this kind of virus particles great candidates for innovative virotherapies [7].
1.2 Upstream Process
The production of oncolytic adenovirus can be achieved by many producer cells [24,25], such as PER.C6, C139 or the most known HEK293 which allows a high titter of productivity [8]. Another commonly used cell line is A549 which has been documented for GMP manufacturing and was used to produce the oncolytic virus studied in the scope of this thesis. These producer cells have been reported in several publications regarding adenovirus for oncolytic therapies (Table 1).
Table 1 - Adenovirus production cells [26]
PRODUCER CELL ORIGIN REFERENCE
HEK293
Human embryonic kidney with sheared adenovirus
DNA
Russell et al., 1977 [27]
PER.C6
Human embryonic retinoblast cells with a shorter adenoviral sequence
Fallaux et at., 1998 [28]
A549 Human lung cancer cells Imler et al., 2005 [29]
6
Their production methods have been thoroughly reported with each one being particularly better in some parameters or for specific cell lines. Depending on the working scale, the approaches may include spinners, roller bottles and bioreactors [8].
1.3 Downstream Process
The exponential awareness for oncolytic virus therapies catalyses the interest on developing scalable purification processes capable of ensuring compliance with product’s demand for clinical grade scale [31]. Although many different strategies are reported in the literature, the most usual purification train uses five key process stages such as the ones depicted in Figure 2 [8].
Figure 2 - Common five steps of oncolytic viruses purification process [13]
Concentration/Buffer exchange
Ultracentrifugation or tangential flow ultrafiltration/diafiltration
Purification
Ion-exchange chromatography (IEX) Size-exclusion chromatography (SEC)
Sterile filtration
Clarification
To remove cellular debris
Nuclease Treatment
7
Although most of the emphasis of the downstream process is put in the intermediate purification stages - chromatography, the improvement of the lysis, nuclease treatment, clarification or concentration steps have shown great repercussion on overall processes performance.
The first step after bioreaction is cell lysis. Several strategies can be found in the literature to perform this operation. The most common are the use of freeze/thaw cycles followed by water baths [12,13,32,33]. Surfactants such as Triton X-100 [34] which can be directly applied on the bioreactor or coupled with centrifugation and/or a brief sonication after the freeze/thaw cycles [35] have also been recognized for their potential as cell lysis agents.
Nuclease treatment is particularly important for adenovirus production, since host cell’s DNA may theoretically increase potential tumorgenicity [36]. Although other methods can be considered, for example, anion-exchange procedures, the most common are nuclease treatments with Benzonase (EM Science) and DNA precipitation. Firstly, through the usage of this endonuclease, both DNA and RNA are digested which assists in achieving FDA guidelines for nucleic acid contamination. Secondly, it can be introduced in many different solutions due to stability and activeness in a large range of conditions [37], making it reliable for adenovirus purification either in research or clinical trials[36]. However, it has been reported some difficulty in separating benzonase remains from cell lysates [38]. Selective DNA precipitation using ammonium sulphate and polyethylene glycol was also demonstrated [39] with good separation yields achieved [40].
The objective of clarification stage is to simultaneously remove cell debris or large products (e.g. process-related aggregates) in an efficient way and to ensure product quality in the flowthrough [7]. The two most common processes are centrifugation and membrane filtration. As scalability is a major deciding factor in research and development studies, both strategies have been tried on different scales [41]. These multiple options are been considered since the 90’s and different approaches have been tested from centrifugation [32] to more versatile and robust depth filters [34].
8
step of buffer exchange, which allows the formulation of the virus bulk for the next processing steps.
1.4 Intermediate purification
Virus intermediate purification processes have been improved in every aspect since early 1960’s when were mainly based on density gradients [42]. These processes included two rounds of cesium chloride (CsCl) or sucrose density gradient ultracentrifugation following freeze-thaw cycles to disrupt infected cells [43,44]. Among several process’ disadvantages, such as poor yields, inconstant degrees of purity [33] and the necessity of consequent CsCl removal [45], the main concern was related to the lack of scale up viability [46,47]. Nevertheless, density gradient ultracentrifugation is still performed for research and pre-clinical applications. Moreover, small chromatography kits are available for the same scale enabling improvements on purified volume and total yield while reducing total operation time in more than 90%, to only 3 hours [48].
New strategies have been tried to overcome this problem, some with more success than others. Unsuccessful approaches include filtration processes, which were developed from the principle that viruses are comparatively larger particles than impurities present. These strategies failed on technical aspects, namely because filters were designed with the purpose of virus removal. Additionally, particle aggregation on the membrane surface greatly contributes to viral loss [49].
9
Table 2 - Chromatography Strategies’ Comparison [32]
Virus Type ACN53
Cell Line ATCC 293
Purification
Method
Resin Buffers Elution Yield
SEC Toyopearl HW-75F PBS (2% Sucrose, 2 mM
MgCl2)
n.a. 15 – 20 %
AEX Fractogel DEAE-650 M
50 mM HEPES (pH 7.5, 300 mM NaCl, 2 mM MgCl2, 2%
sucrose)
50 mM HEPES (pH 8, 300 mM NaCl, 2 mM MgCl2, 2%
sucrose)
Gradient n.a.
HIC Toyopearl butyl 650M
Toyopearl phenyl
650M
50 mM Tris (pH 8, 3 M (NH4)2SO4)
Gradient 5 – 30 %
Affinity IZAC column with
zinc/glycine system
50 mM HEPES (pH 7.5, 450
mM NaCl, 2 mM MgCl2, 2%
sucrose)
50 mM HEPES (pH 7.5, 150 mM NaCl, 2 mM MgCl2, 2%
sucrose)
Gradient 47%
Chromatography columns allow for products discrimination through a large variety of characteristics supported on the required difference between itself and remaining components (impurities).
10
stage in purification by chromatography, or later on polishing and sterile filtration. Size-exclusion, as the name suggests, allows for fractionation of different molecules or compounds depending on their dimensions and individualization of the product from other components, like DNA or proteins. The initial solution is injected trough a precise arrange of materials, that have a defined pore, and in some cases, intra-pore size.
Regarding resins, as an example, their packed bed has accountable volume, and through research and experimentation, it’s possible to arrive at precise measurements of dead volume, pore size, intra-pore size and others, which then, will truly define the size-exclusion specifications required for a purification process. The following figure (Fig. 3) presents the outcoming of a SEC column, being the first peak the pretended product and the remain, impurities. The first image represents the results of eluted volume according to the molecular weight of present biomolecules. With this analysis, it’s verifiable that the viruses go through the matrix while impurities and other calibration molecules are caught on it which justifies their delay.
Figure 3 – HPLC-SEC chromatography profile (wavelength 280 nm) [7]
Eluted Volume (mL)
A b s o rb a n c e ( m A U )
0 50 100 150
0 200 400 600
E lu te d V o lu m e ( m L )
M o le c u la r W e ig h t (D a )
0 5 0 1 0 0 1 5 0
1 00
1 02
1 04
1 06
1 08
1 01 0
Purified Ad5
Blue dextran
11
Purification strategies based on membrane or surface charge, allow for product separation through a stationary phase that adsorbs opposite charged particles. By previously studying particle’s charge, using, for instance, Zeta-potential assays, the right conditions can be achieved and product’s purity can be maximized. Depending on the column being positively or negatively charged, IEX chromatography is narrowly named anion-exchange (AEX) or cation-exchange (CEX), respectively. A great number of research has been developed using AEX chromatography for adenovirus purification, with presented results showing improvements regarding purity, virus particles’ and infection units’ yields [33,34,51,53,54].
Differently from size-exclusion, adsorption based processes require a second phase called desorption. This procedure allows product’s retrieval through the introduction of a perturbation, either being related to salt concentration, pH or any other. The induce change will unbalance the equilibriums in-place and as result release the adsorbed particles.
Hydrophobicity interaction chromatography (HIC) relies on “reversible interaction between a protein and the hydrophobic ligand” [53]. This strategy has been studied as intermediary purification step [32], as its conditions are quite mild compared to others in order to preserve biological activity, and offer the advantage of being optimized by higher salt concentration as the ones encountered after elution on a previous purification column [53].
Affinity chromatography is used complementarily to other strategies and is often associated with capture and polishing steps. Regarding adenovirus, metal affinity strategies have been tried against regular purification processes consisting in CsCl density gradients with great results [12]. This purification strategy depends on specific interactions between targeted molecule and column’s ligand. In this particular case, this bond is established between virus capsid and specific biological ligand coupled to the chromatographic matrix [49]. Like IEX and HIC, at the end of the adsorption step, the column is saturated and a clear majority of impurities have already been washed. Then through buffering change, the elution step results in a product with great purity through high selectiveness.
(4-(2-hydroxyethyl)-1-12
piperazineethanesulfonic acid) or TRIS (2-Amino-2-(hydroxymethyl)-1,3-propanediol). Different buffers allow good stability in a considerable operation range; for instance regarding pH, HEPES sustains equilibrium between 6.8 and 8.2 and TRIS from 7 to 9 [55].
Ionic strength is a major factor on buffer’s constitution and one of the biggest differentiation aspects between chromatography strategies. Regarding AEX targeting adenovirus purification, equilibration and washing steps have been reported with a variety of NaCl concentrations. Taking that into account, to ensure better process’ flexibility, research studies describe different introductions of salt concentrations through a gradient to the maximum of 400 mM of sodium chloride [7,12,13,23]. Concerning elution, different methods can be applied to elute adsorbed virus particles. Considering that the process is being conducted at a specific percentage of reagent B, if it’s raised gradually within a period, until reaching an established concentration, the elution was made with a gradient, otherwise, if B’s concentration is increased immediately, it’s called a step elution. Usually, strategies make use of gradient elution from washing/equilibration concentration until around 600 mM [23,32,41].
Besides salt and main component, buffers’ composition often includes few other substances which have specific contributions to the overall process. Most of these are related to adenovirus stability and include sucrose, MgCl2 and glycerol. Sucrose, for instance, has been
mentioned within a correlation study between concentration and “thermally induced structural changes”, arriving at the conclusion that increasing sucrose concentration stabilizes secondary and tertiary structures despite the fact that at 45 degrees Celsius, the quaternary structure is lost [56]. Regarding MgCl2, early studies included it on buffer’s formulations as a stabilizer [57].
However, more recent approaches to the matter couldn’t conclude association between both [58,59]. Nevertheless, 1 mM of MgCl2 was reported as virus capsid stabilizer under
high-temperature stress conditions [36,58]. Concerning glycerol, previous research has shown that it enhances virus integrity through capsid stabilization and so is often used in final formulation [13,60,61].
1.5 Overview of different purification pathways
13
Adeno
vi
rus
Pu
ri
fi
ca
ti
on
Bioreactor Bulk
Clarification
1
stUltra/diafiltration
AIEX Chromatography
2
ndUltra/diafiltration
SEC Chromatography
Figure 4 - Purification process for adenovirus using chromatography [7]
Using the purification process depicted in Figure 4 as a starting point, substitutions or suppressions can be made with the purpose of improving overall purification, reducing operation time, optimizing parameters, complying with the final formulation, or anything else that increments all around robustness and viability. Different approaches to previous steps have already been addressed, becoming now relevant to focus on chromatography and polishing.
Regarding substitutions to the purification train, a great number of studies have been reported since Huyghe et al. [32] described chromatographic purification strategies using five different resins, from the conventional AEC (Source 15 Q) to more complex approaches like Immobilized Zinc Affinity chromatography (IZAC) or HIC [32]. Since then, changes regarding different chromatographic medias, process parameters and buffers allowed process viability and potential scale ability to use in clinical trials.
14
Lee et al. [12] approached polishing strategies. The reported work describes an improved procedure supported on metal affinity membrane chromatography (MAMC) as a replacement for the more common, and perhaps “established”, SEC chromatography [12], making an overview of the entire chromatography spectrum focusing on yields and purity. As the main difference, membrane chromatography presents larger pore sizes and the possibility to operate at higher flow rates, while remaining the support for relevant ligands. The study directly compared membrane and resin affinity chromatography resulting in a 32% increased yield on membrane usage. Associated with this improvement, it’s theorized that the usage of MAMC as a rapid flow-through process to remove empty capsids (defective particles) can be a source of viability, affecting clinical consistency on adenovirus provisions [12,62].
As mentioned before, besides improvement through regular process optimization, reported studies showed focus on suppression of different steps, introducing new platforms or techniques that allow multiple levels of purification in only one or, for instance, a counter-current operation of the chromatographic system. Examples of this strategies were demonstrated by Peixoto et al. [23] and Nestola et al. [7], presenting results about expanded bed chromatography and simulated countercurrent chromatography using two SEC columns, respectively.
Expanded bed chromatography introduces an alternative to early purification steps, allowing suppression of clarification and concentration associating them to the initial chromatography [23]. Reports of virus lost from 25 to 80 percent, during harvest due to early cell lysis [63], enhances needed optimization of such strategies. This can be done directly from the unclarified medium, as it’s reported. This strategy consists of a stable fluidized bed that allows particles from the feedstock to pass through, introducing several degrees of purification, permitting for a single step to combine the usual two or three. Associated with reduction of steps, are increased economic viability, overall process yields and reduction of expended time, all supporting expanded bed chromatography as a viable and attractive technique for cost-effective processes [23,64].
1.5.1 Multicolumn chromatography
15
been reported for a great variety of purposes, from the production of plasmid DNA (pDNA) [65] to influenza virus [66], with more general and amplified studies also being made considering it as a possible strategy for the future of bioseparation [67,68]. SMB allows higher productivity and yields through maximization of column’s used capacity while reducing both buffer’s consumption and needed column’s volume [7]. These advances reduce overall investment and increase attractiveness, justifying more research on this approach as a purification strategy for bioprocesses [66,69,70].
In a countercurrent chromatography system, while the mobile phase flows in opposite direction of the stationary phase, the solutes will be selectively attracted to one or another phase. The relation between phases and components is figuratively explained by Figure 5. As it’s demonstrated in single column elution chromatography, the outcoming product may lack enough differentiation from remaining impurities. On the other side, countercurrent chromatography establishes different phase “motions” and allows for better separation results, as shown both in column’s chromatography profile (Fig. 5 b, c).
16
Taking advantage of this scenario, a cycle of columns can be arranged to ensure selective separation for a specific set of conditions, introducing complexity and optimization while allowing better yields and productivity, as mentioned before.
The two-column, in open-loop, SEC purification step by Nestola et al., included 10 two-way valves which controlled intended flows, 2 HPLC pumps (one for sample and one for fresh mobile phase), 2 UV detectors on the effluent of each column and 2 SEC’s columns, as shown in Figure 6. This scheme narrows column’s flow through to one of three situations; either it is frozen, directed to the other column, or being diverted to the product or the waste lines [7]. When compared to a single batch SEC, the reported approach led to similar results in what regards impurity removal but allowed for a 51% increase in virus yield with a 6-fold increment to column’s productivity [7].
Figure 6 - Two-column, in open-loop, SEC purification step (P – Product; F – Feed; W – Waste; E – Eluent) [72]
These continuous purification strategies introduce a new range of possibilities and approaches to some, otherwise, difficult and expensive procedures. Different technologies have been introduced in comparison with batch chromatography and many research has been done reviewing both [73–75].
17
processing can be considered depending on scale, propose or objective. Regarding more complex mixtures, namely binary or ternary, further laboured mechanisms have got to be taken into consideration, such as SMB or multicolumn solvent gradient purification (MCSGP) and gradient steady-state recycling (GSSR), respectively [76,77]. In fact, MCSGP has also been addressed as a purification method for biomolecules [78–80].
1.6 Modelling
The constantly evolving field of purification, and namely purification through chromatography is permanently improving or innovating in order to answer the increased demand for better, more efficient and robust strategies. The constant research and development (R&D) needed to ensure that this goal is achieved requires time, money and knowledge that are, in most case, short or applied elsewhere. So, the landscape presented itself for a descriptive, yet experimentally validated, approach that could please both worlds.
The R&D improvement was made through multiple attempts, in a trial-and-error system, adjusting distinct aspects and characteristics, eventually narrowing it down to the perfect ones that maximized intended objectives and complied with products’ specifications. This process had many bottlenecks that started from being time-consuming, requiring expensive material and personal investments to the amount of adjustable parameters (buffer, salt column or pH [81]). With these problematics, conducting development and research using this strategy is hard, delayed and, far and for most, not viable.
The solution requires process’ description through related equations of mass, flow, adsorption and others, that can reliably replicate what is or can be experimentally obtained. Using modelling as purification tool provides with impressive results while sparing precious time and resources. This approach allows for increased efficiency in development, robustness, economic viability, flexibility and system control [81].
18
1.7 Analytical Methods
The overall process results and comparative studies depend on yields and removals calculated through established methods that evaluate a specific impurity or the actual and intended product. On bioprocesses concerning virus, the main impurities are host cell DNA and proteins. From the range of methods involved in the studied process, some were not only used for yield accounting but also for product characterization, due to their different applications or equipment’s polyvalence.
Considering that every decision and conclusion about a strategy taken is laid upon established methods of analytical quantification, these are a keystone on process validation and execution. Their outcome can make or break a chosen strategy, justify novel approaches, enhance innovative studies or even discard a route taken. So, their validation must be taken seriously, as everything is depending on them. Multiple reviews have been done about this theme and method validation, considering the increased importance on food and drugs processes [85–87].
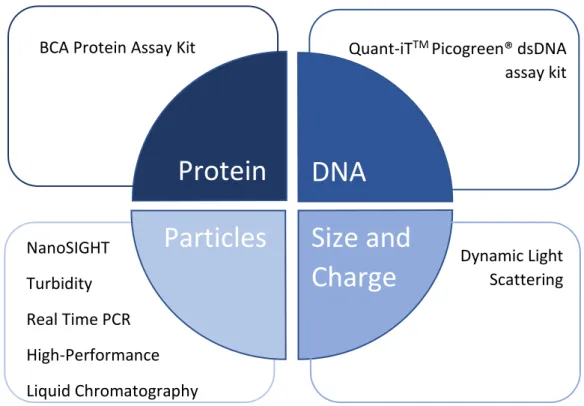
The process considered, reviewed and studied was quantified with the analytical methods showed at the following diagram (Fig. 7).
Figure 7 - Analytical Methods
NanoSIGHT
Turbidity
Real Time PCR
High-Performance
Liquid Chromatography
BCA Protein Assay Kit
Quant-iT
TMPicogreen® dsDNA
assay kit
Dynamic Light
Scattering
Protein
DNA
Particles
Size and
19
2
2
Methods
and Materials
21
2.1 Virus production
A549 cells were amplified in T-flasks, then in HYPERflask® before being inoculated at a concentration of 0.55x10⁶ cell/ml. A 5 litres bioreactor was prepared for virus production. As
operation parameters, the pH was settled at 7.2 and controlled by aeration with a gaseous CO2
and 1 M NaHCO3, the dissolved oxygen was controlled at 40% air saturation by gas mixing with
a temperature of 37 ºC and gas flow of 0.2 L/min.
2.2 Clarification
The process started with a filter A, used to remove larger impurities, which has a pore size of 5 µm and 0,2 m2 of membrane surface area, followed by a second filter B with pores of
0,2 µm and a membrane area of 0,1 m2 to ensure maximum clarification.
Before starting, the filters were primed with 3 capsule volumes of water to remove preservative solutions and then equilibrated with working buffer (3 capsule volumes). For process monitoring, flowthrough and pressure overtime were measured. After each step, the effluent stream was sampled and analysed to evaluate process yields and removal ratios.
2.3 Ultra/Diafiltration
The clarified bulk was concentrated with a predefined strategy to ensure a certain virus concentration and impurity removal. The concentration was tested using tangential flow filtration (TFF) with Sartorius Slice 200 with a pore size of 300 kDa and an area of 200 cm2. The
system was fed with a stable flow rate of 100 ml/min, using a Tandem 1081 Pump or SartoFlow Smart, both from Sartorius Stedim Biotech, established after adjusting previous trials results regarding protocol Shear factor (0.8 to 1 bar) and membrane surface area.
22
(Spectrum Laboratories, Inc., USA) connected to a Midject pressure display unit (Amersham Biosciences Corp., USA).
𝑇𝑀𝑃 =𝑃𝑓− 𝑃2 𝑟− 𝑃𝑝
Permeate volumes were taken every few minutes with a technical scale (TE4101, Sartorius Stedim Biotech, Germany) connected to system pump. This methodology allows system calibration and throughout process monitorization in order to accomplish concentration factors and diafiltration volumes. After reaching desired final values, the TFF system was drained, with special enhancement on recovering virus retentate.
All process steps were conducted discontinuously which allowed sample collection from each flow and determination of overall yields and impurity removal ratios. When it was over, a complete sanitation was performed which consisted of multiples volumes of water and sodium hydroxide (0,5 M).
2.4 Purification (AEX)
The concentrated virus solution was purified by column chromatography in a bind-elute system using anion-exchange adsorbers. The chromatography trials were performed with different column mediums, including AEX resins (A and B) and a membrane.
After correctly assembling the column on ÄKTA explorer 10 liquid chromatography system (GE Healthcare, U.K.), a cleaning-in-place run was made to, once again, ensure total removal of preservative solution, followed by equilibration until stable UV signal. The chromatography runs were conducted at a flow rate 2.3 ml/min which corresponds to 300 cm/h of flow velocity.
Operation buffers were composed by 50 mM HEPES, pH 7,5 with 0 mM of NaCl for loading/running/washing or 2 M of NaCl for elution buffer. Before being used, each buffer was filtered with a 0,2 µm membrane filter (VacuCap® 90 PF Filter Unit). The ÄKTA system is associated with fractionator FRAC-950 (Amersham Biosciences Corp., USA), that allows precise and accurate fraction recovery after assessing correctly ÄKTA internal dead volumes.
23
2.5 Polishing (Size Exclusion Chromatography)
Purified viruses from the eluted pool were further treated using a size-exclusion chromatography column connected to the same ÄKTA system. The selected resin was packed inside an XK 16/20 column.
Due to the flow through working principles of a SEC column, only one buffer was used when polishing the adenovirus bulk, in this case, the HEPES solution without salt concentration. The column was loaded with a maximum of 20% of its volume and the runs were performed with a flow rate of 4 ml/min.
Identically to what was done after purification, a sample was taken from the polished virus pool to evaluate virus yields and the presence of impurities.
2.6 Analytical methods
2.6.1 Total protein quantification
The amount of proteins was quantified using BCA Protein Assay Kit (23227, Thermo Scientific, USA) according to the recommendations and manufacture’s protocol. The calibration curve was established with bovine serum albumin (BSA) (23209, Thermo Scientific, USA). Predefined dilutions were applied in duplicate or triplicate, to ensure a measurement of average and standard deviation of each assay.
The absorbance was quantified at 562 nm on Infinite® PRO NanoQuant (Tecan, Switzerland) microplate multimode reader using a clear 96-well microplate (260895, Nunc, USA).
2.6.2 Total dsDNA Quantification
Using Quant-iTTM Picogreen® dsDNA assay kit (P7589, InvitrogenTM, UK), the amount of
24
NanoQuant (Tecan, Switzerland) by measuring samples fluorescence in a flat transparent black 96-well microplate (3603, Corning, USA).
2.6.3 Nanoparticle Tracking Analysis
The concentration and size distribution of adenovirus was measured using NanoSIGHT NS500 (NanoSIGHT Ltd, UK). In this assay, each sample was diluted using D-PBS (14190-169. Gibco®, UK) to ensure that particle concentration was between the instrument’s linear range, meaning from 108 to 1010 particles per millilitre. All measurements were analysed with
Nanoparticle Tracking Analysis (NTA) 2.3 Analytical software and performed at 23.3º C. The analysis is made through a 60-seconds video for each sample adjusting capture settings manually, namely shutter and gain, and considering particle size between 70 and 120 nanometres.
2.6.4 Turbidity analysis
Samples turbidity was obtained with 2100Qis Portable Turbidimeter (HACH, USA) in contrast with the standard provided. The instrument measures scattered light at a 90-degree angle from the incident light with a dilution of 1:3 applied to the sample. The results are obtained by directly applying the dilution factor to the displayed value. This instrument was selected for clarification assays because it measures heavily impure bulks that are otherwise unreliable to quantify.
2.6.5 Dynamic Light Scattering
25
it. All measurements followed standard procedure considering protein as samples and water as the dispersant, with 30 seconds of equilibration/optimization time. The analysis was done with ZetaSizer software 7.11 (Malvern, UK) at 25 degrees Celsius, considering a maximum amount of 100 measurements, but never less than 10 per run.
2.6.6 Quantitative Real Time PCR
Virus DNA was extracted and purified with High Pure Viral Nucleic Acid Kit (Roche Diagnostics, Germany) according to manufacturer’s instructions after previous digestion of viral suspension with DNase following standard procedures. Genome containing particles were measured by real time quantitative PCR (q-PCR) using respective protocol and LightCycler 480 (Roche, Germany).
2.6.7 High-Performance Liquid Chromatography
The High-Performance Liquid Chromatography (HPLC) method using a column with size-exclusion resin was introduced to evaluate sample content, concerning both virus and impurity concentrations. The TSKgel G5000PW column (TOSOH Biosciences, Japan) was connected to the ÄKTA system described above or to the WATERS 2695 Separation Module (Waters, USA).
27
3
3 Implementation and
Development of an analytical
tool for process monitoring
29
3.1 The need for reliable analytical methods
The uprising specification complexity and narrowing on the quantity of impurities allowed in every step of the process increases the research for reliable and robust analytical methods that can provide real time data in the most efficient way. Alternatively, for product control on a specific process step, there is a need for a tracking assay that could present trustworthy results while requiring minimum operator dependence and ensuring throughout precision and accuracy.
In order to achieve it, an orthogonal method was tested and calibrated with the product, which made use of two previous presented methods, providing distinct types of data that can be easily correlated through a calibration curve. Even though the pore size of the SEC column guarantees that the viruses elute in the porous volume, a NanoSIGHT tracking analysis ensures that the measurement obtained doesn’t represent aggregates and other particles. The respective values obtained by NanoSIGHT NS500 (NanoSIGHT Ltd, UK) and High-Performance Liquid Chromatography (HPLC-SEC) were associated and a thorough analysis of each method to ensured maximum applicability and will be discussed further on.
The appealing factor of this approaches comes from being an alternative for virus quantification different than qPCR which is expensive and time-consuming, requiring simpler procedures with the same reliable results.
3.2 NanoSIGHT Calibration Curve
30
Figure 8 - NanoSIGHT assay with 3 measurements
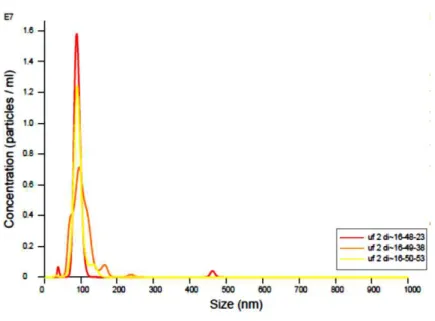
NanoSIGHT was evaluated on a TFF concentration and diafiltration process, with results being reported below (Fig. 9). These steps include a two-fold concentration and four times diafiltration for buffer exchange. The results were obtained after 3 to 5 replicates of each sample to increase precision.
Figure 9 - NanoSIGHT assay for Ultra/Diafiltration
Even though it decreases productivity and consumes valuable time, this assay must be considered, as its outcome is most valued for process monitoring.
N a n o S IG H T
P
a
rt
ic
le
s
(
T
P
/m
l)
Initi
al
UF
DF
1
DF
2
DF
3
DF
4
0
1 .01 01 0
2 .01 01 0
3 .01 01 0
31
Taken that into account, an experiment was done with the diafiltrated product in order to establish a relation between particle concentration and dilution factor for further method implementation in correlation with HPLC-SEC. The product was diluted as far as 10 times, and the initial concentration was measured 5 times to ensure maximum accuracy. The results show that a tendency line with almost 0.93 of correlation factor (Fig. 10) is achieved and an association can be made with another method for the same dilutions applied.
Figure 10 - NanoSIGHT Correlation
3.3 HPLC-SEC Calibration Curve
The application of HPLC as an analytical method introduces great reliability and allows for impartial and intemperate results as the outcome doesn’t rely on technician’s adjustments.
The use of a size-exclusion column (TSKgel G5000PW) ensures that the viruses are not caught on the matrix, as it’s demonstrated by Figure 3, and produces a simple chromatogram that shows the magnitude of its present species in the mixture as it flows through the column. According to the expected concentration of the sample, the injected amount can be optimized to ensure that a proficient reading is obtained. Besides relation between presence and peak intensity, different wavelengths can be selected to monitor different biomolecules.
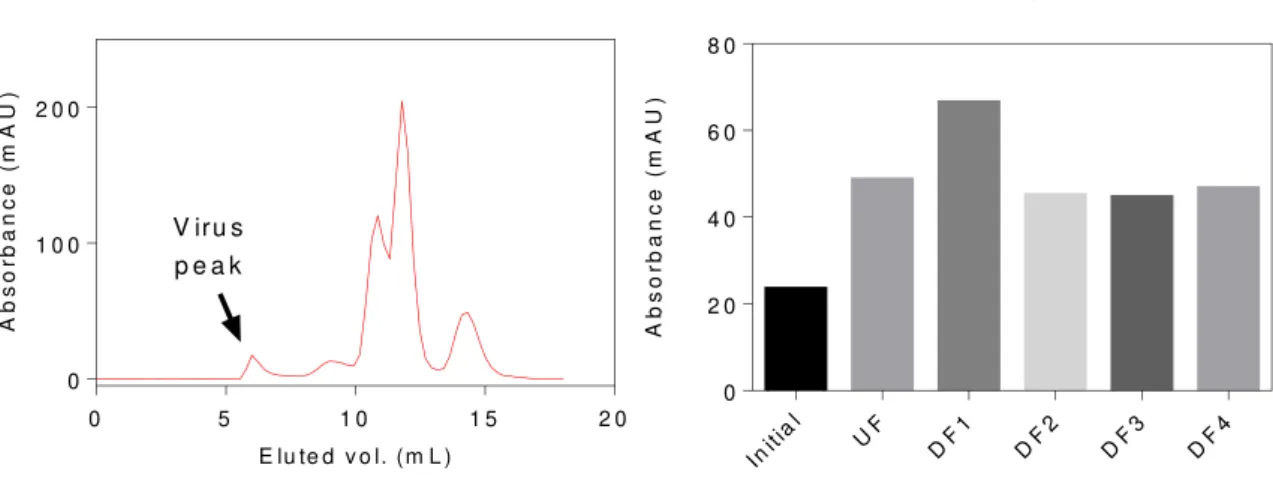
As was done before, another TFF process was monitored by HPLC-SEC after clarification (Fig. 11). The results were obtained with injections of 100 microliters allowing for complete flowthrough before the next sample is introduced.
N a n o S IG H T C o rre la tio n
D ilu tio n F a c to r
P
a
rt
ic
le
s
(T
P
/m
l)
0 .0 0 .2 0 .4 0 .6 0 .8 1 .0 1 .2
0
1 .01 01 1
2 .01 01 1
3 .01 01 1
Y = 2 ,4 4 e 1 1 x
32
Figure 11 - HPLC-SEC assay for Ultra/Diafiltration (wavelength 280 nm)
With this approach, the interpretation and data analysis between steps is direct and easily understandable, as the volume injected is the same, the peaks magnitude depends only on species presence. As mentioned before, these peaks were fractionated and analysed with NanoSIGHT to ensure that corresponded to single virus and not aggregates. For the presented flowthrough intensities, a wavelength of 280 nanometres was used as it is the most common to trace proteins.
In order to make sure that the obtained intensities are to be taken seriously, a study was made correlating known dilutions and chromatography monitoring. This approach started upon several repetitions of the initial concentration and going until 5% of this value.
Later on, to evaluate the upper limits of the quantification the initial sample was concentrated 2 and 5 times (Fig. 12). As mentioned above, the 5-fold concentration required a smaller injection to be made and only 50 microliters were loaded. The calculations for this procedure are direct, as half of volume injected corresponds to half intensity detected.
0 5 1 0 1 5 2 0
0 1 0 0 2 0 0
E lu te d v o l. (m L )
A b s o rb a n c e ( m A U )
V iru s p e a k
H P L C - S E C
33
H P L C - S E C C o r r e la tio n
D ilu tio n F a c to r
A b s o rb a n c e ( m A U )
0 .0 0 .5 1 .0 1 .5 2 .0 2 .5 3 .0 3 .5 4 .0 4 .5
0 1 0 0 2 0 0 3 0 0 4 0 0 5 0 0
Y = 1 0 7 ,9 x
Figure 12 - HPLC-SEC Correlation (wavelength 280 nm)
This chart illustrates that the obtained results from HPLC are robust and reliable, with concentration and dilution factor exhibiting a linear dependence. The data points were obtained by integration of the chromatogram in UNICORN. The results have a 0.99 correlation factor to the trendline which describes them.
3.4 Combined approach
By combining these two methods it is possible to ease the task of process monitoring and facilitates tracking of yields and particle accountability in every step.
As it’s demonstrated by the correlation factor, or standard deviation, on the represented trending lines, the HPLC produces a much more accurate group of measurements. This fact combined with its direct and untampered procedure, cement it as a great analytical method for bioprocesses.
The interest in associating these methods comes from the requirement of establishing yields and meeting specifications that are accounted in particles present on a certain volume. As NanoSIGHT provides it with relatively low precision, the HPLC can complement it and facilitate the acquiring procedure. In order to achieve it, a calibrated correlation has to be established by several analyses on both systems.
The method used for this calibration relied on introducing the same samples in both types of equipment and correlating them until a certain degree of concentration or dilution.
34
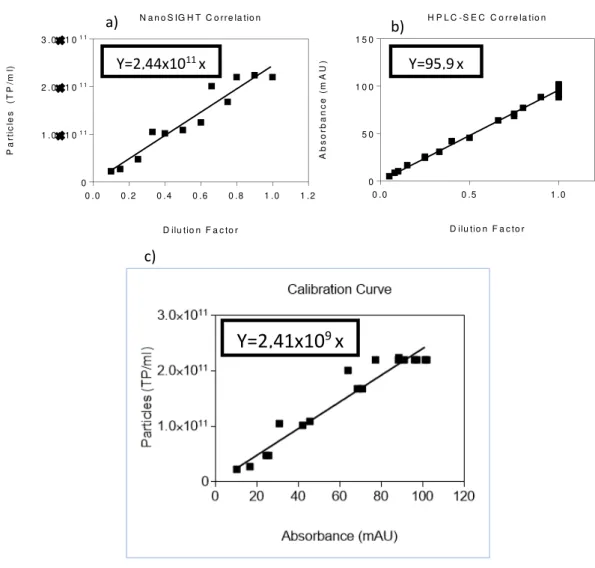
Meaning that in higher or lower concentration, adjustments were made in each assay to ensure correct measurements. Furthermore, to confirm method robustness some samples were introduced several times, in particular, the initial concentration obtained from the filtration processes. The individual data was ranged for both validation limits to ensure that the correlation chart had maximum compatibility (Fig. 13 a, b, c).
N a n o S IG H T C o rre la tio n
D ilu tio n F a c to r
P a rt ic le s (T P /m l)
0 .0 0 .2 0 .4 0 .6 0 .8 1 .0 1 .2
0 1 .01 01 1
2 .01 01 1
3 .01 01 1
Y = 2 ,4 4 e 1 1 x
H P L C - S E C C o r r e la tio n
D ilu tio n F a c to r
A b s o rb a n c e ( m A U )
0 .0 0 .5 1 .0
0 5 0 1 0 0 1 5 0
Y = 9 5 ,9 x
Figure 13 - NanoSIGHT correlation for design range (a),
HPLC-SEC correlation for design range(wavelenght 280 nm) (b), Correlation curve (c)
The obtained trendline presents a correlation factor of 0.94, which makes for a reasonable tool for process monitoring. Considering this approach is possible to evaluate each step taken by introducing the respective samples on the equipment overnight and access to progress made without spending valuable time and expensive resources.
a) b)
c) Y=2,44x10¹¹ x
Y=2,41x10
9x
35
3.4.1 Detection Limits and Errors
The validation limits of a method establish the range of its applicability by determining where the results obtained are a viable measurement of reality. These parameters include the determination of minimum and maximum limits and the error associated with the tendency line that describes the evolution of the experience.
The minimum detectability (D) is a parameter which includes a determination of equipment’ sensibility (S) and amplitude of noise taken through the assay (N). The first is calculated with the peak obtained (E) by introducing a previously characterized sample with known concentration (Ci) (Eq. 2). The noise amplitude (N) is a result of absorbance at the
baseline within a time frame (Fig. 14). With these determined, the minimum detection limit was calculated at 4,7*109 particles per millilitre which correspond to 1,95 mAU when using the
HPLC-SEC assay (Eq. 3).
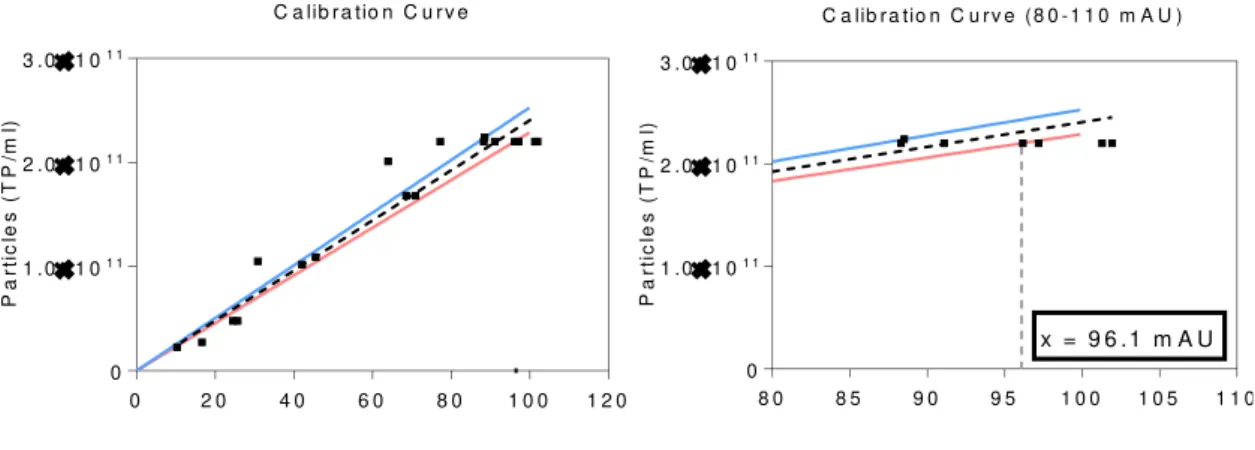
The maximum particle concentration from which linearity isn’t verified was determined with the correlation curve and the attachment of specific new lines (Fig. 15). These new ones correspond to a deviation of 5 % to the line slope and establish the limit from where the measurements are not trustworthy. With the charts analysis, it’s concluded that the maximum amount of particles per millilitre correctly detected by the method is 2.32x10¹¹ or 96.1 mAU.
Figure 14 - Noise amplitude at the baseline (wavelength 280 nm)
𝑆 =𝐶𝐸
𝑖 (2)
𝐷 =2𝑁𝑆 (3)
1 0 7 1 0 8 1 0 9 1 1 0 1 1 1 1 1 2 1 1 3 1 1 4 1 1 5 - 4
- 2 0 2 4
E lu te d v o l. (m L )
36 C a lib r a tio n C u r v e
A b s o r b a n c e ( m A U )
P a rt ic le s ( T P /m l)
0 2 0 4 0 6 0 8 0 1 0 0 1 2 0 0
1 .01 01 1
2 .01 01 1
3 .01 01 1
A b s o r b a n c e ( m A U )
P a rt ic le s ( T P /m l)
8 0 8 5 9 0 9 5 1 0 0 1 0 5 1 1 0 0
1 .01 01 1
2 .01 01 1
3 .01 01 1
x = 9 6 .1 m A U
C a lib r a tio n C u r v e ( 8 0 - 1 1 0 m A U )
Figure 15 - Maximum particle concentration acceptable, right figure is focused on the 80 – 110 mAu region of the left plot
After completing the limitation ranges, it’s relevant to establish error margins to correctly express a measurement of quantity. These boundaries were calculated with the tending line and experimental data, obtaining a value that induces certainty to experimental results. With this in consideration, it’s possible to conclude that from 1,95 to 96,1 mAU, the number of particles per millilitre can be calculated with an error of 8,2x10⁹ TP/ml. This margin
can have different significance depending on the stage of the process. For instance, clarified bulks have around 1010 TP/ml which makes the error being close to 20%. For the following steps,
37
4
4
Results and
Discussion
39 Bioreactor Bulk
Clarification
1stUltra/diafiltration
AEX Chromatography
2ndUltra/diafiltration
4.1 Development of a purification process for oncolytic virus
The optimization and development are the focus on research studies applied to downstream as its improvement is directly related to overall applicability and most important, viability. Depending on the knowledge that precedes the intended product, the focus on development could be differentiated between a completed analysis of each step needed to achieve planned goals or directing all efforts to optimize a particular step for maximum productivity.
The implemented purification process for oncolytic viruses englobes a series of increasing complexity steps that require a wide variety of means and induce the product to several environment changes (Fig. 16). Nevertheless, the acceptance and recognition of this strategy are relentless proven by the reported yields obtained from it when applied to different oncolytic viruses. These results justify that for recently discovered oncolytic viruses, this is the fall-back procedure used for purification. With more research and as their behaviour in different conditions is known, the overall process with the focus on downstream can be improved with recently developed strategies for each step.
Figure 16 - Standard downstream processing train for adenovirus purification [7]
40
4.1.1 Clarification studies
After bioreactor production and cell lysis, the adenovirus bulk initiates the downstream processing train with clarification. The focus on this step is the removal of larger impurities like cell debris. In order to accomplish it, a 2-step filtration strategy was tested as previously mentioned. The decreasing of pore size ensures maximum impurity removal while controlling pressure and folding layer issues.
Before initiating a step clarification, the depth-filter must be cleansed with equilibration buffer to ensure complete removal of the preservative agent. After this stage, some measurements of flux are taken at different flow rates (120, 200 and 333 ml min-1) for both
filters to determine the maximum achieved. These assessments are made only with buffer as maximum flux is only obtained when the membrane isn’t obstructed (Table 3). At the same time, the pressure increment was tested for each named flux to establish a baseline to use at clarification (Fig. 17).
Table 3 - Water Fluxes for different filters: (A) and (B) calculated from observed Flow rates
Filter A (5 µm pore, 0,2 m2)
Flow Rate (ml.min-1) 110 197 319
Area (m2) 0.2
Flux (L.min-1m2) 33 59 96
Filter B (0,2 µm pore, 0,1 m2)
Flow Rate (ml.min-1) 99 196 325
Area (m2) 0.1
41
Figure 17 – Pressure variation for different filters: A (a), B (b) for observed water fluxes
The increasing pressure observed along the procedure is caused by the cumulative pore clogging (Fig. 18), this result justifies the decrease of flux observed despite the positive displacement of the pump.
Figure 18 - Pressure over time: A with a pore size of 5 µm (a), B with pores of 0,2 µm (b)
The clarification results were assessed with NanoSIGHT and turbidity assays. The outcomes prove the previous runs made and demonstrate the efficiency of filters and strategy chosen. The turbidity analysis proves the clearance of a sample in comparison with an established reference and as wanted, the initial sample is much denser than the clarified one (Fig. 19 a). Instead of using the implemented HPLC-SEC method, due to impurity content at this stage, a direct NanoSIGHT assay was performed to evaluate the number of particles present and the yield of clarification achieved with this 2-step strategy (Fig. 19 b). The results obtained with
a) b)
a) b)
Y=2,01x10⁻⁴ x + 4,1x10⁻²
![Figure 1 - Oncolytic viruses diversity (a) and implemented modes of action (b) [8]](https://thumb-eu.123doks.com/thumbv2/123dok_br/16503651.734147/25.892.242.652.773.1101/figure-oncolytic-viruses-diversity-implemented-modes-action-b.webp)
![Figure 3 – HPLC-SEC chromatography profile (wavelength 280 nm) [7]](https://thumb-eu.123doks.com/thumbv2/123dok_br/16503651.734147/32.892.277.625.567.1076/figure-hplc-sec-chromatography-profile-wavelength-nm.webp)
![Figure 4 - Purification process for adenovirus using chromatography [7]](https://thumb-eu.123doks.com/thumbv2/123dok_br/16503651.734147/35.892.199.730.106.426/figure-purification-process-adenovirus-using-chromatography.webp)
![Figure 5 - Elution (a) and Countercurrent Chromatography (b, c) [71]](https://thumb-eu.123doks.com/thumbv2/123dok_br/16503651.734147/37.892.257.632.578.1062/figure-elution-countercurrent-chromatography-b-c.webp)
![Figure 16 - Standard downstream processing train for adenovirus purification [7]](https://thumb-eu.123doks.com/thumbv2/123dok_br/16503651.734147/61.892.179.742.634.1003/figure-standard-downstream-processing-train-adenovirus-purification.webp)
