cytochRoMes fRoM D. Desulfuricans
aNd s. frigiDimarina
Oeiras, september 2010
VítOr manuel bOrdOna de sOusa paixãO
ackNowLedgeMeNts
No scientific work is ever the product of one person’s efforts, and cer-tainly this one was no different. I have been very fortunate over the years to collaborate with many supportive friends and colleagues with-out whom this work would not have been possible.
My biggest thanks go to my supervisors; Prof. António Xavier for the enlightened leadership, warm encouragement and guidance and to Prof. David Turner for his patience, advice and expertise.
I am also deeply grateful to Prof. Carlos Salgueiro, upon whose assistance I have called far more often than is reasonable, for his friendship, gen-erosity and support over the years. A special thanks goes to Dr. Miguel Pessanha for all the help with NMR spectra and the useful suggestions in the darkest hours.
I would like to thank Dr. Ricardo Louro for introducing me to NMR spectroscopy and for valuable assistance during the first years in the lab; and Isabel Pacheco for the growth and help with the purification of cytochrome c3 from D. desulfuricans. I would also like to thank Fátima Madeira for her generosity and help with the bureaucratic affairs and to all the former members of Prof. Xavier’s group; Prof. Teresa Cata-rino, Dr. Catarina Paquete, Dr. Patricia Pereira, Dr. Ilídio Correia and Prof. António Aguiar for their friendship and excellent working envi-ronment.
During the writing of this thesis I held a position at Instituto Gulben-kian de Ciência in the neurobiology of action group. I am particularly grateful to Dr. Rui Costa for his patience, support and understanding even when the manuscript took time from the work in the laboratory. Last but not least I want to thank my family and friends for the un-conditional support and encouragement. A special mentioning to my mother and Dino for being there when I needed the most, and to Va-nessa for persistently persuade me to finish what it seemed like a never ending work.
Finally, I must acknowledge the ITQB for providing the excellent con-ditions under which this work took place and Fundação para a Ciência e Tecnologia for the funding.
Oeiras, August 2010 Vitor Paixão
ResuMo
Os citocromos tetrahémicos são proteínas solúveis com cerca de 80-120 aminoácidos em que os quatro grupos hemo se encontram coordenados axialmente por dois resíduos de histidina. Estas proteínas foram iden-tificadas pela primeira vez na década de 1950 na bactéria Desulfovibrio vulgaris e, mais recentemente, em outros microrganismos.
As estruturas determinadas até à data por cristalografia de raios-X ou por ressonância magnética nuclear (RMN) para citocromos tetrahémi-cos isolados de Desulfovibrio spp. (Dc3), mostram que o núcleo central destas proteínas, formado pelos quatro grupos hemos, bem como o en-rolamento das proteínas, é conservado em todos os Dc3 apesar da baixa homologia das suas sequências de aminoácidos. A pequena dimensão destas proteínas, e a concomitante proximidade dos diferentes grupos hemo, fazem com que o estado de oxidação de um hemo altere o po-tencial de redução de um hemo vizinho (interações redox), os quais são também afectados pelo pH (interações redox–Bohr).
Deste modo, os citocromos tetrahémicos constituem um excelente mo-delo para investigação dos processos cooperativos associados à transfe-rência electrónica e transdução de energia nos sistemas biológicos. Tendo em vista a elucidação dos mecanismos estruturais/funcionais associados a estes processos utilizou-se a técnica de RMN para determinar as estru-turas tridimensionais em solução de dois citocromos tetrahémicos de dois microrganismos diferentes.
No Capítulo 1 desta Tese, apresenta-se uma breve revisão das caracte-rísticas mais relevantes do ponto de vista biológico e bioquímico dos microrganismos e proteínas em estudo. Neste primeiro capítulo são ain-da apresentados alguns aspectos ain-da técnica de RMN, com particular ênfase no cálculo dos desvios dipolares e dos tensores de susceptibilidade magnética em proteínas paramagnéticas. No Capítulo 2 descrevem-se os conceitos básicos da espectroscopia bi-dimensional de RMN e métodos de cálculo de estruturas em solução.
No Capítulo 3 apresentam-se as estruturas em solução da forma reduzi-da e oxireduzi-dareduzi-da do citocromo tetrahémico c3 de Desulfovibrio desulfuricans ATCC 27774. Este citocromo desempenha um papel fundamental no metabolismo energético deste organismo acoplando a transferência de electrões e protões para a hidrogenase e de todos os Dc3 já estudados é o único que apresenta dois centros redox-Bohr distintos. As estruturas na forma reduzida e oxidada foram determinadas a valores de pH inferiores aos pKa dos grupos envolvidos no efeito redox-Bohr, de forma a garantir que as variações encontradas entre as duas estruturas reflectissem apenas modificações associadas à alteração do estado redox da proteína. As alte-rações conformacionais observadas explicam a cooperatividade positiva entre os hemos 1 e 2.
Finalmente, no Capítulo 4 apresenta-se a estrutura de um novo citocro-mo tetrahémico isolado da bactéria Shewanella frigidimarina (Sfc) o qual se encontra envolvido na cadeia de transporte electrónico conducente à redução de Fe(III). A estrutura apresentada é a primeira estrutura em so-lução de uma proteína multihémica a ser descrita para Shewanella spp. A análise da estrutura do Sfc revelou a existência de um motivo estrutural claramente distinto do existente nos Dc3. O motivo estrutural identifi-cado para Sfc apresenta uma disposição dos hemos e enrolamento geral da cadeia polipeptídica semelhantes aos encontrados para o citocromo tetrahémico homólogo de Shewanella oneidensis e para o domínio N-terminal dos flavocitocromos de S. frigidimarina e S. oneidensis, cujas es-truturas foram determinadas por cristalografia de raios-X. Os resultados obtidos sugerem que a arquitectura dos centros redox é extremamente conservada entre os membros do género Shewanella, apesar da grande variabilidade verificada na sequência dos aminoácidos e potenciais de redução dos diferentes grupos hemo.
suMMaRy
Tetrahaem cytochromes are small soluble proteins with four non-planar haems with bis-histidinyl axial coordination that were first isolated from Desulfovibrio vulgaris in the 1950s and subsequently in several other bacteria. Even though the sequence homology, the amino acid com-position and the thermodynamic properties of the several tetrahaem cytochromes may be different; the overall haem core architecture and the general fold of the protein established by X-ray crystallography and nuclear magnetic resonance (NMR) are highly conserved.
Because of their small size, haem close proximity, redox and redox-Bo-hr (pH dependent) interactions, these cytocredox-Bo-hromes are an appropriate model to study cooperative processes in biological systems. In this The-sis NMR was used to determine three-dimensional solution structures of two tetrahaem cytochromes from two different organisms.
In Chapter One we present a basic introduction concerning the organ-isms and proteins studied in this work as well as some relevant topics of NMR, including the calculation of dipolar shifts and magnetic suscep-tibility tensor calculation for paramagnetic proteins. Chapter Two deals mostly with the description of two-dimensional NMR spectroscopy concepts and NMR solution structure calculation methods.
In Chapter Three we present the structures of cytochrome c3 from Des-ulfovibrio desulfuricans ATCC 27774 in the reduced (diamagnetic) and oxidised (paramagnetic) forms obtained from homonuclear NMR spec-tra. This cytochrome plays a central role in the energetic metabolism of its organism by coupling the transfer of electrons and protons to hy-drogenase. The studies were carried out at pH values below those of the groups involved in redox-Bohr interactions to ensure that conforma-tional changes detected between both families of structures will depend only on redox state. From all the cytochromes c3 from Desulfovibrio spp. (Dc3) characterized so far this one presents a distinctive pH dependence of its reduction potentials, involving two separate redox-Bohr centres
instead of just one in all of the other Dc3 studied so far. This work al-lowed us to infer critical information on the functional significance of the conformational modifications involved in the positive cooperativi-ties observed in this cytochrome.
Chapter Four reports the structure determination of a novel tetrahaem cytochrome isolated from Shewanella frigidimarina that is thought to play a central role in the Fe (III) reduction pathways of this organism. This is the first solution structure of a multihaem cytochrome isolated from Shewanella spp. The haem spatial disposition and the general fold of the protein show close similarities with the homolog tetrahaem cy-tochrome from Shewanella oneidensis (Soc) and the N-terminal domain from the periplasmic flavocytochromes isolated from S. frigidimarina and S. oneidensis. However this conserved structural motif is distinct from that of Dc3, suggesting a highly conserved haem core architecture for the members of the Shewanellaceae family in spite of the considerable diversity in their primary structure and haem reduction potentials.
PhysicaL coNstaNts
Planck constant h 6.626 068 76(52) x 10-34 J s
h/(2π) ħ 1.054 571 596(82) x 10-34 J s
Molar gas constant R 8.314 472(15) J mol-1 K-1
Boltzmann constant k 1.380 650 3(24) x 10-23 J K-1
Bohr magneton μB 9.274 008 99(37) x 10-24 J T-1
Electron magnetic moment μe -9.284 763 62(37) x 10-24 J T-1 in Bohr magnetons μe/μB -1.001 159 652 186 9(41) Electron gyromagnetic ratio γe 1.760 859 794(71) x 1011 s-1 T-1
Electron g-factor ge -2.002 319 304 3737(82)
Proton magnetic moment μp 1.410 606 633(58) x 10-24 J T-1 in Bohr magnetons μp/μB 1.521 032 203(15) x 10-3
aBBReviatioNs aNd syMBoLs
1D - One dimensional 2D - Two dimensional CO - Carbon monoxide
COSY - Correlation spectroscopy
Dc3 - Cytochromes c3 from Desulfovibrio spp.
Dd27c3 - Cytochrome c3 from Desulfovibrio desulfuricans ATCC 27774
DvHc3 - Cytochrome c3 from Desulfovibrio vulgaris Hildenborough, NCIB 8303 FID - Free induction decay
I (italic) - Spin quantum number
I (bold) - Angular momentum (vector)
IUPAC - International Union of Pure and Applied Chemistry lol - Lower distance limit
lov - Lower distance volume NMR - Nuclear Magnetic resonance NOE - Nuclear Overhauser effect
NOESY - Nuclear Overhauser enhancement spectroscopy PDB - Protein data bank
Ppm - Parts per million RF - Radiofrequency Rms - Root-mean-square
RMSD - Root-mean-square deviation SA - Simulated annealing
Sfc - Tetrahaem cytochrome c from Shewanella frigidimarina Sffcc3 - Flavocytochrome c3 isolated from Shewanella frigidimarina TAD - Torsion angle dynamics
TpIc3 - Type I cytochrome c3 TpII-c3 - Type II cytochrome c3
TOCSY - Total correlation spectroscopy upl - Upper distance limit
upv - Upper distance volume
μB - Electron Bohr magneton
aMiNo acid aBBReviatioNs
Alanine Ala A Arginine Arg R Asparagine Asn N Aspartate Asp D Cysteine Cys C Glutamate Glu E Glutamine Gln Q Glycine Gly G Histidine His H Isoleucine Ile I Leucine Leu L Lysine Lys K Methionine Met M Phenylalanine Phe F Proline Pro P Serine Ser S Threonine Thr T Tryptophan Trp W Tyrosine Tyr Y Valine Val VcoNteNts
Acknowledgements ... iii
Resumo ...v
Summary ...vii
Abbreviations and Symbols ...x
Amino acid abbreviations ...xi
Figures Index ... xvi
Tables Index ...xviii
chaPteR 1 - iNtRoductioN 1 haeM PRoteiNs ... 2
c-type cytochromes ... 3
Tetrahaem cytochromes c3 ... 4
Physiological role and thermodynamic properties of Dc3 ... 6
Physiological role and thermodynamic properties of tetrahaem cytochrome from Shewanella spp. ... 9
NucLeaR MagNetic ResoNaNce ... 13
Space quantization ... 13
Nuclear magnetization ... 15
NMR spectroscopy ... 16
Population of energy levels ... 17
Magnetization ... 19
The chemical shift ... 21
Scalar and dipolar couplings ... 22
Relaxation ... 24
Nuclear Overhauser Effect (NOE) ... 27
Hyperfine shift ... 30
Determination of the magnetic susceptibility tensor ... 32
chaPteR 2 - MateRiaLs aNd Methods 41
two-diMeNsioNaL NMR sPectRoscoPy ... 42
NMR stRuctuRe deteRMiNatioN ... 44
Sample preparation ... 45
Spectra acquisition and resonance assignment ... 45
Determination of structural constraints ... 47
Structure calculation and refinement ... 48
sPiN diffusioN ... 50
PaRaMagNetic Leakage coRRectioN ... 52
RefeReNces ... 53
chaPteR 3 - Redox LiNked coNfoRMatioNaL chaNges iN DD27c3 57 aBstRact ... 58
iNtRoductioN ... 58
MateRiaLs aNd Methods ... 60
Sample preparation ... 60
NMR spectroscopy ... 61
Assignment and integration ... 62
Determination of restraints ... 63
Additional restraints ... 65
Correction of volume restraints for the oxidised state... 66
Dipolar shifts as restraints for the oxidised state ... 67
Structure calculations ... 68
Structure analysis ... 68
Diamagnetic chemical shift calculations ... 69
ResuLts ... 69
Structure determination for the reduced state ... 69
discussioN ... 80
Comparison between the solution structures of the reduced and oxidised states ... 80
Structural basis for the redox and redox-Bohr couplings ... 84
coNcLusioNs ... 86
Acknowledgment ... 87
RefeReNces ... 87
chaPteR 4 - soLutioN stRuctuRe of a tetRahaeM cytochRoMe fRoM shewanella frigiDimarina 91 aBstRact ... 92
iNtRoductioN ... 92
MateRiaLs aNd Methods ... 94
Bacterial growth and protein purification... 94
NMR sample preparation. ... 94
NMR spectroscopy ... 95
Assignment and integration ... 96
Determination of restraints ... 97
Additional restraints ... 97
Structure calculation and analysis ... 98
ResuLts ... 99
Sequential assignment ... 99
Restraints and structure calculations ... 100
Quality analysis of the structures ... 101
discussioN ... 103
Comparison of the Sfc and Soc structures ... 103
Comparison of the Sfc and N-terminal domain of flavocytochrome c3 structures ... 105
Structural basis for the electrostatic origin of the Sfc redox interactions ... 106
Structural mapping of the haem reduction potentials ... 107
coNcLusioNs ... 111 RefeReNces ... 112
chaPteR 5 - iNtegRated oveRview 117
iNtegRated oveRview ... 118 RefeReNces ... 121
aPPeNdix a1
aPPeNdix ... a2 Tables with the thermodynamic parameters determined
for various Dc3 and Sfc ... A2
Tables with the macroscopic pKas for the ionisable centres
for various Dc3 and Sfc ... A5
figuRes iNdex
figure 1.1 - Structure of protoporphyrin IX of haem group c . ... 2
figure 1.2 - Ribbon diagram of cytochrome c3 oxidised structure by NMR from D. desulfuricans ATCC 27774 (Dd27c3). ... 5
figure 1.3 - Proposed physiological model for the metabolism of genus Desulfovibrio. ... 6
figure 1.4 - Physiological model of the biochemistry suggest-ed to be involvsuggest-ed in electron transfer to extracellular insoluble Fe(III) oxides in Shewanella spp ... 10
figure 1.5 - Comparison between the relative positions of the haem binding motifs and haem axial ligands ... 11
figure 1.6 - Haem core comparisons between Sfc, Dd27c3 and Sffcc3. ... 12
figure 1.7 - Nuclear spin energy levels of spin-1/2, spin 1 and spin 3/2 nucleus . ... 15
figure 1.8 - Spin populations. ... 19
figure 1.9 - Resultant magnetization M ... 20
figure 1.10 - Energy levels and spectrum of a two spin system ... 23
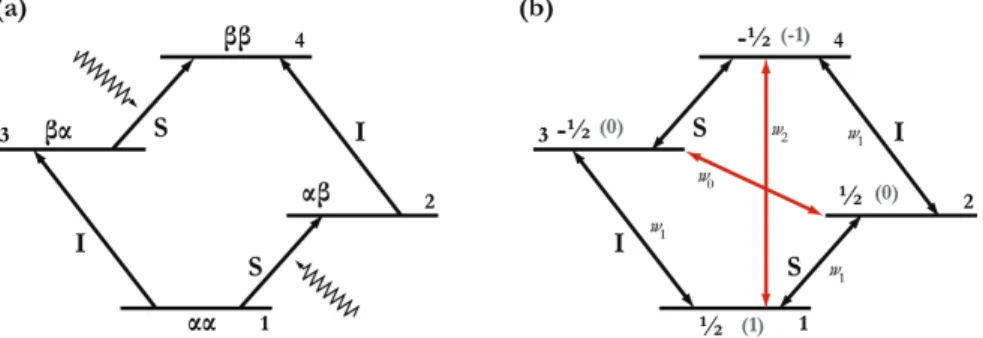
figure 1.11 - Energy levels and population of a two spin system. .. 28
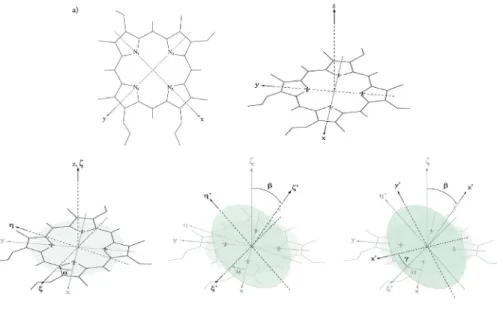
figure 1.12 - The molecular axis system.. ... 33
figure 2.1 - General scheme for two-dimensional NMR spec-troscopy. Experimental schemes for COSY, TOCSY and NOESY experiments. ... 43
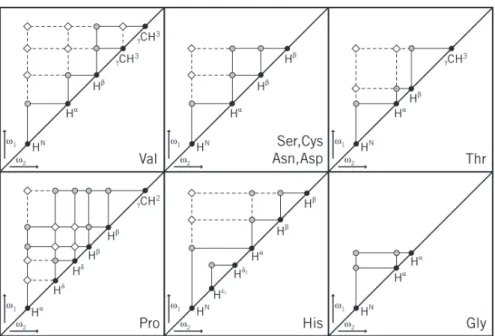
figure 2.2 - Connectivity diagrams for some spin-systems of common amino acid residues ... 46
figure 2.3 - Spin systems of neighbouring residues linked by the intervening Hα-HN or HN-HN sequential NOE connectivities. ... 47
figure 3.1 - Sequential NOE connectivities involving HN, Hα and Hβ. ... 69
figure 3.2 - Number of constraints per residue used for the
calculation of the reduced structure of Dd27c3 ... 71 figure 3.3 - Average backbone and heavy atom RMSD values
per residue with respect to the mean structure of the families of
Dd27c3 conformers for the reduced state. ... 72 figure 3.4 - Backbone and haems of the 20 lowest energy
NMR structures of Dd27c3. ... 73 figure 3.5 - Sequential NOE connectivities involving HN, Hα
and Hβ observed in the NOESY spectrum for the oxidised Dd27c
3... 74
figure 3.6 - Number of constraints per residue used for the
calculation of the oxidised structure of Dd27c3. ... 75 figure 3.7 - Average backbone and heavy atom RMSD values
per residue with respect to the mean structure of the families of
Dd27c3 conformers for the oxidised state. ... 78
figure 3.8 - Backbone and haems of the 20 lowest energy NMR structures of D. desulfuricans cytochrome c3 for the
oxi-dised state ... 80 figure 3.9 - a) Average calculated ring current shifts for the
20 best Dd27c3 NMR reduced structures versus observed ring
current shifts. b) Calculated dipolar shifts for the family of
oxi-dised structures against the observed. ... 81 figure 3.10 - Secondary structure elements of the reduced
and oxidised forms of Dd27c3. ... 82 figure 3.11 - Experimental chemical shift temperature depen-dence of oxidised Dd27c3. ... 83
figure 3.12 - Conformations of haem II propionate D and residues Glu61 and Lys75 in the overall best NMR structures of
reduced and oxidised cytochrome c3 from D. desulfuricans ... 83
figure 3.13 - Redox state dependent conformational changes in cytochrome c3 from D. desulfuricans ... 85
taBLes iNdex
taBLe 1.1 - Haem oxidation order in cytochromes c3. ... 8
taBLe 1.2 - Magnetic properties of selected particles... 14
taBLe 3.1 - Restraints used for calculation of reduced and
oxidised cytochrome c3 from D. desulfuricans ATCC 27774. ... 76
taBLe 3.2 - Summary of scaling factors, restraint violations and quality analysis for the final families of structures for
re-duced and oxidised cytochrome c3 from D. desulfuricans. ... 77
taBLe 3.3 - Properties of the magnetic susceptibility tensors
of the four haems in D. desulfuricans cytochrome c3. ... 79
taBLe 4.1 - Average iron-iron distances (Å) in the NMR (Sfc)
and X-ray (Soc) reduced structures ... 103 figure 4.1 - Sequential NOE connectivities involving HN, Hα
and Hβ observed in the NOESY spectrum for tetrahaem
cyto-chrome from S. frigidimarina ... 97 figure 4.2 - Number of constraints per residue used for the
calculation of the structure of Sfc. ... 99 figure 4.4 - Overlay of the 20 lowest energy NMR structures
of S. frigidimarina tetrahaem cytochrome at pH 6.1 ... 100 figure 4.5 - Comparison of the Sfc and Soc structures. . ... 101 figure 4.6 - Sequence alignment of tetrahaem cytochromes
from Sfc, Soc and Sffcc3 ... 102 figure 4.7 - Distance dependence of the pairwise interaction
energies between the iron centres ... 105 figure 4.8 - Relative position of haems III and IV and
resi-dues 55-56 for the Sfc (best NMR structure) and Soc (X-ray
structure ) ... 107 figure 4.9 - Relative position of haems II and III and the
conserved positively charged residue Lys72 for Sfc (best NMR
coNteNts
haeM PRoteiNs ... 2
c-type cytochromes ... 3
Tetrahaem cytochromes c3 ... 4
Physiological role and thermodynamic properties of Dc3 ... 6
Physiological role and thermodynamic properties of tetrahaem cytochrome from Shewanella spp. ... 9
NucLeaR MagNetic ResoNaNce ... 13
Space quantization ... 13
Nuclear magnetization ... 15
NMR spectroscopy ... 16
Population of energy levels ... 17
Magnetization ... 19
The chemical shift ... 21
Scalar and dipolar couplings ... 22
Relaxation ... 24
Nuclear Overhauser Effect (NOE) ... 27
Hyperfine shift ... 30
Determination of the magnetic susceptibility tensor ... 32
haeM PRoteiNs
Haem-containing proteins are one of the most functionally diverse groups of proteins that exist in nature, spreading from archaea to eu-karyotes, and from aerobes to anaerobes [1].
By using the simple arrangement of a haem prosthetic group linked to a polypeptide backbone, haem-proteins can perform a wide range of different functions such as: oxygen transport and storage (haemoglobin and myoglobin) [2], nitric oxide production [3] and transport (nitric oxide synthase and nitrophorin) [4], electron transport (c-type cyto-chromes) [5], and reduction of dioxygen to water by terminal oxidases (cytochrome c-oxidase) [6].
This diversity of functions is due to the versatility of the haem group and the variety of interactions with the polypeptide chain that generate different haem environments. The haem group is formed by a protopor-phyrin IX ring (Figure 1.1) that binds the iron equatorially via the four pyrrole nitrogens, in a nearly square planar geometry. Additionally, the iron is axially coordinated by one or two ligands. According to the na-ture of the protoporphyrin IX pyrrole rings substituents define the haem type groups.
FIGURE 1.1 - Structure of protoporphyrin IX of haem group c. A haem numbered according to IUPAC-IUB no-menclature for tetrapyrroles [7] is showed on the right.
c-type cytochromes
An extremely important family of haem proteins present in most living organisms are the c-type cytochromes. They are primarily involved in vital processes for life such as electron transport in both anaerobic and aerobic respiratory pathways [8] and cover a nearly 800 mV range of reduction potentials (from -400 to +400 mV) [9, 10].
All these cytochromes contain at least one c-type haem covalently linked to two cysteine residues in the protein backbone via thioether bonds in position 3 and 8 of the haem ring (IUPAC-IUB recommended no-menclature [7]). The typical haem binding amino acid sequence is the conserved motif -Cys-X-X-(X-X)-Cys-His-, where the X represents an arbitrary amino acid residue and the histidine residue is the fifth ligand (proximal). Recently an unprecedented CX15CH sequence involved in haem c binding was described for a multihaem cytochrome MccA from Wolinella succinogenes [11].
Both five- and six-coordinated haem-iron axial ligand sets have been observed for c-type cytochromes. The sixth ligand (distal) is usually a histidine [12-15] or a methionine [5, 8, 16] however other type of lig-ands, such as lysine [17] and asparagine [18] have been described. Six coordinated haems are usually diamagnetic in the reduced form and low spin paramagnetic in the oxidised form.
An important group of proteins that have gained relevance in the last two decades are the multihaem c-type cytochromes, not only because they participate in crucial bioenergetic processes in bacteria but also be-cause their function seems to go beyond that of a mere electron transfer protein [13, 19-22].
Multihaem c-type cytochromes ranging from two to twenty seven haems have already been identified, and methodologies to characterize them at the microscopic level both thermodynamically and structurally have been developed revealing the tremendous importance of these proteins [9, 12, 14-17, 23-35].
tetrahaem cytochromes c3
Tetrahaem cytochromes c3 were first isolated in 1954 from Desulfovibrio vulgaris [36, 37], the term was originally used to classify the third type of cytochromes discovered. Subsequently several tetrahaem cytochromes were isolated from the Desulfovibrionaceae family and in particular from the genus Desulfovibrio and Desulfomicrobium. To date, several of these proteins isolated mostly from Desulfovibrio genus (Dc3), but also from Desulfomicrobium, have been characterized in detail [19]. In the last dec-characterized in detail [19]. In the last dec-ade tetrahaem cytochromes isolated from the genus Shewanella were also identified [38, 39].
They are small (~15kDa), soluble and very stable globular proteins with polypeptide chains with 102-118 amino-acid residues and four non-planar haems with bis-histidinyl coordination.
The structures of several tetrahaem cytochromes have been determined both by X-ray and NMR and in spite of the low homology in terms of their amino-acid sequence; the haem core architecture is strictly con-served as well as the general folding of the proteins [14, 15, 30, 31, 34, 40-46].
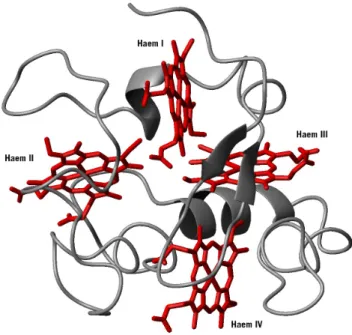
The conserved pattern of consecutive axial ligands for haem I (fifth lig-and) and haem II (sixth liglig-and) in the sequence is an important con-straint that is largely responsible for the haem core architecture adopted by these cytochromes. In a protein with an average of 30-40 amino-acid residues per haem [47] the fold is restrained by the need to bind the four haems in a compact assembly in which haems II and III are perpendicu-lar to each other and to haems I and IV which are approximately parallel (Figure 1.2).
The conserved four-haem structural motif is also observed in domains of eight-haem [48], nine-haem [33] and sixteen-haem cytochromes c3 [35]. In cytochrome c3 from D. desulfuricans, D. vulgaris and D. gigas there is a clear patch of positive charges provided mostly by lysine side
chains close to haem IV which has been proposed to be the docking site of the redox partners [49-54].
Cytochromes c3 belong to Class III according to the classification of Ambler [55]. An additional division into two types was proposed based on genetic, structural and functional features [56]. Differences between Type I and II cytochromes c3 (TpI-c3 and TpII-c3) relate mostly to their structure and surface charge distribution. TpII-c3 displays minor activity towards hydrogenases and does not show the characteristic lysine patch around haem IV which is considered to be the interaction site between TpI-c3 and hydrogenase [56]. All the haem binding sites in TpII-c3 are of the form C-X-X-C-H as opposed to TpI-c3, where they are of the type C-X-X-(X-X)-C-H.
FIGURE 1.2 - Ribbon diagram of cytochrome c3 oxidised structure by NMR from Desulfovibrio desulfuricans ATCC
27774 (Dd27c3) (Chapter 3). Haem architecture and the general fold of the protein are conserved among
Due to the small size of these cytochromes, the close proximity of the haems with Fe-Fe distances ranging from 1.1 to 1.8nm [19] causes the reduction potential of one particular haem to be affected by the reduc-tion of a neighboring one (redox interacreduc-tions); in addireduc-tion the haem re-duction potentials are pH dependent (redox-Bohr interactions) [57-59]. All in all this makes these proteins a model system well suited to study cooperative processes in biological systems [60, 61].
Physiological role and thermodynamic properties of Dc3
Tetrahaem cytochromes c3 from Desulfovibrio spp. (Dc3) are present in large quantities in the bacterial periplasm where they act as a coupling protein to hydrogenase [62]. Experimental data suggests that cyto-chromes c3 play fundamental roles in the metabolism of the host or-ganisms, by linking the electron and proton flow in the bioenergetic pathways [58].
In different metabolic models such as the hydrogen cycling mechanism [63], the CO cycling mechanism [64] or the more general unified model [65], it has been proposed that these cytochromes act as mediators between periplasmic hydroge-nases and transmembrane electron com-plexes (Figure 1.3).
It was proposed [20] that the character-istic thermodynamic properties of TpI-c3 allow it to act as an energy transduction device by accepting low energy protons
(high pKa) and high energy electrons (low redox potential) and convert-ing them into high energy protons that drive ATP synthase and lower energy electrons for sulphate reduction.
FIGURE 1.3 - Proposed physiological model for the metabolism of genus
Desulfovibrio according to the hydrogen cycling hypothesis [63]. ATPase,
ATP synthase; ETC, electron transfer complex; TpIc3, type I cytochrome
c3; E, enzymes involved in sulphate reduction; H2, molecular hydrogen; e-,
In multihaem proteins macroscopic analysis such as visible redox titra-tions and voltammetry is insufficient to discriminate the individual haem reduction potentials and the redox interactions between redox centres. However, by combining such analysis with NMR measurements it is possible to characterize these proteins at the microscopic level. Such characterizations have been obtained for multihaem cytochromes con-taining up to four low spin c-type haem groups [21, 28]. The methodol-ogy relies on three main steps: (i) the self-consistent assignment of the sets of haem signals in the reduced proteins [66-70]; (ii) identification of the haem oxidation patterns via 2D-NMR redox titrations and (iii) redox titrations followed by visible spectroscopy.
The self-consistent assignment of the haem signals in the fully reduced proteins is based on the methodology described for horse heart ferrocy-tochromes c by Keller and Wüthrich (1978) which relies on the identifi-cation of the NOE connectivities between the haem methyl groups and meso-proton resonances [71].
The 2D-NMR redox titration explores the paramagnetic shift origi-nated by the iron spin state change from S=0 to S=1/2 upon oxidation [61, 67]. Indeed, during the oxidation of a tetrahaem cytochrome, four consecutive reversible steps of one-electron transfer convert the fully reduced protein (stage 0) into fully oxidised (stage 4). Therefore, five oxidation stages can be defined each containing the microstates with the same number of oxidised haems [60, 61, 68]. The total number of microstates is 16 distributed according to the Pascal’s triangle rule for binomial coefficients as 1:4:6:4:1, respectively for oxidation stages 0-4 [72]. For each acid–base centre considered within the model the number of microstates is duplicated following the same rule.
On the NMR time scale, in conditions of fast intramolecular electron exchange (between the different microstates within the same oxidation stage) and slow intermolecular electron exchange (between different oxidation stages) the individual haem signals in the different oxidation
stages can be discriminated. Since the intrinsic paramagnetic shifts of the haem substituents are proportional to the oxidation fraction of that particular haem, they can be used to obtain the relative microscopic reduction potentials of the haems [61, 67]. Because NMR data only de-fines the relative haem reduction potentials and haem redox interactions it is necessary to calibrate these values with redox titrations monitored by visible spectroscopy [57].
The pH dependence of the haem substituent chemical shifts provides data to define the parameters of the thermodynamic model which for the simplest case of four haems and one acid-base centre are: four haem reduction potentials, the deprotonation energy of the acid-base centre, six redox-interactions and 4 redox-Bohr interactions. The thermody-namic properties of several Dc3 members have been determined [43, 57, 73-75].
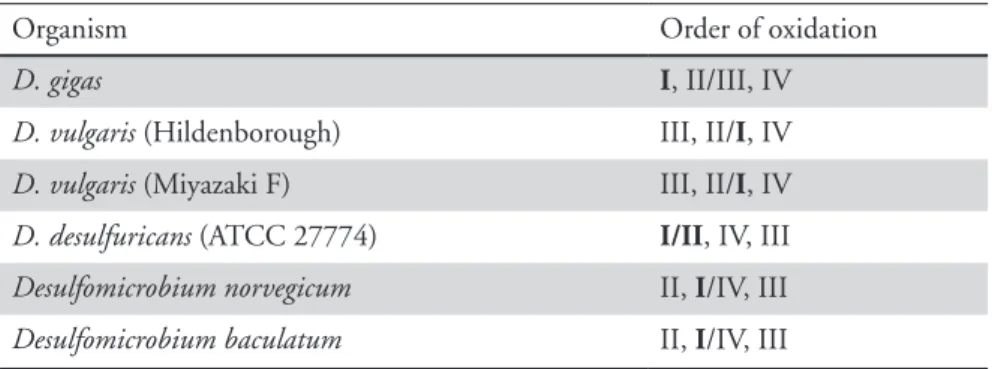
The relative reduction potentials of the haems for several Dc3 are indi-cated in Table 1.1 and are different among the Dc3 of different Desulfo-vibrio species.
TABLE 1.1 - Haem oxidation order in cytochromes c3. Boldface indicates the haem with the strongest
redox-Bohr effect. Adapted from [19].
Organism Order of oxidation
D. gigas i, II/III, IV
D. vulgaris (Hildenborough) III, II/i, IV
D. vulgaris (Miyazaki F) III, II/i, IV
D. desulfuricans (ATCC 27774) i/ii, IV, III
Desulfomicrobium norvegicum II, i/IV, III
Desulfomicrobium baculatum II, i/IV, III
A compilation of the thermodynamic data obtained from the different Dc3 is presented in the Appendix. Within the error of the measurements, all the haems show different and negative interaction energies with the protonatable centre(s) (heterotropic cooperativity). On the contrary, for
the haem-haem interactions (homotropic cooperativities), mostly posi-tive energies are observed. In both cases the sign of the energies is ex-pected in electrostatic terms. Nevertheless in the case of D. gigas and D. vulgaris Hildenborough some of the haems show large negative redox interaction energies. Such results can only be explained by the existence of redox related conformational changes [14, 15, 76].
Although several crystal structures have been reported for this class of proteins [30, 31, 34, 40, 44], solution structures were obtained in both oxidised and reduced states only for cytochromes c3 from D. vulgaris (Hildenborough -DvH) and D. gigas (Dg), allowing the description of the structural bases for homotropic cooperativity in solution [14, 15, 76].
Out of all the Dc3 studied, the tetrahaem cytochrome isolated from D. desulfuricans ATCC 27774 (Dd27c3) is unique in terms of its thermo- is unique in terms of its thermo-dynamic properties. Indeed, the model considering five centres (four haems and one redox-Bohr centre) was able to describe very well the experimental data for all Dc3 with the exception of Dd27c3 where a sec-ond acid-base centre had to be included in the model to explain the modulation of its redox proprieties [73, 77]. To understand the thermo-[73, 77]. To understand the thermo-To understand the thermo-dynamic and kinetic properties, which are essential to understand the electron-transfer properties of a protein it is essential to obtain structural information. The solution structure of the tetrahaem cytochrome c3 iso-lated from D. desulfuricans ATCC 27774 in both oxidised and reduced states will be addressed in Chapter 3 of the Thesis.
Physiological role and thermodynamic properties of tetra-haem cytochrome from shewanella spp
Shewanella spp. are Gram-negative bacteria belonging to the γ-Proteobacteria subgroup; they are motile facultative anaerobes and extremely versatile in terms of electron donors and acceptors including even insoluble metal oxides such as Fe(III) and Mn(IV)[78-84].
Terminal metal oxide electron acceptors are insoluble and therefore can-not diffuse inside the cells. As a consequence the transport of electrons outside the cell is required for the reduction of the terminal electron acceptor.
As described earlier, type I tetrahaem cytochromes from Desulfovibrio spp. (Dc3) are important to the hydrogenase activity and are proposed to function as mediators between periplasmic hydrogenases and trans-membrane electron transfer complexes.
On the other hand, tetrahaem cytochromes isolated from Shewanella spp. seem to have a completely different function. In fact, it was found that the growth rate of S. frigidimarina under anaerobiosis with Fe(III) as sole acceptor is severely reduced if the tetrahaem cytochrome (here after Sfc) is removed by gene disruption [38].
A proposed model for the electron trans-port pathway in Shewanella spp. for dis-similatory reduction of Fe(III) is given in Figure 1.4. In general terms the electrons are transferred from dehydrogenase to a quinone pool in the cytoplasmic mem-brane and from there to a cytoplasmic membrane bound tetrahaem cytochrome CymA [85-87] and then transferred to periplasmic c-type cytochromes and fi-nally to the periplasmic electron carriers [85, 88-90].
Two c-type cytochromes that may act as potential electron carriers necessary for Fe(III) reduction in Shewanella spp. have
been identified in the periplasm, Sfc and MtrA [91, 92].
The tetrahaem cytochrome Sfc is a small periplasmic c-type tetrahaem
FIGURE 1.4 - Physiological model of the biochemistry suggested to be in-volved in electron transfer to extracellular insoluble Fe(III) oxides in
Sh-ewanella spp. CymA, cytoplasmic membrane-bound c-type tetrahaem
cy-tochrome; Sfc periplasmic cytochrome c; e-, electrons; MtrA, periplasmic
decahaem c-type cytochrome; OmcB, outer membrane-bound cytochrome; MQ, menaquinone; CM, cytoplasmic membrane; OM, outer membrane. Adapted from [93].
cytochrome [38, 94] that is thought to have a central role in bridg-a central role in bridg-ing the electron transfer between the cytoplasm and the outside of cell where reduction of extracellular iron takes place [39].
This cytochrome has 86 residues (11.8 kDa) and four low-spin haems with bis-histidinyl ligation. For the thermodynamic properties of Sfc, it was shown that the haem redox potentials are modulated by redox interactions between the four haems and also by redox-Bohr interac-tions between the haems and an ionisable centre proposed to be close to haem III [95]. However in this case and again in contrast to the Dc3, haem III is now the most affected by the protonation state of the protein and by the oxidation of the other haems. Moreover all the interactions between the five centres are clearly dominated by electrostatic effects (Appendix).
When the primary sequence of this cytochrome is compared with type I cytochromes c3 from Desulfovibrio spp. remarkable differences emerge (Figure 1.5), particularly, in Sfc the haem binding motif of all the haems
FIGURE 1.5 - Comparison between the relative positions of the haem binding motifs and haem axial ligands in both the tetrahaem (Sfc) and the N-terminal cytochrome domain of flavocytochrome c3 (Sffcc3) isolated from S. frigidimarina
and the Desulfovibrio spp. cytochromes c3.
A- Sequence alignment for Sfc and Sffcc3. The grey shadowed
letters indicate the conserved residues in both proteins. B- Sequence alignment for two cytochromes c3 isolated from
Desulfovibrio species: DvHc3 (Desulfovibrio vulgaris
Hilden-borough, NCIB 8303), Dd27c3 (Desulfovibrio desulfuricans
ATCC 27774). The grey shadowed letters indicate the resi-dues conserved in all Dc3s. The bold roman numbers in (A)
and (B) indicate the haem binding motifs (CXX(XX)CH) and the sixth axial ligand of each haem.
is CXXCH in contrast with all the Dc3 where at least one of the haems shows the CXXXXCH motif [15, 96-102]. Additionally the conserved pattern of two consecutive haem axial ligands observed in all Dc3 is not found in Sfc.
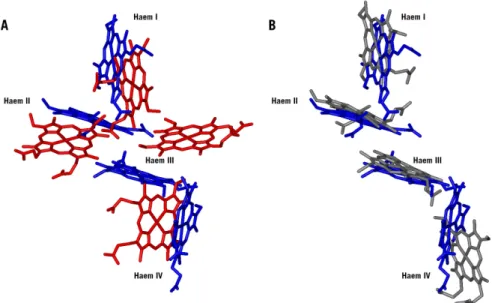
Simply based upon sequence alignment it was suggested that the haem core of both proteins was distinct. Indeed, the preliminary model for the Sfc haem core [12] showed that the haems had a nearly linear arrange-ment as opposed to those found in Dc3 (Figure 1.6). A similar but not identical architecture was found for the haem core in the N-terminal domain of the fumarate reductase flavocytochrome c3 isolated from S. frigidimarina and S. oneidensis [13, 22] (Figure 1.6).
The preliminary model of the haem core model from Pessanha et al. [12], anticipated a different structural motif from those reported for Dc3. The solution structure determination of Sfc is one of the aims of this Thesis and will be described in Chapter 4, where the structural
fea-FIGURE 1.6 - Haem core comparisons between tetrahaem cytochrome c from S. fridigimarina (Sfc), cytochrome c3
from D. desulfuricans (Dd27c3) and the N-terminal domain of the fumarate reductase flavocytochrome c3 isolated
from S. frigidimarina (Sffcc3). A - Sfc haem core showed in blue and Dd27c3 in red. B - Sfc haem core showed in
tures of Sfc are compared with those of Dc3 and used to interpret the thermodynamic properties of this cytochrome.
NucLeaR MagNetic ResoNaNce
space quantization
Let us consider a system with conserved angular momentum, like an isolated atom in vacuum. Such a system could in principle (as the Earth spinning on its axis) be spinning around any desired direction. For a giv-en spin, each particular direction of the angular momgiv-entum axis would correspond to a different state with each of the states possessing the same energy.
So, in the classical theory, for a given angular momentum there is an infinite number of possible states, all with the same energy.
However in quantum mechanics, several important differences happen: • The number of observable states such a system can have is now
lim-ited.
• A state cannot be described by knowing the direction of its angular
momentum. Only by giving the component of the angular momentum along some direction – z axis direction for example.
In classical mechanics, an object with angular momentum I, could have for its z-component of angular momentum any value from I to –I. In quantum mechanics, the measured z-component of angular momentum can only have certain discrete values.
Any nucleus, has a characteristic number I – called the spin quantum number, or just spin – so that the observable z-component of the angu-lar momentum is given by the set of values:
{1.1}
in which m= (-I, ... , I).
The fact that the z direction was chosen is totally arbitrary. For a given system with spin I, the component of angular momentum along any axis can only be observed to have one of the values stated above. The charac-teristic spin I of a nucleus can have one of the following values:
spin values for common nuclei are shown in Table 1.2. Protons, neutrons and electrons all have I = ½ and are called ‘spin-½’ particles. For any given I there are 2I+1 different states all with the same energy.
The magnitude of the angular momentum is also a quantized value that depends on I:
{1.2}
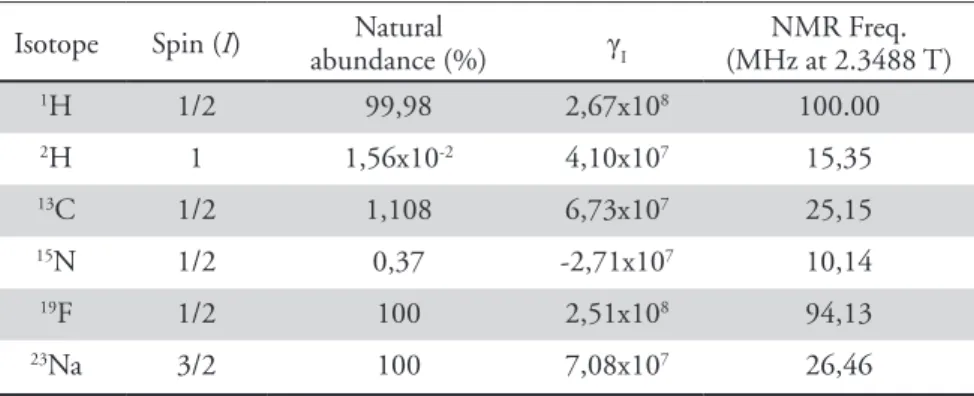
TABLE 1.2 - Magnetic properties of selected particles. γI is the gyromagnetic ratio in units of rad T-1s-1. Adapted
from [103].
Isotope Spin (I) abundance (%)Natural γI (MHz at 2.3488 T)NMR Freq.
1H 1/2 99,98 2,67x10⁸ 100.00 2H 1 1,56x10⁻² 4,10x10⁷ 15,35 13C 1/2 1,108 6,73x10⁷ 25,15 15N 1/2 0,37 -2,71x10⁷ 10,14 19F 1/2 100 2,51x10⁸ 94,13 23Na 3/2 100 7,08x10⁷ 26,46
It’s worth noting that two very common nuclei; 12C and 16O, have zero spin
num-ber, and therefore zero magnetic moment, and so are invisible in magnetic resonance.
1 3 0, ,1, ,2,... 2 2 I = ,( 1) ,..., ( 1) , m I I− − −I −I= ( 1) I I = + I
Nuclear magnetization
Nuclei with non zero spin angular momentum also possess a magnetic moment. The magnetic moment μ is collinear and directly proportional to I with a proportionality constant γ, known as the gyromagnetic ra-tio:
{1.3} {1.4}
As we can see the nuclear magnetic moment, like the angular momen-tum, has both magnitude and orientation quantized.
In the presence of an external magnetic field B the energy of the system can be written as:
{1.5}
and the minimum energy corresponds to the maximum projection of μ onto B.
For an external field oriented along the z axis, equation {1.5} reduces to: {1.6} I µ = γ z Iz m µ = γ = γ E = −µ • B 0 0 Em = −γI Bz = − γm B
FIGURE 1.7 - Nuclear spin energy levels of spin-1/2, spin 1 and spin 3/2 nucleus respectively. In the ab-sence and when an external mag-netic field is turned on.
Consider a system with spin I=3/2. In the absence of an external mag-netic field, the system has four different (Figure 1.7) possible states cor-responding to the values of Iz, all of them with the exact same energy (said to be degenerate). When the magnetic field is turned on, there is an additional energy of interaction that separates these states into four different levels. The energies of these levels are proportional to B multi-plied by ħ times 3/2, 1/2, -1/2 and –3/2 as given by equation {1.6}. The splitting of energies for systems with spins 1/2, 1 and 3/2 are shown in Figure 1.7. The 2I+1 states (called Zeeman levels) for a spin 1/2 nucleus are equally spaced with energy gap of γħB.
The allowed transitions between adjacent energy levels have the energy:
or using E=hν:
{1.7}
where ν is the frequency of electromagnetic radiation.
That is, when we apply an external magnetic field to a nucleus of non-zero spin, its energy splits into a number of different levels. Furthermore the phase of the wavefunction varies in a manner analogous to the classi-cal precession of the nucleus about the direction of the field. This effect is caused by the interaction of the nuclear angular momentum vector with the applied magnetic field.
The precessional motion (called Larmor frequency) depends on the type of nucleus (its value of γ) and it is proportional to the applied field:
{1.8}
NMR spectroscopy
In a very basic form, nuclear magnetic resonance (NMR) is the study of the properties of molecules that have magnetic nuclei, by the
appli-1 1 E E E ( ) 2 B 2 B B β α ∆ = − = γ − − γ = γ 2 B γ ν = π = 2 L B γ ν π
cation of a magnetic field and observing the frequency at which they come into resonance with an oscillating electro-magnetic field.
With the magnetic field strengths normally employed in magnetic resonance experiments, the Larmor frequencies of equation {1.8}(for 1H nuclei) lie in the radiofrequency region of the electromagnetic spectrum.
Population of energy levels
Molecular and atomic systems possess energy in a variety of different forms. It can be associated with the vibrational, rotational or transla-tional motions of the molecules, or with the interactions between elec-trons and nuclei.
One common characteristic shared by all these forms of energy is that each one of them separately is restricted only to certain quantized values (energy levels). And for each particular type of energy, the gaps between allowed (existing) levels are characteristic of the system. Therefore the measure of energy gaps in atoms or molecules is one of the most impor-tant ways of testing models of their internal structure.
In a general spectroscopy experiment, the system is irradiated with a range of frequencies of electromagnetic radiation, the interactions be-tween the sample and the radiation will result in the promotion of some atoms or molecules to higher energy levels, with absorption of energy at the corresponding frequency of radiation. The analysis of the emerging radiation from the sample will reveal the missing frequencies and there-fore the energy gaps present in the sample.
The occupancy of the energy levels at equilibrium (the way the sample molecules are distributed among the available energy states) is given by the Boltzmann relation: If we consider two states, s1 and s2 with popula-tions η1 and η 2 respectively, separated by an energy gap ΔE, the ratio of
A typical magnetic field strength used in NMR would be 18.8 T. From equation {1.8} and for the proton we get a frequency of 8x10⁸ Hz, or 800 MHz.
Because proton is by far the most popular NMR nucleus, NMR spectrometers are usually classified by their proton frequen-cies rather than the strengths of their magnetic fields.
their populations is given by:
{1.9}
where k is the Boltzmann constant and T the absolute temperature. When ΔE is large in relation to kT the population of the
upper energy state may be assumed to be negligible. On the contrary, when ΔE is small compared to kT, (as in the case of NMR) the population ratio is close to unity, which means that upper and lower states are almost, although not quite, equally populated.
In NMR spectroscopy it is as if we can only detect one nucleus in every 104 (or even 105 depending on the magnetic field strength). If we add to this the fact that higher frequency spectroscopy is more sensitive (be-cause it is easier to detect higher energy particles) it is easy to see why the NMR signals are intrinsically weak.
This is the reason why the optimisation of signal strength is so impor-tant, by using the strongest magnetic fields possible, strong gyromag-netic ratio nuclei and high natural abundance.
Various methods are used to improve the comparative sizes of NMR signal and noise – the signal to noise ratio. Signal averaging is one way of improving this. Because NMR signals occur in the same place every time, while noise is random, the spectrum is recorded more than once and the results are added, so the signal builds up. In n repetitions the signal-to-noise ratio improves by a factor of n.
There is the possibility to extract a complete frequency response in one go, by using a short intense burst of radiofrequency radiation, instead (as in the early years of NMR spectroscopy) of using a weak fixed ampli-tude radiofrequency while slowly sweeping the magnetic field strength in order to bring spins with different chemical shifts into resonance.
For protons in a 18.8T field at 300K tem-perature the ratio of populations given by equation {1.9}, and using ΔE=γħB, gives ΔE=5.3x10⁻²⁵J (kT=4.14x10⁻²¹ J).
Therefore we have a population ratio of about η2=0.9998η1, or 1 part in 10,000 for
the population differences.
( / ) 2 1 E kT e− ∆ η = η
Following the pulse, the NMR response, referred to as free induction decay (FID) fades over a period of time (in an analogous manner to any damped vibration). After sufficient repetitions have been made, all data contains information about all the frequencies in the NMR spectrum. To obtain a spectrum of amplitude as function of frequency we need to use a Fourier transform to interconvert between time and frequency data.
Magnetization
In a large equilibrium population of identical nuclei at equilibrium, the z-components of each individual magnetic moment almost cancel out. However the alignment along B0 of the small excess of spins in the lower energy level, means that a net magnetization exists in this direction, called Mz(Figure 1.8).
The magnetic moment component along the x and y axis (Figure 1.8) averages out since it is randomly distributed. It is the total magnetiza-tion Mz and not the magnetic moment of each spin that determines the NMR signal.
FIGURE 1.8 - Spin populations, a) disordered in the absence of an ex-ternal magnetic field; b) in the pres-ence of the magnetic field there is a net magnetization along the z axis. Although the magnetization is sta-tionary along the z axis (the mag-netic field direction), the individual spin moments rotate about the axis.
For our NMR experiment we will apply a short radiofrequency (RF) pulse at the Larmor frequency to induce transitions between the allowed energy states. Although the probability is the same for either direction, more transitions exist from the lower to the higher energy level, which will reduce the population difference between the states and conse-quently reducing Mz.
Depending on how long the RF pulse is applied the population dif-ference and therefore Mz could even be inverted (Figure 1.9-c). These transitions caused by the applied pulse (also called the B1 field) bring the spins into phase with B1, so they precess together with phase coherence. So the resultant magnetization Mxy in the x-y plane is no longer zero.
The detection of this rotating magnetization is the purpose of an NMR spectrometer. Its creation, decay and exchange will provide us with the molecular information that we seek.
Thus, as we have seen the RF pulse reduces or inverts Mz and introduces Mxy. The resultant of these two magnetizations is called M. We can think of M as the result of tilting Mz away from the z-axis. (Figure 1.9) By controlling the strength and the duration of the pulse it is possible to control the magnitude of the tilt angle, and we can speak of a 30º or 60º pulse for example. A 90º pulse is associated with a zero Mz and non-zero
FIGURE 1.9 - a) Resultant magnetization M of Mz and Mxy in a frame of reference rotating at the Larmor frequency;
Mxy; a 180º pulse inverts Mz from its original direction and has zero Mxy (Figure 1.9).
When the RF pulse B1 ends, the spin system returns over a period of time to its original state; this is called relaxation.
the chemical shift
One of the main characteristics of NMR spectroscopy is that the ob-served nuclear resonance frequencies depend on the position of the nucleus in the molecule, or to be more precise, on the local electron distribution and therefore differ slightly from the frequencies predicted by equation {1.7}:
{1.10}
The effect of chemical shift arises because the external field B0 induces electron motions that generate secondary magnetic fields. The net mag-netic field at the nucleus in an atom or molecule depends on the static magnetic and secondary magnetic fields. The effect of these secondary fields, also called nuclear shielding, can enhance or oppose the main field.
In isotropic liquid solution, the shielding effects on a particular nucleus can be considered, rearranging {1.10} as:
{1.11}
where σ is the average, isotropic shielding constant of the nucleus. Resonance frequencies of the nuclei will reflect variations in σ due to different electronic environments. It is common practice to measure chemical shifts in parts per million (p.p.m. or δ) relative to a reference resonance signal from a standard molecule:
{1.12} 0 0 2 B B γ ν = ω = γ π or 0 (1 )B ω = γ − σ 6 10 ( ref) ref ν − ν δ = ν
in which ν is the nucleus of interest resonance and νref the reference resonance. The frequency difference ν-νref is divided by νref so that δ is a molecular property independent of the magnetic field used in the measurement.
The reference signal is usually obtained by adding a small amount of a suitable compound to the NMR sample. For the 1H and 13C spectra this is usually tetramethylsilane (CH3)4Si or TMS, which is soluble in most organic compounds, inert and gives a single strong resonance sig-nal from its 12 identical protons. A secondary reference compound that has a known chemical shift with respect to TMS may be used. Water is a convenient secondary reference for biological samples but it is necessary to take account of the temperature dependence of its shift with respect to TMS.
scalar and dipolar couplings
The appearance of high resolution NMR spectra is not solely due to the chemical shift. The magnetic interactions between nuclei, also known as couplings, cause splitting of the lines.
Ramsey and Purcell [104] suggested that the multiplicity of NMR resonances (multiplets) was due to the indirect in-teractions mediated by the electrons forming the chemical bonds between nuclei.
This interaction, known as spin-spin coupling or scalar cou-pling, is measured by the scalar coupling constant nJ
ab (Hz), where n stands for the number of covalent bonds separating the two nuclei a and b.
If we consider two spin ½ nuclei (e.g. two 1H spins) designated I and S with resonance frequencies ωI and ωS respectively:
{1.13}
Scalar coupling is the effect caused on a nuclear spin I by the local magnetic field of a neighbour nuclear spin S.
The orientation of spin S in the magnetic field induces a small polarization mostly on the s orbitals around spin S. The electron density distribution of spin I, bonded to spin S will be affected by this polarization. Since this interaction depends on the electron density of the s orbitals surround-ing both nuclei, the electron density must be related, therefore in Fermi contact. As a consequence, scalar spin-spin coupling propagates only along chemical bonds.
I I(1 I) 0 S S(1 S) 0
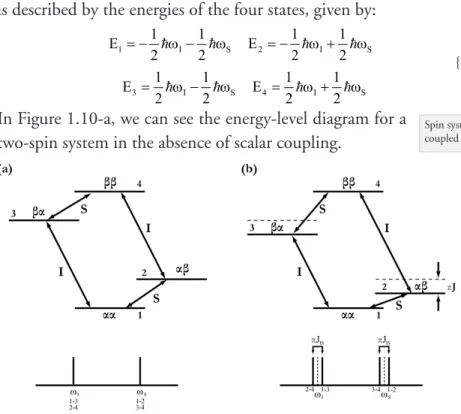
In the absence of scalar coupling between the spins, the two spin system is described by the energies of the four states, given by:
{1.14}
In Figure 1.10-a, we can see the energy-level diagram for a two-spin system in the absence of scalar coupling.
The allowed transitions occur between levels 1 and 2, 3 and 4 (corre-sponding to a change in the spin state of S), and between levels 2 and 4, and 1 and 3 (corresponding to a change in the spin state of I). Therefore the NMR spectra consists of one resonance line at ωI (due to transitions 1-3, and 2-4) and one resonance line at ωS (corresponding to transitions 1-2, and 3-4).
If we now introduce the scalar coupling JIS (which can be positive or negative) between I and S, the energy levels are given by:
{1.15}
Spin system refers to a group of nuclei coupled through spin-spin coupling.
1 1 I 1 S 2 1 I 1 S E E 2 2 2 2 = − ω − ω = − ω + ω 3 1 I 1 S 4 1 I 1 S E E 2 2 2 2 = ω − ω = ω + ω 1 1 I 1 S 1 IS 2 1 I 1 S 1 IS E J E J 2 2 2 2 2 2 = − ω − ω + π = − ω + ω − π 3 1 I 1 S 1 IS 4 1 I 1 S 1 IS E J E J 2 2 2 2 2 2 = ω − ω − π = ω + ω + π
FIGURE 1.10 - Energy levels and spectrum of a two spin system (a) with no spin coupling and (b) with J coupling. The allowed transitions are indicated between arrows. The dashed lines in (b) represent the energy levels or fre-quency positions without J couplings. Adapted from [105]
The energy level diagram for the spin-spin coupled system now shows four lines corresponding to the new transition frequencies (Figure 1.10-b):
{1.16}
The dipolar coupling is a dipole-dipole interaction between spatially near nuclei. This coupling is a direct through space rather than through a molecular bond as in J coupling. In solution, dipolar line splitting is not observable because the orientational term of the dipolar interaction with respect to the magnetic field direction is averaged to zero by rapid molecular tumbling.
The effect of dipolar interaction on molecular relaxation however is still present, which is the origin of the NOE (see below).
Relaxation
A perturbed spin system relaxes over a period of time to its equilibrium state.
• The relaxation of Mz occurs along the direction of the applied field
B0: It is called longitudinal relaxation and the characteristic relaxation time is denoted T1.
• The M
xy decays exponentially to zero. This is called transverse relaxa-tion and has a characteristic time T2.
Relaxation is caused by state transitions of many individual nuclei, which restore the original Boltzmann populations (thus Mz returning to its equilibrium value) in the case of longitudinal relaxation and dis-rupts the precession phase coherence of the nuclear spins, reducing Mxy to zero in transverse relaxation. During T1 relaxation the nuclear spins exchange energy with the fluctuating magnetic or electric fields in the environment (“lattice”). T2 relaxation can occur due to mutual energy exchange between two nuclei or by inhomogeneities in the local
mag-12 S J IS 34 S JIS
ω = ω − π ω = ω + π
13 I J IS 24 I JIS
netic fields, and contrary to T1 relaxation does not involve net changes in the energy of the system.
Both forms of relaxation depend on oscillat-ing magnetic fields that arise from sources including nuclear dipole-dipole interac-tions, chemical shift anisotropy, and inter-action with unpaired electrons in the case of paramagnetic samples, which are modulated by molecular motions in liquid samples. T1 interaction arises from the fact that each nucleus is surrounded by other magnetic nuclei in the same or neighbouring mol-ecules. The energy exchange is caused by the time dependent fluctuation of magnetic field produced by vibrational, rotational and translational motions of surrounding nuclei, changes in chemical shielding or unpaired electrons.
The dominant mechanism for spin-lattice relaxation for protons is di-pole-dipole interaction, which although averaged to zero in solution, its field at any given instant is not. It is dependent on the inverse cube of the distance between the two nuclei and the direction of the vector join-ing them. For an aqueous solution of normal viscosity, as the molecules tumble, the direction of this vector changes and so does the dipole-dipole interaction. Spin-lattice relaxation is proportional to the square of the coupling and it is given by [106] in the case of isotropic motion:
{1.17}
where r is the distance between the nuclei (with like-spins), τc is the
cor-The time average of the correlation between the fluctuating mag-netic field measured at time t and the same field at time (t+τ) is the autocorrelation function G(τ), which essentially characterizes the memory that the system has of a particular arrangement of spins in the sample.
For times τ much shorter than the time it takes the system to rearrange itself G(τ) will be close to its maximum. For longer times when the initial arrangement gets more disturbed G(τ) value falls. For sufficiently long times, G(τ) tends to zero.
The simplest form for G(τ) is:
where τc is the correlation time, the decay time constant of the
autocorrelation time function.
For times much less than τc the spins have not moved much and
the correlation function is close to its initial value; for times of the order of τc spins have gone through significant rearrangements and
the correlation function falls to about half its original value. For times much longer than τc spins have moved to completely new
positions and the correlation function has fallen close to zero. As the correlation function is a function of time its Fourier transform will give a function of frequency which is called the spectral density J(ω). This function gives a measure of the amount of motion present at different frequencies. For a simple exponential correlation function the spectral density is of the form:
We can think of correlation time τc as the mean time between
reorientation of a molecule or the rate of its random motions. Because random motions of molecules are dependent on molecular size, the magnitude of correlation time τc is substantially dependent
on molecular weight. ( / ) 2 2 2 1 Fourier Transform c c c e−τ τ → τ + ω τ ( / ) ( ) (0) c Gτ =G e−τ τ 2 4 2 0 1 6 2 2 2 2 1 4 1 3 10 4 1 c c 1 4 c c R T r µ γ τ τ = = π + ω τ + + ω τ
relation time, ω is the Larmor frequency and γ the gyromagnetic ratio. In paramagnetic systems the presence of unpaired electrons will add new efficient relaxation pathways dominated by the coupling of the magnetic dipole of the target nucleus and the fluctuating magnetic fields of un-paired electrons. The fluctuation in low spin iron is usually dominated by the rate of electron spin relaxation. Nuclear spin relaxations occur now not only at the nuclear Larmor frequency ωI, but also at the fre-quencies of the transitions involving both nuclear and electronic spin levels; ωI + ωS and ωI – ωS. Therefore the expression for the overall nu-clear spin-lattice relaxation rate has the form [107]:
{1.18}
Here, τS is the correlation time for electron spin relaxation and γI, γS, ωI and ωS are the gyromagnetic ratio and the Larmor frequencies for the nuclei and the unpaired electron respectively.
In T2 or spin-spin relaxation the energy of the system is not altered because this relaxation does not cause population changes, the energy is exchanged between nuclei. Due to the intrinsic inhomogeneity of the applied magnetic field each nucleus of the sample will experience a slightly different B0 field. As a consequence some of the nuclei will precess faster and some slower, which will lead to a fanning out of indi-vidual magnetization and the result is a loss of phase coherence. Thus the spin-spin relaxation has an additional component that depends on frequencies close to zero.
Spin-spin relaxation is given by [106]:
{1.19} ( ) ( ) 2 2 2 2 0 1 6 2 2 1 2 2 2 2 3 1 1 10 4 1 6 1 1 I S S I S S S I S S I S S R T r µ γ γ τ = = π + ω τ + τ τ + + + ω − ω τ + ω + ω τ 2 4 2 0 2 6 2 2 2 2 2 5 2 1 3 3 20 4 c 1 c 1 4 c c c R T r µ γ τ τ = = τ + + π + ω τ + ω τ
![FIGURE 1.1 - Structure of protoporphyrin IX of haem group c. A haem numbered according to IUPAC-IUB no- no-menclature for tetrapyrroles [7] is showed on the right.](https://thumb-eu.123doks.com/thumbv2/123dok_br/15469885.1033883/20.748.66.468.529.763/figure-structure-protoporphyrin-numbered-according-iupac-menclature-tetrapyrroles.webp)