Francisca Maria de Andrade Terras Arez
Degree in Biochemistry
Novel
in vitro
human 3D neural model derived from
induced pluripotent stem cells
Dissertation to obtain master degree in Biochemistry for Health
Supervisor: Catarina Brito, Investigador auxiliar, IBET, ITQB-UNL
Francisca Maria de Andrade Terras Arez
Degree in Biochemistry
Novel
in vitro
human 3D neural model derived from
induced pluripotent stem cells
Dissertation to obtain master degree in Biochemistry for Health
Supervisor: Catarina Brito, Investigador auxiliar, IBET, ITQB-UNL
Juri:
President: Dr Pedro Manuel Henriques Marques Matias Arguer: Dr Cláudia Guimas de Almeida Gomes
Vogal: Dr Margarida Archer Baltazar Pereira da Silva Franco Frazão
Instituto de Tecnologia Química e Biológica António Xavier, Universidade Nova de Lisboa
I
Copyright em nome de Francisca Maria de Andrade Terras Arez, ITQB e UNL.
O Instituto de Tecnologia Química e Biológica António Xavier e a Universidade Nova de
Lisboa têm o direito, perpétuo e sem limites geográficos, de arquivar e publicar esta dissertação
através de exemplares impressos reproduzidos em papel ou de forma digital, ou por qualquer
outro meio conhecido ou que venha a ser inventado, e de a divulgar através de repositórios
científicos e de admitir a sua cópia e distribuição com objetivos educacionais ou de
III
Acknowledgements
I would like to acknowledge all the people directly or indirectly involved in this thesis.
To Dr. Catarina Brito, for her guidance, helpful discussions and critical suggestions during
this thesis. For being an example and for helping me to grow as a scientist.
To Dr. Paula Alves, for giving me the opportunity to do my master thesis at Animal Cell
Technology Unit at ITQB/IBET, for the optimal working conditions offered and for being a
follower example of leadership.
To Marcos Sousa for expertise and fruitful advices in bioprocesses field and for the constant
availability and help during the bioreactor cultures.
A special acknowledgement to Daniel Simão, to whom I owe most of the skills and
knowledge acquired during my master thesis work. Thank you for having the patience to teach
me every technique applied in this work, for the encouragement, and guidance, for being there
for me during all time, making me see my results always in an optimist perspective and for all
the continuous preseversence in me.
A special thanks to Ana Paula and Marta Silva for the long standing hours of scientific
discussion, for their guidance, for the excitement in the advances shared during my master
thesis and for being there for me during all the way.
To all Animal Cell Technology Unit members for the good working environment and group
support during this year, specially to Daniel Simão, Marta Silva, João Vidigal, Ana Paula, Rita,
Sofia Rebelo, Mafalda Dias, João Sá, Marta Estrada and Catarina Pinto for providing me the
most enjoyable journey, for all the good moments and laughs shared and for the friendly help
and support in all circumstances.
To my family, especially my parents and sister for all the unconditional love and support at
all times and circumstances.
To Luis for being always there for me and for the patience and support along this special
V
Abstract
The limited access to human neurons has hindered the development of accurate models to
mimic human central nervous system (CNS) disease, and consequently the development of
efficient therapies for neuropathologies. The current models rely on animal models or on
two-dimensional in vitro models that often fail in mimicking human in vivo phenotype. The
emergence of human induced pluripotent cells (hiPSC) technology provided an unlimited source
of neural precursor cells (NPC) with the ability to differentiate into the neural lineage, including
neurons and glia. The possibility to develop in vitro three-dimensional (3D) models that include complexity of microenvironment conditions and interactions, such as cell and
cell-extracellular matrix (ECM) interactions, make CNS modeling closer to the in vivo
microenvironment.
The aim of this work was the development of a novel 3D human CNS model using NPC
derived from hiPSC (hiPSC-NPC) as a cell source to obtain differentiated neural cells.
Firstly, the characterization of hiPSC-NPC line used in this work was performed in 2D
adherent culture, namely phenotype and monotypic differentiation into neurons and astrocytes.
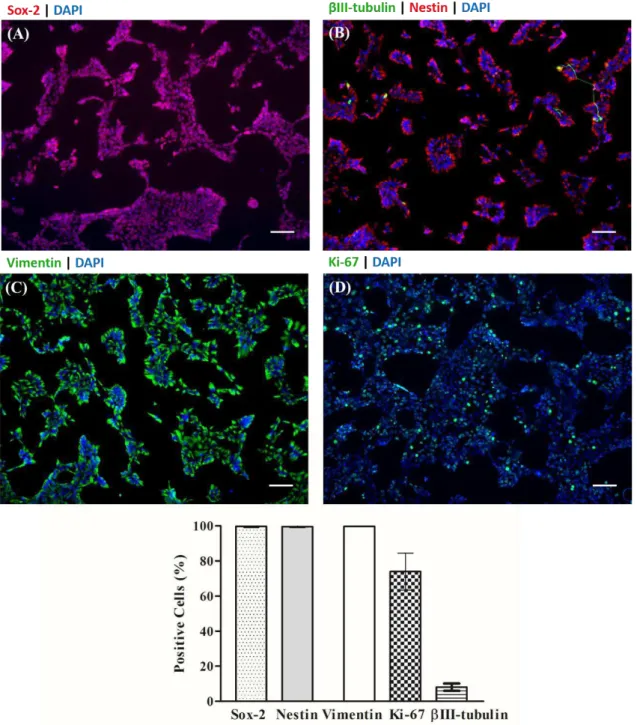
The cell line presented an NPC phenotype expressing nestin, sox-2, and vimentin markers, and
the expected multipotent differentiation potential, generating mature astrocytes and neurons.
A 3D approach using computer-controlled stirred-tank bioreactor system was developed to
generate size-homogeneous neurospheres, which were efficiently differentiated into the neural
lineages. Differentiated neurospheres were enriched in mature and functional neurons, including
glutamatergic, GABAergic, and dopaminergic neurons identified by vGlut1, GAD 65&67 and
TH markers, respectively. Moreover, neurospheres presented astrocytic cells expressing GFAP,
GLT-1 GLAST and S100β.
The developed culture strategy results in a robust differentiation process that can be applied
to patient-derived cell lines, being a powerful tool for disease modeling.
Keywords: hiPSC, human neural stem cells, neural differentiation, stirred-tank bioreactors,
VII
Resumo
O acesso limitado a neurónios humanos tem dificultado o desenvolvimento de modelos que
mimetizem com rigor doenças relacionadas com o sistema nervoso central (SNC), bem como o
desenvolvimento de terapias eficientes para neuropatologias. Actualmente, os modelos de SNC
incluem modelos animais ou modelos de cultura bi-dimensionais (2D), que dificilmente
mimetizam o fenótipo humano in vivo. O aparecimento da tecnologia de células estaminais pluripotentes induzidas humanas (hiPSC) proporcionou uma fonte ilimitada de células
progenitoras neurais (NPC) com capacidade para diferenciação em neurónios e glia. O
desenvolvimento de modelos in vitro em sistemas de cultura tri-dimensionais (3D) permite
mimetizar a complexidade do SNC através de interacções célula-célula e célula-matriz
extracelular, o que os torna mais semelhantes ao in vivo.
O objectivo principal deste trabalho foi o desenvolvimento de um modelo 3D de SNC
usando NPC derivadas de hiPSC para obtenção de células neurais.
Com este objectivo, primeiramente a caracterização da linha celular hiPSC-NPC utilizada
neste trabalho foi efectuada num sistema de cultura aderente em 2D. A linha celular apresentou
um fenótipo de precursores neurais, caracterizado pela expressão de marcadores como nestina,
sox-2 e vimentina, e multipotente capacidade de diferenciar em neurónios e astrócitos.
Posteriormente, o desenvolvimento de um sistema de cultura 3D usando bioreactores de
tanque agitado em condições de cultura controladas, permitiu a obtenção de neurosferas de
tamanho homogéneo que diferenciaram eficientemente nas duas maiores populações do SNC,
astrócitos e neurónios. Nas neurosferas diferenciadas, neurónios maturos e funcionais de
diversos tipos, foram identificados como glutamatérgicos, GABAérgicos e dopaminérgicos pela
detecção de vGlut1, GAD 65&67 e TH, respectivamente; e a presença de população astrocítica
foi identificada pela detecção de GFAP, GLT-1, GAST e S100β.
A estratégia de cultura desenvolvida neste trabalho deu origem a um processo de
diferenciação robusto e reprodutível que poderá ser aplicado a hiPSC derivadas de pacientes,
sendo uma estratégia promissora para desenvolver modelos de doença.
Palavras-chave: hiPSC, células neurais humanas, differenciação neural, bioreactores de
IX
Contents
1. Introduction ... 1
1.1. The Central nervous system cellular components ... 1
1.2. Available models of CNS ... 4
1.2.1. Cell sources/ starting material ... 4
1.2.2. Cell fate specification ... 7
1.2.3. Two and three-dimensional in vitro culture systems ... 8
1.2.4. Bioreactor culture systems ... 11
1.3. Thesis aim ... 12
2. Materials and methods ... 13
2.1. Cellular culture systems ... 13
2.1.1. Cell source ... 13
2.1.2. Cellular expansion in 2D culture system ... 13
2.1.3. Assessment of hiPSC-NPC growth profile in 2D culture system ... 14
2.1.4. hiPSC-NPC neural differentiation in 2D culture system ... 14
2.1.4.1. Neuronal differentiation of hiPSC-NPC: ... 14
2.1.4.2. Astrocytic differentiation of hiPSC-NPC: ... 15
2.1.5. hiPSC-NPC neural differentiation in 3D culture system ... 15
2.2. Cell concentration and viability determination ... 16
2.2.1. Trypan blue exclusion assay... 16
2.2.2. Fluorescence-based live/dead cell assay ... 16
2.2.3. DNA quantification-based cell concentration determination ... 16
2.3. Extracellular metabolite quantification ... 16
2.4. Aggregate size determination ... 17
2.5. Differentiation Characterization ... 17
2.5.1. Cell proliferation ... 17
2.5.2. Immunofluorescence microscopy... 17
2.5.3. Western blot analysis ... 18
2.5.4. Real-time quantitative polymerase chain reaction (RT-qPCR) ... 20
2.6. Neuronal functionality assessment ... 22
2.6.1. Imaging of synaptic vesicle exocytosis ... 22
2.6.2. Calcium transients assay ... 22
2.6.3. Glutamate-Glutamine assay ... 22
3. Results and Discussion ... 23
3.1. Characterization of hiPSC-NPC line ... 23
3.1.1. Cell growth profile assessment... 23
X
3.1.3. Differentiation potential assessment ... 26
3.1.3.1. hiPSC-NPC neuronal differentiation ... 26
3.1.3.2. hiPSC-NPC differentiation into astrocytes ... 33
3.2. hiPSC-NPC neural differentiation in 3D culture system ... 36
3.2.1. Cell aggregation and viability ... 37
3.2.2. Phenotypic characterization ... 39
3.3. Functionality assessment ... 46
4. Conclusions ... 49
5. Perspectives ... 49
XI
Figure Index
Figure1.1 - Central nervous system's neuroglia and its functions ... 1
Figure1.2 - Representative scheme of neuronal morphology ... 1
Figure1.3 - Representative image from CNS constituents and its interactions. ... 2
Figure1.4 - Representation of specific neuron and astrocyte metabolic interactions, relevant for efficient neuronal function ... 3
Figure1.5 - Representation of different populations of CNS and its development. ... 7
Figure1.6 – Cell aggregation approaches. ... 10
Figure1.7 - Schematic diagram of stirred-tank bioreactor... 11
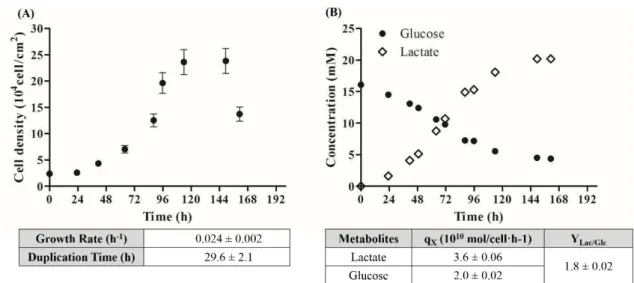
Figure 3.1- Cell growth and metabolite production/consumption profiles obtained for hiPSC-NPC cultured in 2D culture system. ... 23
Figure 3.2 - hiPSC-NPC phenotype characterization by immunofluorescence microscopy. ... 25
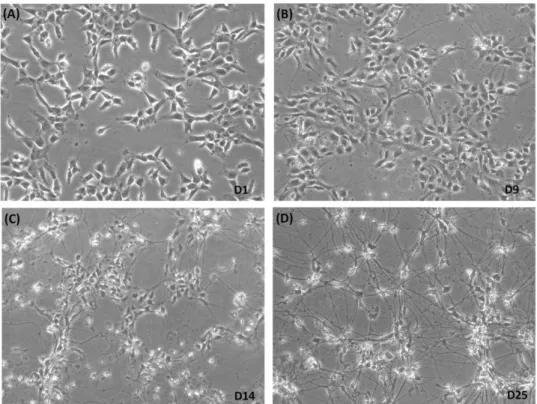
Figure 3.3 - hiPSC-NPC morphological characterization during neuronal differentiation. ... 27
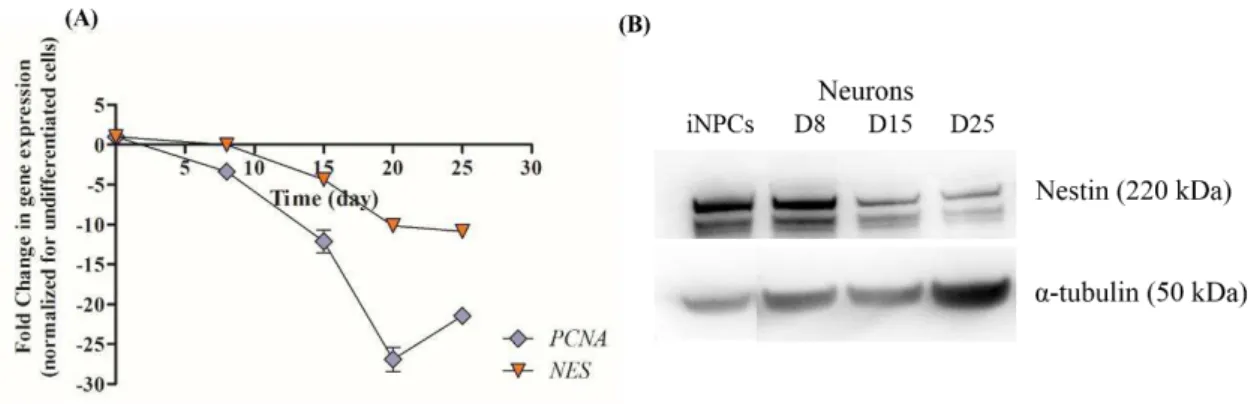
Figure 3.4 - hiPSC-NPC characterization during neuronal differentiation by RT-qPCR and Western blot. ... 28
Figure 3.5 – hiPSC-NPC neuronal differentiation characterization by immunofluorescence microscopy. ... 28
Figure 3.6 - hiPSC-NPC characterization during neuronal differentiation by immunofluorescence microscopy and RT-qPCR. ... 30
Figure 3.7 - hiPSC-NPC-derived neuron subtypes characterization during neuronal differentiation by RT-qPCR and immunofluorescence microscopy. ... 31
Figure 3.8 - hiPSC-NPC characterization during astrocytic differentiation by RT-qPCR, Western blot and immunofluorescence microscopy. ... 34
Figure 3.9 - Schematic design of hiPSC-NPC 3D bioreactor culture, depicting different phases of culture along time. ... 37
Figure 3.10 – hiPSC-NPC characterization during 3D bioreactor culture. ... 37
Figure 3.11 – hiPSC-NPC characterization during 3D bioreactor culture by immunofluorescence microscopy and RT-qPCR. ... 39
Figure 3.12 – hiPSC-NPC neuronal characterization during 3D bioreactor culture by immunofluorescence microscopy and RT-qPCR. ... 41
XII
Figure 3.14 - hiPSC-NPC astrocytic characterization during 3D bioreactor culture system by
RT-qPCR and immunofluorescence microscopy. ... 44
Figure 3.15 - hiPSC-NPC functional characterization of Ca2+ oscillations in neurospheres during
3D bioreactor culture. ... 46
Figure 3.16 - hiPSC-NPC functional characterization of synaptic vesicles exocytosis in
neurospheres during 3D bioreactor culture. ... 47
Figure 3.17 - hiPSC-NPC functional characterization of glutamate uptake and glutamine
XIII
Table Index
Table 2.1- Expansion Medium (EM) composition. ... 13
Table 2.2 - Neuronal differentiation medium (nDM) composition. ... 14
Table 2.3 - Astrocytic differentiation medium (aDM) composition. ... 15
Table 2.4 - List of primary antibodies used for immunofluorescence microscopy. ... 18
Table 2.5 - List of primary antibodies used for Western blot protein detection... 19
XV
Abbreviations
aDM Astrocytic differentiation medium
AM Aggregation medium
BBB Blood brain barrier
BCA Bicinchoninic acid
BDNF Brain-derived neurotrophic factor
BMP Bone morphogenic protein
BSA Bovine serum albumin
cDNA Complementary deoxyribonucleic acid
Ca2+ Calcium
ChAT Choline acetyl transferase
CNS Central Nervous System
CNTF Ciliary neurotrophic factor
DAPI 4',6-diamidino-2-phenylindole
DMEM Dubelco´s modified Eagle’s medium
DNA Deoxyribonucleic acid
ECL Enhanced chemiluminescence
EDTA Ethylenediamine tetraacetic acid
EdU 5-ethynyl-2’-deoxyuridine
EGF Epidermal growth factor
EM Expansion medium
FDA Fluorescein-diacetate
FGF-2 Fibroblast growth factor-2
FM-1-43 N-(3-Triethylammoniumpropyl)-4-(4-(Dibutylamino) Styryl) Pyridinium
Dibromide dye
FSG Fish skin gelatin
GAD Glutamate decarboxylase
GDNF Glia-derived neurotrophic factor
GFAP Glial fibrillary acidic protein
GLAST Glutamate aspartate transporter
Glc Glucose
Gln Glutamine
Glu Glutamate
GLT-1 Excitatory amino acid transporter-1
h hours
XVI
hiPSC Human induced pluripotent stem cellshiPSC-NPC Human induced pluripotent stem cells-derived neural precursor cells
kDa Kilo Daltons
Lac Lactate
MAP-2 Microtubule associated protein-2
min. Minutes
mM Milimolar
nDM Neuronal differentiation medium
NPC Neural precursor cells
NSC Neural stem cells
NT2 NTera2/ cl. D1cell line
NURR1 Nuclear receptor related 1
PBS Phosphate buffer saline
PCNA Proliferating cell nuclear antigen
PI Propidium iodide
PLOL Poly-L-ornithine/ laminin
PFA Paraformaldehyde
PVDF Polyvinylidene fluoride
RT-qPCR Real-time quantitative polymerase chain reaction
RA Retinoic acid
RNA Ribonucleic acid
ROCK Rho-associated protein kinase
RPL22 Ribosomal protein L22
RT Room temperature
S.E.M. Standard error of the mean
SD Standard deviation
SDS Sodium dodecyl sulphate
Syp Synaptophysin
TH Tyrosine hydroxylase
Tx-100 TritonX-100
vGlut1 Vesicular glutamate transporter 1
w/ v Weigh per volume
µm Micrometer
µM Micromolar
º C Celsius degrees
1
1.
Introduction
1.1. The Central nervous system cellular components
Central Nervous System (CNS) is one of the most complex systems in the organism
composed by many different cells interconnected in large networks along the spinal cord and the
brain. CNS is constituted by three major cell lineages: neurons, macroglia (astrocytes and
oligodendrocytes) and microglia (Martini et al. 2012) (Figure 1.1).
Figure1.1 - Central nervous system's neuroglia and its functions (adapted from Martini et al. 2012).
Neurons are the functional basic units of the CNS and are responsible for the transmission
of nerve impulses as way of neuronal communication. Its morphology includes three main
structures (Figure 1.2): (i) dendrites, the receptor ends where specific neurotransmitter receptors
receive the nervous impulses; (ii) the cell body, which contains the nucleus and most organelles
(iii) and the axon, the structure responsible for the transmission of nerve impulses.
Figure1.2 - Representative scheme of neuronal morphology (adapted from Martini et al. 2012).
Neurons can be classified by their effect on other neurons, including the neurotransmitters
used for signaling (Martini et al. 2012). Among them, the most abundant are glutamatergic
2
the opening of calcium channels and promoting synaptic activity) and GABAergic neurons, that
make short-distance synapses releasing GABA, which produces an inhibitory effect by the
closing of calcium channels and inhibition of neurotransmitter release (Martini et al. 2012).
Other type of neurons are present in different areas of the brain, including dopaminergic
neurons, which release dopamine, cholinergic neurons that release acetylcholine and
serotonergic neurons that use serotonin as neurotransmitter (Martini et al. 2012).
Astrocytes are the largest and most abundant cells of neuroglia having a very important role
in support neuronal development, metabolic and synaptic energetic demands (Allaman et al.
2011).
They are characterized by stellate morphology (Figure 1.3) and contain several
branches/extensions of two types: vascular extensions which mainly allow astrocytes to sustain
neuronal development and metabolism, and perisynaptic extensions with which astrocytes
reinforce neuronal synaptic activity (Bélanger et al. 2011).
Figure1.3 - Representative image from CNS constituents and its interactions. Representation of the interaction between neurons and capillaries mediated by astrocytes, the interconnection of different axons by oligodendrocytes connection and ependymal cells and microglial cells in the system. All features mentioned in the text are also explicit in this image, namely extensions and soma’s sizes (from Martini et al. 2012).
Vascular extensions almost totally enwrap intracerebral blood vessels providing a rapid
transport system for nutrients, ions and other essential substances dissolved in the blood stream
(Martini et al. 2012). At the same time, vascular astrocytic membrane has highly selective
permeability, contributing to brain protection by the blood brain barrier (BBB) to specific
molecules, such as amino acids and hormones that can influence neuronal function (Tortora &
Derrickson 2012). Due to their close location to the blood vessels, vascular extensions are
characterized by a high density of glucose transporters responsible for glucose uptake from the
blood stream. Astrocytes convert glucose mainly to lactate through glycolysis (Bélanger et al.
2011), which is afterwards released and used as carbon source by neurons at increased
3
Figure1.4 - Representation of specific neuron and astrocyte metabolic interactions, relevant for efficient neuronal function (from Bélanger et al. 2011).Astrocytes can also act as a neuronal energy reservoir mediating the glycogen synthesis and
breakdown for these cells (Despopoulos & Silbernagl 2003). On the other hand, perisynaptic
extensions enclose most neuronal synapses and it is in these extensions that astrocytes contain
specific glutamate transporters such as GLAST (glutamate aspartate transporter) and GLT-1
(excitatory amino acid transporter-1) (Matsugami et al. 2006). Glutamate is one of the most
abundant neurotransmitters and when in excess at the synaptic cleft it is excitotoxic, reason why
it has to be recycled (Bélanger et al. 2011). Astrocytes uptake glutamate through GLT-1 and
GLAST avoiding neuronal excitotoxicity and enabling neuronal availability to the next nerve
impulse (Matsugami et al. 2006). Glutamate is converted in astrocytes to glutamine, which is
released to the extracellular medium and will be used by neurons to glutamate neurotransmitter
synthesis (Figure 1.4), completing glutamate recycling (Bélanger et al. 2011). The conversion of
glutamate to glutamine is mediated by glutamine synthetase, an enzyme expressed in astrocytes
but not in neurons). Finally, astrocytes are able to produce glutathione, the most antioxidative
molecule in the brain, involved in ion homeostasis along with glutamate transport (Bélanger et
al. 2011).
The other macroglia constituents are oligodendrocytes that have smaller but denser cell
body and cytoplasm, comparatively to astrocytes (Figure 1.3). Typically, oligodendrocytes
present several extensions that contact with neurons, both at cell body and axon (Baumann &
Pham-Dinh 2001; Martini et al. 2012). Axonal extensions are responsible for the main function
of these cells, the myelination process. Near the terminal of each extension, the plasma
membrane expands to form an enormous and thin pad that surrounds the axon, named myelin
sheath (Martini et al. 2012). Myelin sheath’s rich composition in lipids, low content of water
and segmental structure (alternated with unmyelinated parts of the axon - Ranvier nodes),
4
myelinates various segments of different axons (Figure 1.3), contributing also to structural
organization of the CNS (Baumann & Pham-Dinh 2001). Once BBB gets established,
oligodendrocytes are also the source of transferrin to neural cells. This protein transports iron
and has been demonstrated to be a trophic and survival factor of neurons and astrocytes,
indicating another role of oligodendrocytes (Baumann & Pham-Dinh 2001).
Microglia are the less abundant and smallest cells in neuroglia (Figure 1.3). Their main
function is the phagocytosis of damaged tissue, waste products and pathogens, being considered
the neural counterparts of macrophages (Martini et al. 2012). Microglia are derived from the
myeloid lineage (Ginhoux et al. 2013) and upon injury migrate to the affected zone constituting
the first line of combat to CNS injuries (Martini et al. 2012).
1.2. Available models of CNS
Brain disorders are becoming an enormous economic and social burden around the world
due to increasing incidence rate and lack of therapeutic solutions (Lunn et al. 2011). However,
for most of neurodegenerative diseases the mechanisms underlying its etiology are not
completely understood, which makes it difficult to develop therapies for more than palliative
benefit (Dantuma et al. 2010). These difficulties are consequence of the lack of accurate models
where the disease is faithfully represented at early pathological stage in order to be studied and
predict drug response in patients (Schüle et al. 2009; Breslin & O’Driscoll 2013).
1.2.1. Cell sources/ starting material
The available CNS models include in vivo or in vitro approaches. In vivo models are currently the gold standard to CNS modeling, since every promising therapeutic target is
validated in animal models (Strome & Doudet 2007; Yuan et al. 2013). For disease modeling,
genetically engineered or chemically induced approaches are commonly used (Strome &
Doudet 2007). In animal models, molecular biochemical machinery and interactions are present,
including the major constituents that have impact in CNS functions and response, such as
microglial cells, vascularization and BBB (Carson et al. 2008; Lippmann et al. 2013). However,
animal models often fail in mimicking the human phenotype; physiological and
neuropathological conditions are only partially represented, leading to different phenotypes and
drug responses (Schüle et al. 2009). Furthermore, the use of animals always raises ethical
concerns, which limits its use in research activities (Schüle et al. 2009).
To overcome the interspecies differences and reduce animal sacrifice, human cell-based in vitro models are a good alternative. In vitro models are more amenable for genetic manipulation
and the use of human cells enable the investigation of pathophysiological characteristics in a
human genome-based system, less complex than intact tissues (Schüle et al. 2009; Casarosa et
5
Immortalized cell lines have long been used, as they provide a robust system for stable cellular
maintenance and differentiation in vitro (Breslin & O’Driscoll 2013). These cell lines are either
derived from tumor cells or are immortalized by genetic or epigenetic strategies that induce the
permanent expression of immortalizing oncogenes and repression of developmental genes (De
Filippis et al. 2007) possessing virtually unlimited proliferation capacity (Casarosa et al. 2013).
Although being very advantageous cell sources in terms of longevity, the high expression of
transforming oncogenes may lead to the loss of main target tissue features, decreasing the
physiological relevance of these cell lines (Gorba & Conti 2013).
Human neural precursor cells (NPC) also named neural stem cells (NSC) are multipotent
stem cells with self-renewal capacity and can differentiate into the three differentiated neural
lineages – neurons, astrocytes and oligodendrocytes (Gage 2000). NPC are the first progenitor
cells of CNS, and since they were discovered to reside in niches of fetal and adult brains, they
were suggested as a choice to produce more reliable human CNS in vitro models (Gorba &
Conti 2013). NPC can be isolated directly from aborted fetuses or from adult post-mortem
tissues and are able to proliferate and differentiate in vitro (Ray et al. 2014). However, ethical
controversies raised by the use of human fetuses-derived material and the fact that these cells
present limited proliferation ability compromise its availability and applicability (Jakel et al.
2004). NPC can also be derived from human embryonic stem cells (hESC), which are isolated
from the inner mass of blastocyst during embryonic development. hESC are pluripotent, with
capacity to differentiate into cells of the three germ layers (endoderm, ectoderm and mesoderm)
(Itskovitz-Eldor et al. 2000). These cells are able to maintain their high proliferation capacity
and differentiation potential in vitro, for long periods of time (Falk et al. 2012). An important advantage of these cells is the possibility to build disease-specific models from cells obtained
from morula stage of pre-implantation embryos in genetic disease screening or by the
transference of nuclei from patient somatic cells into enucleated oocytes (reviewed by
Kunkanjanawan et al. 2011). However, these procedures revealed to have low efficiency and
highly challenging technical issues, with limitations associated to the lack of oocytes donors and
hampered by the ethical issues concerning human embryos manipulation (Kunkanjanawan et al.
2011).
The recent development made by Takashi and Yamanaka in 2007 (Takahashi et al. 2007)
introduced the possibility to reprogram human somatic cells from their differentiated state to an
induced pluripotent state, the so called induced pluripotent stem cells (iPSC). This have
provided an additional source of NPC and revolutionized the field of in vitro human disease neural models (Saporta et al. 2011). The iPSC technology consists of inducing any somatic cell
to become pluripotent by the forced expression of key pluripotent transcription factors such as
Oct-4, c-Myc, Sox-2 and Klf-4 (Takahashi et al. 2007). iPSCs were initially generated by viral
6
of potentially introducing viral genes and oncogenes (Faiz & Nagy 2014). Alternative
reprogramming technologies have been developed, such as: less oncogenic gene combinations
(Faiz & Nagy 2014); non-integrating viral vectors, which are able to reprogram cells avoiding
insertional mutagenesis; DNA-free methods, which are based in a direct delivery of RNA,
avoiding the use of virus and DNA; and nucleic acid-free technologies which consists of
peptide-based delivery of the transcription factors (reviewed by Silva et al. 2015). DNA-free
technologies have been described as safer and more efficient, but the high cost demands hamper
its use as standard protocols (Silva et al. 2015).
hiPSC, being pluripotent cells can be maintained indefinitely in vitro and are able to differentiate in any cell type of all three germ layers, providing a limitless amount of well
characterized cells (Hungsberg et al. 2013). Furthermore these cells can be generated from
potentially any somatic cell from any individual at any time point which enables the production
of cell models carrying genetic information from patients with a specific mutation (Zeng et al.
2014). This enables the study of how specific sets of mutations lead to the respective
neurological disease across a lifetime, which was not possible with non-iPSC models (Zeng et
al. 2014).
To date, many studies using normal and patient-derived hiPSCs have already been
developed (Zeng et al. 2014) demonstrating that some common challenges remain. These
challenges include a resulting heterogeneous population, low reproducibility between lines from
the same and between patients (Dolmetsch & Geschwind 2011) and the lack of a mature disease
phenotype. Regarding the latter, in some pathology studies, such as late-onset Parkinson
disease, the immature disease phenotype was circumvented by adding progerin as a stressor to
the culture, which led to the development of an aged related phenotype (Miller et al. 2013).
However some pathophysiological features may require at least a partial recapitulation of CNS
architecture which is not achieved in traditional monolayer cultures (Choi et al. 2014; Saporta et
al. 2011; Hungsberg et al. 2013). With the aim to overcome the mentioned limitations,
differentiation protocols must be improved, in order to achieve standardization. This could lead
to homogeneous populations and more mature phenotypes in a reproducible way. To overcome
the genetic diversity between lines it is possible to take advantage of the fact that hiPSC lines
are an unlimited cell source that can be generated from any cell type and any individual,
offering the opportunity to generate multiple lines from the same cell source or multiple lines
derived from different individuals with the same pathology (Hungsberg et al. 2013).
Consequently, it would lead to a diversity panel covering the epigenetic divergences reproduced
along culture and covering the allelic spectrum across a specific disease (Hungsberg et al.
2013). This is an interesting tool to evaluate disease progression with higher accuracy, since
variability between individuals within a specific pathology would be considered. Moreover the
7
statistically relevant number of cell lines, would allow to take into account these divergences
(Hungsberg et al. 2013) in the development of new therapeutics.
1.2.2.Cell fate specification
Generation of functional human neural cells in vitro is quite challenging. Based on the knowledge on mammalian CNS developmental processes, strategies to the specification of these
lineages have been developed; nonetheless, these are still suboptimal (Dhara & Stice 2008).
Neurons and astrocytes derive from the same progenitor cells in different developmental
time (Zhang 2006) and under specific conditions (Figure 1.5). hPSC (either hESC or hiPSC) can
be differentiated into the ectoderm lineage by: (i) removal of self-renewing factors (such as
feeder-layers) (Liu & Zhang 2011), which reduces proliferation and induces differentiation; (ii)
fibroblast growth factors (FGF) addition (Zhang et al. 2001) which induces neural state (Zhang
2006); and (iii) inhibition of bone morphogenic proteins (BMPs) (Lavaute et al. 2009) and Wnt
signaling. The latter is required for subsequent modulation of neural differentiation by FGF-2
and anti-BMP signaling (Bengoa-Vergniory & Kypta 2015; Zhang 2006).
8
Upon differentiation to the neural lineage, the first neural progenitor cells are
neuroepithelial cells (NE) (Nat et al. 2007). NE are normally expanded under FGF-2 and EGF
conditions and gradually lose epithelial morphology, such as tight junctions, acquiring a radial
morphology to give rise to more mature progenitors such as, neural progenitor cells (NPC) and
radial glia (RG) (Barry et al. 2014). NPCs cells are able to generate neurons in a first neurogenic
phase and astrocytes later in development, under regulation by specific stimuli (Figure 1.5).
Different neuronal subtypes require different stimuli to induce specification, such as the
inhibition of sonic hedgehog (Shh) signaling for glutamatergic neurons, whereas Shh activation
in the presence of FGF-2 enables specification in gabaergic (Vazin et al. 2014). FGF-8 and Shh
are a stimulus which develops NPC into dopaminergic neurons. All the mentioned pathways can
be potentiated by the addition of enhancers such as, brain-derived neurotrophic factor (BDNF),
Glial cell-derived neurotrophic factor (GDNF), ascorbic acid (AA) and cAMP (Stanslowsky et
al. 2014; Simão et al. 2015). Astrocytes can be generated with high efficiency by BMP-4 and
FGF-2 action (Jiang et al. 2013), and the addition of CNTF (ciliary neurotrophic factor) in the
medium has been reported to enhance the differentiation process (Shaltouki et al. 2013).
1.2.3. Two and three-dimensional in vitro culture systems
CNS comprises a complex architecture where cells present specific morphology,
polarization and interactions to attain their function. Most of cellular processes in vivo are
highly regulated by cell-cell and cell-extracellular matrix interactions (Ma et al. 2008). These
interactions, as well as the exposure to soluble factors, allow cells to recognize and activate
specific signaling pathways, in order to differentiation or proliferation to occur (Ma et al. 2008;
Kothapalli & Kamm 2013). The ideal in vitro model would be composed by the best cellular
source coupled to the culture system that allows reproducing these essential components and
architecture as they happen in vivo.
Two dimensional (2D) in vitro culture systems have been the traditional platforms for high-throughput screenings in drug development as well as to study cell behavior in well-defined
conditions (Tibbitt & Anseth 2009). In these easy-handling platforms, cells grow as a
monolayer on adherent flat surfaces that present low resistance and high surface area, sustaining
cells rapid proliferation (Tibbitt & Anseth 2009). However, as a monolayer, there is only partial
contact of the cell membrane with extracellular matrix (ECM) and neighboring cells. The rest of
the cell is in contact with the bulky culture medium, where the soluble factors are diluted. This
leads to an unnatural polarization that affects ECM dependent-activation of signaling pathways
as well as cellular phenotypic fate (Tibbitt & Anseth 2009). Moreover, small molecules
influence cell migration, communication and differentiation in a concentration-dependent
manner, as they are present in vivo in gradients not accomplished in 2D cultures (Tibbitt &
9
feature of interest in defined conditions, 2D culture systems often diverge considerably from in vivotarget tissue’s phenotype (reviewed by Pampaloni et al. 2007).
Three dimensional (3D) culture systems add complexity to in vitro cultures by providing specialized cell-cell contact in 3D (Breslin & O’Driscoll 2013). Cell-cell interactions in
suspension stimulate NPC production of ECM and soluble factors, which enhance cellular
signaling pathways, such as differentiation (Schwindt et al. 2009). This leads to a differentiated
phenotype closer to cellular microenvironment in a complex architecture more closely
resembling the in vivo microenvironment (Tang-Schomer et al. 2014; Simão et al. 2015; Liu et
al. 2013).
3D culture systems include scaffold-based and scaffold-free systems. In scaffold-based
systems cells are embedded within or on the top of scaffolds which provides an initial support to
seeded cells and promotes cellular migration up to a 3D architecture (Breslin & O’Driscoll
2013; Li & Cui 2014). Scaffolds can be directly extracted from natural sources such as animal
tissues by decellularization, presenting a specific organ complexity but undefined composition
(Li & Cui 2014), as well as limited access. Recent advances have already enabled
decellularization of murine lung, kidney and heart (reviewed by Li & Cui 2014), however this
hasn’t been described yet for brain tissue. Alternatively, scaffolds can be synthetically fabricated, normally porous with adequate spaces for cell migration. Its combination with ECM
and adhesion molecules or soluble factors results in a strategy that provides the required signals
to mimic and induce several cellular processes, such as proliferation or differentiation (Serra et
al. 2011; Tang-Schomer et al. 2014; Kim et al. 2015). Although having a defined composition,
these scaffolds do not have the close relation to the organ specific complexity as decellularized
scaffolds (reviewed by Li & Cui 2014). Nonetheless, diverse scaffold-based 3D cultures have
been able to recapitulate specific features of the complex neural tissue architecture.
Tang-Schomer et al. engineered a porous silk-based scaffold with the adequate stiffness to support rat
embryonic neurons anchoring; coating with soft ECM matrix enabled penetration and expansion
to develop a six-layered structure, mimetic of the of neural cortex. The authors attained a
complex architecture composed by electrophysiological functional neurons and few glial cells
with long-term viability (Tang-Schomer et al. 2014). Scaffolds enable retaining proteins
necessary to mimic disease phenotypes, such as β-amyloid- accumulation in hNPC culture to
mimic Alzheimer’s phenotype (Kim et al. 2015) which was not possible in 2D adherent systems due to diffusion of the peptide into the bulky media. Furthermore, scaffolds protect cells from
shear stress (Serra et al. 2011) and may present porosity necessary to attain good oxygenation
levels and access to nutrients (Li & Cui 2014). These parameters are essential to obtain mature
and homogeneous differentiated phenotype throughout the 3D structure and enhance the
10
However, it is possible to mimic tissue complex architectures without the aid of any
exogenous matrix by culturing cells in a scaffold-free environment. These culture systems take
advantage of the potential of many cell types to self-organize into 3D structures named cell
aggregates, spheroids or neurospheres, the latter if composed of neural cells. The strategy
consists of promoting aggregation by inducing cell-cell interaction (Breslin & O’Driscoll 2013).
Figure1.6 – Cell aggregation approaches. (A) agitation-based method or (B) Hanging drop method. (C)
aggregation in low adherent surfaces method (adapted from Breslin & O’Driscoll 2013)
Cellular aggregation can be attained by several strategies, e.g., by culturing cells in
non-adherent surfaces, by restricting cells to a small volume in a suspense drop or by culturing
single cells in constant motion (Figure 1.6). In the latter, motion prevents adherence and
promotes cell-cell interactions that consequently lead to aggregation (reviewed by Breslin &
O’Driscoll 2013). In aggregates, cells are in a complex mutual contact similar to their in vivo
microenvironment, which stimulates the production of their native ECM and exchange of
soluble factors, enhancing (Tieng et al. 2013) proliferative and differentiation capacity (Serra et
al. 2012). Thus, an important advantage of scaffold-free 3D culture approaches is the possibility
to efficiently generate differentiated neural cells with no addition of exogenous ECM
components, inducing cells to recreate their own environment. In principle, this will be more
recapitulative of in vivo conditions (Serra et al. 2012); demonstrated by recent reports of
efficient generation of specific types of neurons, astrocytes and oligodendrocytes in
scaffold-free-conditions (Simão et al. 2015; Terrasso et al. 2015; Paşca et al. 2015). Cell aggregates are a
versatile culture approach as it is compatible with high throughput techniques and scale-up
systems. They can be cultured within high throughput platforms such as multi-well plates and
microfluidic devices which are amenable to automated procedures (Breslin & O’Driscoll 2013)
and in scale-up systems such as bioreactors, which allow mass production of homogeneous
batches of aggregates (Serra et al. 2012; Breslin & O’Driscoll 2013). Some limitations of static
aggregate cultures include the low size control which can be overcome by seeding cells in
micro well plates, or modulating cell density of seeding to control aggregate size (Breslin &
O’Driscoll 2013; Li & Cui 2014). Furthermore studies developed with neural single cells in agitation-based culture systems have shown that aggregate size is easily controllable by the
manipulation of agitation rate in the initial times of culture, resulting in a generally sized
11
Another limitation reported is the lack of nutrients and oxygen diffusion deeper into the
aggregate, creating necrotic centers and accumulation of by-products (Dan Ge 2012), which
mainly affects cell viability (Serra et al. 2012). Nonetheless, neurospheres have been generated
successfully without necrotic centers by using agitation-based culture systems (Simão et al.
2015; Terrasso et al. 2015) that present improved mass and gas transfer (Serra et al. 2012).
1.2.4. Bioreactor culture systems
In the recent years advances have been made in the development of strategies to generate
scalable and reproducible 3D culture systems. Among them, the use of bioreactors to culture
cell spheroids have been reported to improve cell survival, proliferation and differentiation
relatively to 2D culture systems (Serra et al. 2009; Rodrigues et al. 2011).
Stirred-tank bioreactors are dynamic systems that typically comprise: a vessel with a
head-possessing top rotatory paddle, incorporated O2, CO2, temperature and pH sensor probes and an
automated control device that allows the constant monitoring and control of culture conditions.
Bioreactor design enables gas exchange and liquid exchange (Figure 1.7). Finally there is easy
access to the culture suspension which enables non-destructive sampling (Serra et al. 2012).
Figure1.7 - Schematic diagram of stirred-tank bioreactor. (a) - glass vessel, (b) – impeller, (c) – Temperature sensor (d) - pH electrode (e) - pO2 electrode. (adapted from Serra et al. 2012)
Cell culture in stirred-tank bioreactors provides a number of parameters that can improve
recapitulation of tissue physiological conditions. Agitation has an important role in granting a
homogeneous distribution of media components along culture area, which enhances mass
transfer and promotes cell-cell contacts that favor aggregation (Kinney et al. 2011; Serra et al.
2012).
The presence of sensor probes coupled to the automated control gives the possibility to
define parameters such as dissolved oxygen, CO2 percentage, pH and temperature, which
enables the achievement of an optimal culture environment more similar to the in vivo. Finally, bioreactors can be operated in perfusion culture mode in which cells are seeded and the media is
12
and extends culture time, since there is constant removal of toxic metabolites and supply of
nutrients and oxygen (Serra et al. 2009; Serra et al. 2010; Li & Cui 2014). Additionally,
perfusion enables biomolecular gradients which, as already mentioned, act as regulators on cell
processes such as migration, proliferation and differentiation. These parameters allow a better
defined and therefore more reliable cell culture (Li & Cui 2014).
Notwithstanding, stirred-tank bioreactor systems also present limitations such as
hydrodynamic shear stress derived from the agitation. Its effect is dependent of agitation rate,
impeller geometry and position and finally, the presence of probes (Kinney et al. 2011).
However, there is an optimal cellular condition, when these variables are in equilibrium do not
harming cell culture but, on the contrary inducing cellular proliferation and/or differentiation
(King & Miller 2007; Serra et al. 2012), (Terrasso et al. 2015; Brito et al. 2012)
In conclusion, aggregate culture in stirring-tank bioreactors is a very advantageous in vitro
culture strategy that can recapitulate the chemical, mechanical and biochemical in vivo
microenvironment with higher physiological relevance. Due to this, it was the chosen system in
this work to develop a 3D in vitro model of CNS derived from hiPSC-NPC.
1.3. Thesis aim
The aim of this work was to explore the potential of neural progenitor cells derived from
hiPSC (hiPSC-NPC) to differentiate towards mature neural cells in order to develop an in vitro
cell model able to recapitulate human the brain and its features.
The first objective consisted in the characterization of multipotent phenotype of hiPSC-NPC
in a 2D adherent culture system. For this, self-renewal capacity and differentiation potential into
neuronal and astrocytic lineages were assessed. In parallel, neuronal differentiation protocol and
analytical tools were validated for further implementation in the 3D culture system.
The second objective was focused on the implementation of a robust and reproducible
hiPSC-NPC-derived 3D in vitro CNS model able to recapitulate the target tissue microenvironment and cellular processes. To accomplish this, a computer-controlled bioreactor
culture system, operating under perfusion mode was optimized for an efficient aggregation of
homogeneous hiPSC-NPC neurospheres. The integration of this strategy with a differentiation
step was performed to enable the generation of neuronal and astrocytic cells from hiPSC-NPC
neurospheres. Finally, in order to assess the mature and functional phenotype, a detailed
13
2.
Materials and methods
2.1. Cellular culture systems
2.1.1.Cell source
hiPSC-derived NPC (hiPSC-NPC) were kindly supplied by Dr. Tomo Saric from University
of Cologne, Germany.
2.1.2.Cellular expansion in 2D culture system
hiPSC-NPC were propagated on adherent surfaces of t-flasks (Falcon) previously coated
with Poly-L-Ornithine (0.0016 %, Sigma-Aldrich) and Laminin (1 µg/mL, Sigma-Aldrich)
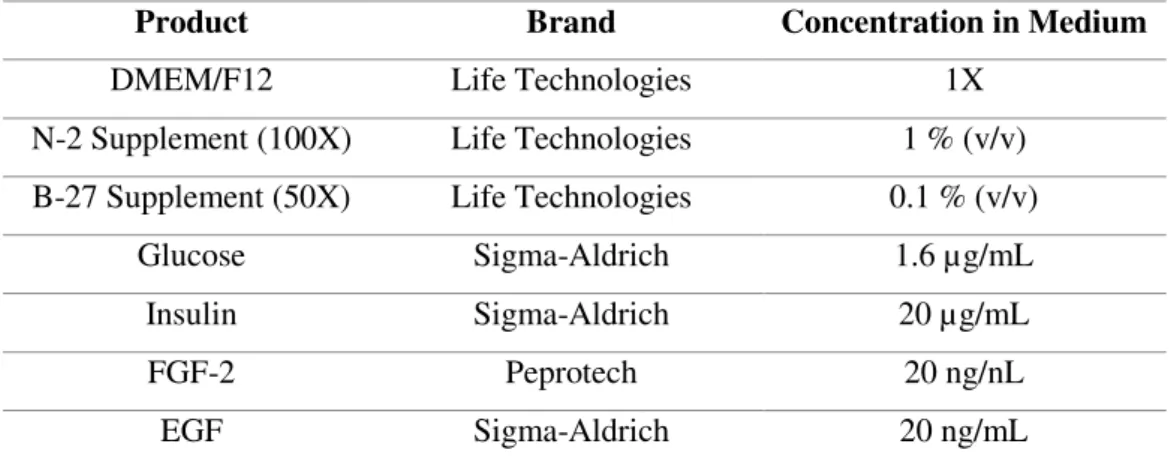
(PLOL-coated) in expansion medium (EM, see Table 2.1).
Table 2.1- Expansion Medium (EM) composition.
Product Brand Concentration in Medium
DMEM/F12 Life Technologies 1X
N-2 Supplement (100X) Life Technologies 1 % (v/v)
B-27 Supplement (50X) Life Technologies 0.1 % (v/v)
Glucose Sigma-Aldrich 1.6 µg/mL
Insulin Sigma-Aldrich 20 µg/mL
FGF-2 Peprotech 20 ng/nL
EGF Sigma-Aldrich 20 ng/mL
DMEM is Dubelco’s modified Eagle’s medium, F12 is Ham’s F12 Nutrient mixture, FGF-2 is fibroblast growth factor 2 and EGF is epidermal growth factor
Cells were splitted at 90 % confluence, typically every 4 days. Cell monolayers were rinsed
with phosphate-buffered saline (PBS; Life Technologies), followed by incubation with 0.05 %
Trypsin-EDTA (Ethylenediamine tetraacetic acid, Life Technologies) for 1-2 minutes at room
temperature. Cells were ressuspended in DMEM supplemented with 10 % fetal bovine serum
(both from Life Technologies) and centrifuged at 300x g for 5 minutes, with slow brake. The
cell pellet was ressuspended in a small volume of EM with a 1 mL pipette to obtain a
homogeneous single cell suspension. Cell concentration and viability were determined by the
trypan blue exclusion assay (section 2.2.1.). The cell suspension was used to inoculate
PLOL-coated t-flasks, at a cell density of 3x10⁴ cell/cm2. A 50 % media exchange was performed at
day 2 of culture. Cells were maintained under humidified atmosphere, in a multi-gas cell
14
2.1.3.Assessment of hiPSC-NPC growth profile in 2D culture systemhiPSC-NPC were seeded at 3 x10⁴ cell/cm2 in 10 t-flasks with 25 cm2 of culture surface, as
described in the previous section. During 7 consecutive days, one t-flask was trypsinized every
24 hours, except for days 2, 3 and 4 of culture, during which 2 t-flasks were tripsinized, in order
to follow more accurately the exponential phase. Cell density determination was performed by
the trypan blue exclusion assay (section 2.2.1.).
Samples of culture medium were collected for quantification of extracellular metabolites:
from each t-flask used for cell density determination, 1 mL of culture supernatant was collected,
centrifuged at 1000x g for 5 min and stored at -20 °C for further analysis.
2.1.4.hiPSC-NPC neural differentiation in 2D culture system
Two differentiation protocols were performed in 2D culture systems, in order to obtain
monotypic cultures of neurons and astrocytes. In both cultures, cells were plated on
PLOL-coated plates and maintained in a multi-gas cell incubator (Sanyo) at 37 ºC, in a humidified
atmosphere of 3 % O2 and 5 % CO2.
2.1.4.1. Neuronal differentiation of hiPSC-NPC:
Cells were plated at a cellular density of 3x10⁴ cell/cm2, in EM; 24 hours after plating, EM
was replaced by neuronal differentiation medium (nDM, see Table 2.2) and cells further
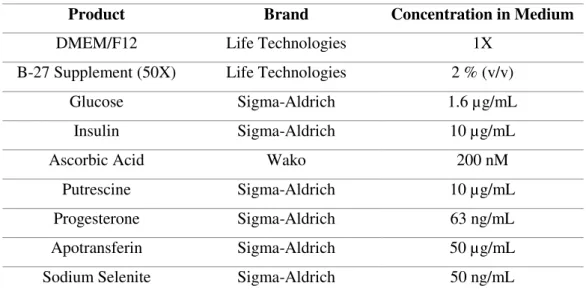
cultured for 7 days, with half of the volume of medium exchanged every 48 h.
Table 2.2 - Neuronal differentiation medium (nDM) composition.
Product Brand Concentration in Medium
DMEM/F12 Life Technologies 1X
B-27 Supplement (50X) Life Technologies 2 % (v/v)
Glucose Sigma-Aldrich 1.6 µg/mL
Insulin Sigma-Aldrich 10 µg/mL
Ascorbic Acid Wako 200 nM
Putrescine Sigma-Aldrich 10 µg/mL
Progesterone Sigma-Aldrich 63 ng/mL
Apotransferin Sigma-Aldrich 50 µg/mL
Sodium Selenite Sigma-Aldrich 50 ng/mL
At day 8 of culture, cells were trispsinized as previously described, replated at a cellular
15
medium exchanged every 48 h. Along differentiation, samples were collected at days 8, 15, 20
and 25 of culture, in order to characterize cellular differentiation.
2.1.4.2. Astrocytic differentiation of hiPSC-NPC:
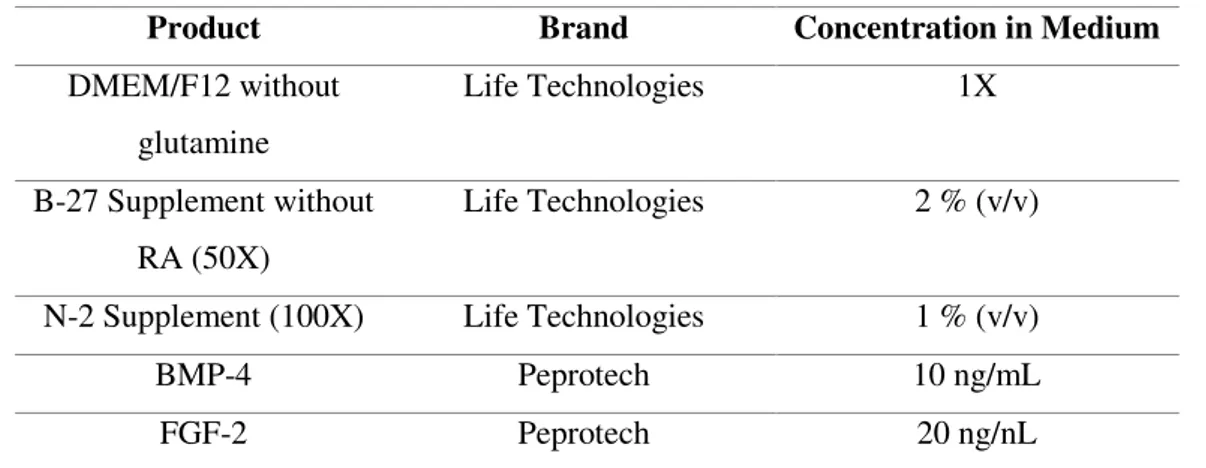
Cells were plated at a cellular density of 5x10⁴ cell/cm2 in astrocytic differentiation medium
(aDM, see Table 2.3) and cultured for 36 days.
Table 2.3 - Astrocytic differentiation medium (aDM) composition.
Product Brand Concentration in Medium
DMEM/F12 without
glutamine
Life Technologies 1X
B-27 Supplement without
RA (50X)
Life Technologies 2 % (v/v)
N-2 Supplement (100X) Life Technologies 1 % (v/v)
BMP-4 Peprotech 10 ng/mL
FGF-2 Peprotech 20 ng/nL
RA is retinoic acid, BMP-4 is bone morphogenic 4 and FGF-2 is fibroblast growth factor-2.
Along this time, a 75 % medium exchange was performed every 48 h. When 95 %
confluency was attained cells were replated by trispsinization as previously described and
seeded at a cellular density of 5x10⁴ cell/cm2. Cells were maintained in a multi-gas cell
incubator (Sanyo) at 37 ºC, in a moisted atmosphere of 3 % O2 and 5 % CO2. Cellular samples
were collected at days 4, 10, 16, 23, 30 and 36 of culture in order to characterize differentiation
progress.
2.1.5.hiPSC-NPC neural differentiation in 3D culture system
hiPSC-NPC were expanded as described in section 2.1.2., dislodged with trypsin and passed
through a 70 µm nylon strainer (Millipore) in order to eliminate cell clumps.
The obtained single cell suspensions were diluted for a cell density of 4x10⁵ cell/mL in
aggregation medium (AM), with the same composition as EM, except for reduced EGF/FGF
concentration (5 ng/mL). At inoculation, AM was further supplemented with 5 μM Y-27632, a
rho-associated protein kinase (ROCK) inhibitor, in order to prevent dissociation-induced
apoptosis (Watanabe et al., 2007; Koyanagi et al., 2008). Cells were then inoculated into
computer controlled stirred-tank Bioblock bioreactor system (DASGIP, Eppendorf). Culture
conditions were set to maintain cells under 3 % dissolved oxygen (15 % of air saturation), pH
16
aggregate fusion, the stirring rate was increased up to 80 rpm, based on visual inspection of the
culture.
After 48 h of culture, gradual media exchange was performed through the perfusion system,
at a perfusion rate of 0.33 day-1 (i.e., 33 % medium exchange per day). For the first 7 days of
culture, the perfusion medium was AM and from that day up to day 30 of culture nDM was
used.
2.2. Cell concentration and viability determination
2.2.1.Trypan blue exclusion assay
To determine cell concentration and viability, single cell suspensions were diluted in 0.1 %
(v/v) Trypan Blue (Life Technologies) in PBS. This blue membrane impermeant dye is
excluded by viable cells and enters in non-viable cells that present damaged membranes. This
method allows a quantitative determination of cell concentration and viability after cell counting
in Fuchs-Rosenthal haemocytometer counting chamber.
2.2.2.Fluorescence-based live/dead cell assay
To determine the cell viability of 3D cultures, cells were incubated with a solution
composed by two fluorescent probes: fluorescein diacetate (FDA, 1:1000) and propidium iodide
(PI, 1:1000). FDA is a cell permeant molecule that, when internalized by viable cells, is
processed by esterases originating fluorescein, a fluorophore of green color, allowing
identification of viable cells. Propidium iodide (PI) is a membrane impermeant fluorophore that
only penetrates cells with damaged membrane, coloring them red upon intercalation between
DNA bases.
2.2.3.DNA quantification-based cell concentration determination
To determine cell density within neurospheres, these were collected from culture,
centrifuged at 1000 x g, at room temperature and ressuspended in water. Cellular lysis was
achieved through a freeze-thaw cycle in liquid nitrogen coupled to 15 min sonication into an
ultrasound bath at 35 kHz. DNA quantification was performed using the Quant-iT™
PicoGreen® dsDNA Assay Kit (Life Technologies), according to the manufacturer’s
instructions. Briefly, picogreen dye which is an ultrasensitive double stranded DNA binding
fluorescent molecule, was added to the cell lysate. Fluorescence intensity was measured in
spectrofluorometer at 480 nm excitation wavelength and 520 nm emission wavelength.
2.3. Extracellular metabolite quantification
The determination of glucose, lactate, glutamate and glutamine concentration was
17
Sciences). The method is based on immobilized enzyme membranes that oxidize metabolites
into hydrogen peroxide, producing an electron flow proportional to the concentration of
metabolite.
2.4. Aggregate size determination
Neurosphere size determination was performed by phase contrast imaging analysis. This
was performed in ImageJ software (version 1.49g), by manually adjusting the threshold that
defines the aggregate boundaries for automatically calculation of Feret’s diameter for each one
of the aggregates.
2.5. Differentiation Characterization
2.5.1.Cell proliferation
In order to determine the percentage of proliferative cells within neurospheres,
immunostaining analysis of EdU (5-ethynyl-2´-deoxyuridine) integration was performed using
the Click-iT® EdU Alexa Fluor® 488 Assay Kit (Life Technologies). EdU is a nucleoside, a
thymine analog which is inserted in DNA during DNA cellular replication. Briefly,
neurospheres were allowed to adhere to PLOL-coated glass coverslips and incubated with 10
µM EdU in culture media for 20 h. After incubation, cells were fixed with 4 %
paraformaldehyde (PFA) and 4 % sucrose in PBS for 20 min, washed twice with PBS with 1 %
bovine serum albumin (BSA) and permeabilized with saponin-based working reagent for 20 to
30 min, depending on neurosphere size. Cells were incubated with AlexaFluor488 anti-EdU
antibody, according to manufacturer’s instructions, for 45 min to 1 h 15 min, depending on
neurosphere size. Coverslips were mounted in ProLong Gold antifade reagent with DAPI (Life
Technologies). Preparations were visualized in spinning disk microscope (Nikon Eclipse Ti-E,
confocal scanner: Yokogawa CSUx1) and resultant images processed in ImageJ software
(version 1.49g) by the cell counter plug-in, for quantitative analysis of labeled cells.
2.5.2.Immunofluorescence microscopy
Neurospheres were plated in PLOL-coated glass coverslips or µ-Slide 4 Well (Ibidi) until
adherence and then processed for immunostaining. Cells were fixed in 4 % paraformaldehyde
(PFA) and 4 % sucrose in PBS for 20 min. For intracellular epitopes, fixation was followed by
permeabilization in 0.1 % (w/v) Triton X-100 (Sigma-Aldrich) in PBS. A blocking step was
then performed, by incubation with 0.2 % (w/v) fish skin gelatin (FSG, Sigma-Aldrich) for 30
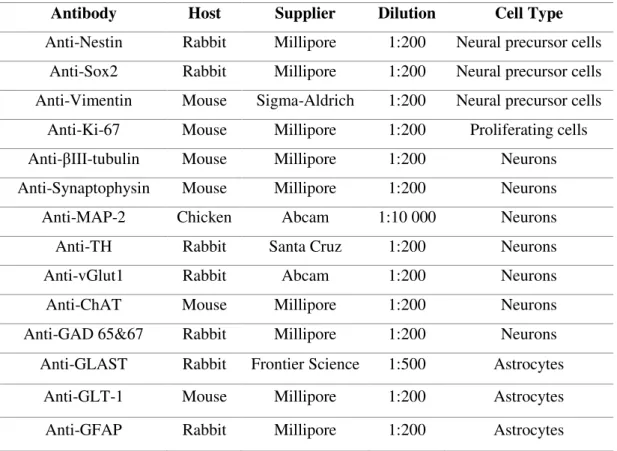
min. Subsequently, incubation with primary antibodies (Table 2.4) diluted in 0.125 % (w/v)
FSG only for surface epitopes or 0.125 % (w/v) FSG and 0.1 % (w/v) TX-100 for intracellular
18
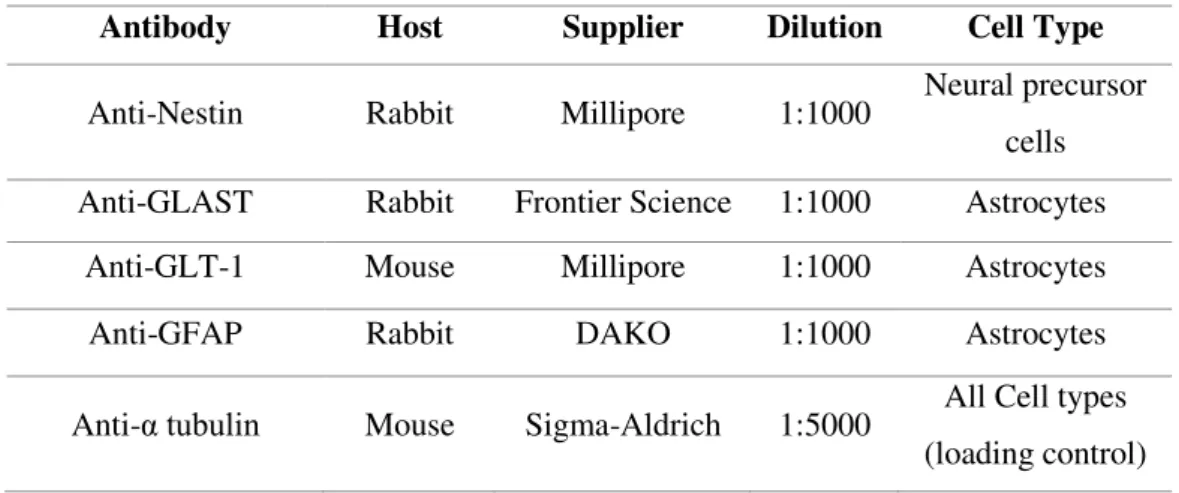
Table 2.4 - List of primary antibodies used for immunofluorescence microscopy.Antibody Host Supplier Dilution Cell Type
Anti-Nestin Rabbit Millipore 1:200 Neural precursor cells
Anti-Sox2 Rabbit Millipore 1:200 Neural precursor cells
Anti-Vimentin Mouse Sigma-Aldrich 1:200 Neural precursor cells
Anti-Ki-67 Mouse Millipore 1:200 Proliferating cells
Anti-βIII-tubulin Mouse Millipore 1:200 Neurons
Anti-Synaptophysin Mouse Millipore 1:200 Neurons
Anti-MAP-2 Chicken Abcam 1:10 000 Neurons
Anti-TH Rabbit Santa Cruz 1:200 Neurons
Anti-vGlut1 Rabbit Abcam 1:200 Neurons
Anti-ChAT Mouse Millipore 1:200 Neurons
Anti-GAD 65&67 Rabbit Millipore 1:200 Neurons
Anti-GLAST Rabbit Frontier Science 1:500 Astrocytes
Anti-GLT-1 Mouse Millipore 1:200 Astrocytes
Anti-GFAP Rabbit Millipore 1:200 Astrocytes
Coverslips were washed two times in PBS and then incubated for 1 h, at room temperature,
in the dark with fluorescently labeled secondary antibody (AlexaFluor 488 goat anti-mouse IgG,
AlexaFluor 594 goat anti-chicken IgY or AlexaFluor 594 goat anti-rabbit IgG, Life
Technologies) diluted 1:500 in 0.125 % (w/v) FSG in PBS. After 2 washes with PBS, nuclei
were counterstained with DAPI and/or DRAQ5 (both from Life Technologies). Coverslips were
mounted in ProLong Gold antifade reagent with DAPI (Life Technologies). Preparations of 2D
cultures were visualized using a fluorescence microscope (DMI6000, Leica), while preparations
of 3D cultures were visualized in point scan confocal microscope (SP5, Leica). The obtained
images were processed using ImageJ software (version 1.49g) and only linear manipulations
were performed. For cell quantifications, the number of positively labeled cells was quantified
by counting 4 to 5 randomly selected fields of approximately 100 cells or 4 to 5 neurospheres of
at least two independent experiments.
2.5.3.Western blot analysis
Cells were collected and sedimented by centrifugation at 500x g for 5 minutes, room
temperature. Resultant pellet was snap-freezed by immersion in liquid nitrogen and stored at -80
ºC until protein extraction. For protein extraction, 100 µL of Lysis buffer (50 mM Tris, 5 mM
EDTA, 150 mM NaCl, 1 % TX-100 (w/v) and 1X complete protease inhibitors cocktail (Roche)
19
separate cell debris from solubilized proteins, extracts were centrifuged for 15 min at 15 000x g
at 4 ºC.
Total protein was quantified using Micro BCA Protein Assay Kit (Pierce), according to
manufacturer’s instructions. Quantification was based in reference to absorbance values
obtained by Infinite® 200Pro (TECAN) at 562 nm for standard BSA solutions with known
concentrations up to 100 µg/mL.
Proteins were then precipitated by overnight incubation in ethanol at a final concentration of
80 % and sedimented by centrifugation at 15000x g for 15 min. Supernatant was discarded and
protein pellet was solubilized in NuPAGE sample buffer with reducing agent (Life
Technologies). Samples were heated at 70 °C for 10 min and resolved on a NuPAGE Bis-Tris
gel (Life Technologies) with MES as running buffer (Life Technologies), at 200 V for 45 min.
Transference of gel proteins into a polyvinylidene difluoride (PVDF) membrane was performed
in iBlot dry system (Life Tecnologies) for 7 min according to manufacturer’s instructions.
Membranes were blocked for at least 1 h at room temperature with Tris-buffered saline with 0.1
% (w/v) Tween 20 (TPBS) and 5 % non-fat dried milk powder (blocking solution). Membranes
were then incubated with primary antibodies (Table 2.5) overnight under constant gentle
agitation, at room temperature, diluted in blocking solution with 0.1 % sodium azide.
Table 2.5 - List of primary antibodies used for Western blot protein detection.
Antibody Host Supplier Dilution Cell Type
Anti-Nestin Rabbit Millipore 1:1000 Neural precursor cells
Anti-GLAST Rabbit Frontier Science 1:1000 Astrocytes
Anti-GLT-1 Mouse Millipore 1:1000 Astrocytes
Anti-GFAP Rabbit DAKO 1:1000 Astrocytes
Anti-α tubulin Mouse Sigma-Aldrich 1:5000 All Cell types (loading control)
After 4 washes with TPBS buffer for 5 min, membranes were incubated with horseradish
peroxidase-coupled ECL secondary antibody anti-rabbit IgG or anti-mouse IgG (GE Healthcare)
diluted 1:5000 in blocking solution, for 2 h, at room temperature. Chemiluminescence detection
was performed by incubating the membranes with Amersham ECL Prime Western blotting
detection reagent (GE Healthcare) and analyzed under ChemiDoc XRS System (Bio-Rad). For
stripping, membranes were incubated twice with mild stripping buffer (15 g/L glycine, 1 g/L
20
washes with TPBS for 5 min. Membranes were then incubated with a different primary antibody
in blocking solution and 0.1 % sodium azide.
2.5.4.Real-time quantitative polymerase chain reaction (RT-qPCR)
Cells were collected and sedimented by centrifugation at 500x g for 5 min, room temperature. Resultant pellet was snap-freezed by immersion in liquid nitrogen and stored at -80
ºC until RNA extraction.
RNA extraction was performed using High Pure RNA Isolation Kit (Roche) according to
manufacturer’s instructions. The resultant RNA was quantified by NanoDrop 2000c (Thermo
Scientific) and used directly for cDNA synthesis. For cDNA synthesis, the concentrations of all
RNA samples were normalized by dilution in sterile deionized water. cDNA synthesis was
performed using Transcriptor High Fidelity cDNA Synthesis Kit (Roche) which contains the
Anchored-oligo(dT)18 Primer that is bound to Poly-A chain after denaturation of RNA for 10
min at 65 ºC. Reverse transcriptase reaction occurred for 30 min at 55 ºC and enzyme
inactivation at 85 ºC for 5 min, stopping the reaction. cDNA was quantified in NanoDrop 2000c
(Thermo Scientific) and directly used for RT-qPCR or stored at -20 °C.
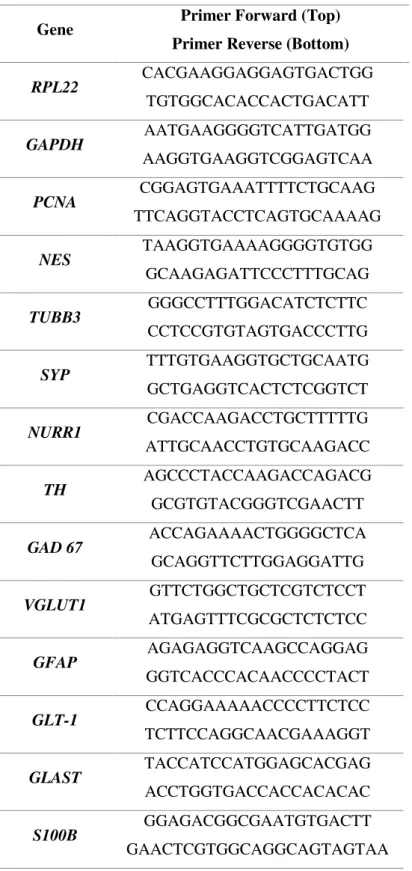
RT-qPCR was performed according to LightCycler 480 SYBR Green I Master Kit (Roche),
in 20 μL reactions with 1:2 diluted cDNA template and 5 μM primers (Table 2.6), in triplicates.
Reaction mix and cDNA were loaded in white 96-well plates, always maintaining reagents and
plates on ice. qPCR reactions were performed using LightCycler 480 Instrument II 96-well
block (Roche). Cycle threshold (Ct) and melting curves were determined using LightCycler 480
Software version 1.5 (Roche). All data was analyzed using the 2-ΔΔCt method for relative gene
expression analysis (Livak & Schmittgen 2001). Changes in gene expression were normalized
using the housekeeping gene RPL22 (encoding for ribosomal protein L22) as internal control in 2D cultures and RPL22 and GAPDH (encoding for glyceraldehyde 3-phosphate dehydrogenase)