João Diogo da Silva Aguiar
Licenciado em Conservação e Restauro
Analysis, Testing and Development of Safe
Cleaning Methods of Rusted Stone Material
Dissertação para obtenção do Grau de Mestre em
Conservação e Restauro
Orientador:
Susanna Bracci, Doutora,
ICVBC – CNR, Firenze
Co-orientador:
Barbara Salvadori, Doutora,
ICVBC – CNR, Firenze
Co-orientador:
Barbara Sacchi, Doutora,
ICVBC – CNR, Firenze
Júri:
Presidente: Professora Doutora Maria João Melo
Arguente: Professora Doutora Amélia Dionísio
New University of Lisbon
Faculty of Science and Technology
Department of Conservation and Restoration
Analysis, Testing and Development of Safe
Cleaning Methods of Rusted Stone Material
João Diogo da Silva Aguiar
Master thesis in Conservation and Restoration
Specialization area: Conservation and Restoration
Supervisor:
Susanna Bracci
Co-supervisors:
Barbara Salvadori
Barbara Sacchi
II
Analysis, Testing and Development of Safe Cleaning Methods of Rusted Stone Material
Copyright © 2014
João Diogo da Silva Aguiar
Faculdade de Ciências e Tecnologia Universidade Nova de Lisboa
III
Acknowledgments
First of all, I would like to thank my supervisor, Dr. Susanna Bracci, for all the help, knowledge, motivation and time during the period of the internship. In the second place I would like to thank my co-supervisors, Dr. Barbara Salvadori and Dr. Barbara Sacchi, for the availability and support in the preparation of this dissertation. Thanks to Dr. Emma Cantisani, for the help in the XRD analysis.
I am also grateful to Professor Maria João Melo for the opportunity and confidence in me. I would also like to thank Luís Relva for helping with the revision of the English text.
Thanks also to all those who are part of the team at "Istituto per la la Conservazione and Valorizzazione dei Beni Culturali", for the companionship and help, specially to Pablo Guerra, Alice Trillice Mosconi and Silvia Vettori.
Last but not least, I would like to thank all my family, in particular my mother and sisters for all the support in this period, which has been one of the hardest but also most rewarding phases of my life; to my girlfriend, Ana Sofia, for all the help and for having accepted and encouraged me to fight for my dreams. I also want to thank my friends in Portugal who motivated me and gave me strength to embrace this new adventure, especially to Joana Teixeira, Ana Mónica Silva, Fábio Vasconcelos, Joana Dias, Sara Santos, Telma Vieira, Francisco Ferreira, Carmen Bettencourt and Nuno Alves.
The completion of this thesis would not have been possible without the help of all those who were present in my life during my stay in Florence, as well as the ones who remained in Portugal.
V
Abstract
Three different treatments were applied on several specimens of dolomitic and calcitic marble, properly stained with rust to mimic real situations (the stone specimens were exposed to the natural environment for about six months in contact with rusted iron). Thirty six marble specimens, eighteen calcitic and eighteen dolomitic, were characterized before and after treatment and monitored throughout the cleaning tests. The specimens were characterized by SEM-EDS (Scanning Electron Microscopy coupled with Energy Dispersion System), XRD (X-Ray Diffraction), XRF (X-(X-Ray Fluorescence), FTIR (Fourier Transform Infrared Spectroscopy) and color measurements. It was also made a microscopic and macroscopic analysis of the stone surface along with the tests of short and long term capillary absorption.
A series of test trials were conducted in order to understand which concentrations and contact times best suits to this purpose, to confirm what had been written to date in the literature. We sought to develop new methods of treatment application, skipping the usual methods of applying chemical treatments on stone substrates, with the use of cellulose poultice, resorting to the agar, a gel already used in many other areas, being something new in this area, which possesses great applicability in the field of conservation of stone materials.
After the application of the best methodology for cleaning, specimens were characterized again in order to understand which treatment was more effective and less harmful, both for the operator and the stone material. Very briefly conclusions were that for a very intense and deep penetration into the stone, a solution of 3.5% of SDT buffered with ammonium carbonate to pH around 7 applied with agar support would be indicated. For rust stains in its initial state, the use of Ammonium citrate at a concentration of 5% buffered with ammonium to pH 7 could be applied more than once until satisfactory results appear.
VII
Resumo
Três tratamentos diferentes foram aplicados em vários provetes de mármore dolomítico e calcítico, com manchas de ferrugem tal como acontece em situações reais (os provetes foram expostos à intempérie durante cerca de seis meses em contacto com ferro enferrujado). Trinta e seis provetes, dezoito de calcite e dezoito de dolomite foram caracterizados antes e após os tratamentos e monitorizados durante os testes de limpeza. As amostras foram caracterizadas por SEM-EDS, XRD, FTIR, e medições de cor. Além disto, foi também realizada uma análise microscópica e macroscópica da superfície do material pétreo. Por fim realizou-se ainda um teste de absorção por capilaridade de curta e longa duração.
Realizou-se vários ensaios com o objetivo de compreender que concentrações e tempos de contacto seriam as mais indicadas para este fim, confirmando igualmente com o que existia escrito até ao momento sobre esta temática.
Procurou-se desenvolver novos métodos de aplicação dos tratamentos, ignorando os métodos usuais de aplicação de tratamentos químicos sobre substratos de pedra, que normalmente recorrem à pasta de celulose. O agar surgiu como uma alternativa, sendo um gel já utilizado em muitas outras áreas, contudo, é algo novo neste campo, mas que possuí grande aplicabilidade na área de conservação e restauro de materiais pétreos.
Após a realização dos tratamentos de limpeza verificou-se novamente as análises de caracterização de modo a perceber qual o tratamento que era mais vantajoso para o operador e para o material pétreo. Chegou-se à conclusão que o tratamento ideal para manchas muito intensas e com grande penetração na pedra será usar uma solução de 3.5% de SDT ajustando a um pH 7 com carbonato de amónia, com aplicação através de gel de agar. Para manchas de ferrugem no seu estado inicial, é indicada a utilização de citrato de amónia a uma concentração de 5% ajustando a um pH 7 com uma solução de amónia, sendo aplicado com um gel de agar.
IX
Index of contents
Acknowledgments
... III
Abstract
... V
Resumo
... VII
Index of contents
... IX
Index of Figures
... XI
Index of Tables
... XIII
Symbols and Abbreviations
... XV
1.
Introduction
... 1
1.1 Preamble ... 1
1.2 . Calcitic: [CaCO3] and Dolomitic: [CaMg(CO3)2] marbles ... 2
1.3 Rust formation ... 2
1.4 Proposed treatments ... 3
1.4.1 Sodium Dithionite ... 4
1.4.2 Sodium Hexametaphosphate ... 4
1.4.3 Ammonium Citrate ... 5
2.
Experimental Design
... 7
2.1 Specimens ... 7
2.2 Characterization of the specimens before treatment ... 8
2.3 Application of treatments ... 8
2.4 Characterization of the specimens after the treatment ... 10
3.
Results and Discussion
... 11
3.1 Specimens characterization ... 11
3.2 Rust stain characterization ... 15
3.3 Chemical treatments ... 16
3.3.1 Sodium dithionite ... 16
3.3.2 Sodium Hexametaphosphate ... 22
3.3.3 Ammonium Citrate ... 24
3.4 Comparison of water absorption tests (before and after) ... 27
4.
Conclusions
... 29
XI
Index of Figures
Figure 1. Experimental design. ... 7
Figure 2. Specimen measurements. ... 7
Figure 3. Values of the L*, a* and b* chromatic coordinates corresponding to the 2 different specimens (C1 and C17, respectively). ... 11
Figure 4. Values of the L*, a* and b* chromatic coordinates corresponding to the 2 different specimens (D2 and D17, respectively). ... 12
Figure 5. One minutewater absorption g/cm2 A) Calcite B) Dolomite. ... 13
Figure 6. Long term water absorption g/cm2. A) Calcite B) Dolomite. ... 13
Figure 7. XRF spectra of A) specimen C1 point 1 and B) specimen D1 point 1. ... 13
Figure 8. Diffractogram of CaCO3 specimen (──) vs standard CaCO3 diffractogram (──). .... 14
Figure 9. Diffractogram of Mg(CaCO3) specimen (──) vs standard Mg(CaCO3) diffractogram (──) vs standard CaCO3 diffractogram (──). ... 14
Figure 10. A) Surface photograph specimen D1 B) Optical microscope specimen D1. ... 15
Figure 11. A) Surface photograph specimen C7 B) Optical microscope specimen C7. ... 15
Figure 12. A) Cross-section specimen C15 B) Cross-section specimen D15. ... 16
Figure 13. SEM-EDS A) specimen C8 B) specimen D3. ... 16
Figure 14. Comparison between treatments A) SDT 3.5% - 6 hours B) SDT 7% - 3 hours. ... 17
Figure 15. Infrared spectra (──) SDT 7% poultice powder buffered with sodium hydrogen carbonate (──) and sodium sulphate pattern. ... 18
Figure 16. Values of the L*, a* and b* chromatic coordinates corresponding to the 2 different specimens (C3 and C18, respectively). ... 19
Figure 17. Values of the L*, a* and b* chromatic coordinates corresponding to the 2 different specimens (D1 and D16, respectively). ... 19
Figure 19. Timeline SDT 3.5% with agar poultice. ... 20
Figure 18. XRF spectra of A) specimen C1 point 1 and B) specimen D1 point 1. ... 20
Figure 20. Before and after SDT 3.5% with agar poultice C6-D6 specimens. ... 21
Figure 21. Infrared spectra (──) agar poultice powder SDT 3.5% buffered with ammonium carbonate (──), ammonium sulphate pattern (──) and sodium sulphate pattern. ... 21
Figure 22. XRF spectra of A) specimen D1 point 1 and B) specimen D5 point 1. ... 22
Figure 23. Before and AfterSodium Hexametaphosfate 10% C7 - D7 specimens. ... 22
Figure 24. Values of the L*, a* and b* chromatic coordinates corresponding to the 2 different specimens (C7 and C17, respectively). ... 23
XII
Figure 26. XRF spectra of A) specimen D7 point 1 before treatment and B) specimen D7 point 1 after treatment. ... 24
Figure 27. Comparison between treatments A) 2% - 24 hours B) 5% - 24 hours. ... 25
Figure 28. Values of the L*, a* and b* chromatic coordinates corresponding to the 2 different specimens (C9 and C16, respectively). ... 25
Figure 29. Values of the L*, a* and b* chromatic coordinates corresponding to the 2 different specimens (D9 and D17, respectively). ... 26
Figure 30. XRF spectra of A) specimen D7 point 1 before treatment and B) specimen D7 point 1 after treatment. ... 26
Figure 31. One minute water absorption g/cm2 - before and after - A) Calcitic marble B) Dolomitic marble. ... 27
Figure 32. Long term water absorption g/cm2. – before and after - Calcite. ... 28 Figure 33. Long term water absorption g/cm2.- before and after – Dolomite. ... 28 Figure 34. Template for XRF analysis . ... A.6
Figure 35. Template for the color measurments. ... A.7
XIII
Index of Tables
Table 1. Constants of dissolution of Ca2+, Fe2+ and Fe3+ [3]. ... 3
Table 2. Treatments applied. ... 8
Table 3: Color measurements of the stained and unstained calcitic specimens. ... 11
Table 4: Color measurements of the stained and unstained dolomitic specimens. ... 12
Table 5. Color measurements of the cleaned and unstained calcitic specimens. ... 18
Table 6. Color measurements of the cleaned and unstained dolomitic specimens. ... 19
Table 7. Color measurements of the cleaned and unstained calcitic specimens. ... 23
Table 8. Color measurements of the cleaned and unstained dolomitic specimens. ... 23
Table 9. Color measurements of the cleaned and unstained calcitic specimens. ... 25
Table 10. Color measurements of the cleaned and unstained dolomitic specimens ... 26
Table 11. List of previous treatments on rust removal. ... A.2
Table 12. Distribution of specimens according to the treatment. ... A.3
Table 13. Function of the specimens. ... A.3
Table 14. Trials table ... A.9
Table 15. Summary table - Calcite ... A.11
XV
Symbols and Abbreviations
SDT Sodium dithionite = Sodium hydrosulfite – Na
2S
2O
4AC Ammonium Citrate – C
6H
17N
3O
7D Dolomitic Specimen
C Calcitic Specimen
XRD X-Ray Diffraction
SEM-EDS Scanning Electron Microscopy coupled with Energy
Dispersive microscope
XRF X-Ray Fluorescence
FTIR
ATR
Fourier Transform Infrared Spectroscopy
Attenuated Total reflectance
1
1.
Introduction
1.1 Preamble
Ever since the Greek – Roman period, to the modern and actual period, white marbles, calcitic and dolomitic ones, have been widely used nearly in every major city in the world to construct monumental buildings, architectural facades, fountains, bridges, aqueducts and sculptures [1, 2, 3].
Despite the stone material resistance, the alteration of these materials is inevitable over time. The stone condition depends not only of its properties but mainly from external agents that can cause alteration, damage, decay, deterioration and weathering. This agents can be chemicals (such as, acid rains, pollution), environmental (such as, humidity, rain), biological (biological colonization) or due to external interventions (such as, products applied on stone in past restorations processes) [3, 4].
Amongst the huge set of mechanisms and agents of decay of the stone material in monuments, one can identify staining due to the contact with metals. These stains are one of the most challenging problems for cleaning since the products causing staining are not soluble in water [5, 6, 7]. Two of the most common stains are caused by contact with both copper and iron materials. The origin of copper-based staining is commonly linked to the corrosion of the bronze materials that are in contact with the stone, such as sculptures [8]. The second one is normally linked to the rusting of the architectonic elements such as grades, nails and supports [5]. The resolution of this last pathology represents the main issue of this dissertation.
The solution for this pathology should foresee a methodology, which can be controlled throughout the whole process of treatment. This procedure should be respected carefully in order to prevent physical and / or chemical changes in the stone material, such as abrasion of the surface and introduction of soluble salts [8, 9].
The main reason for the cleaning of iron stains rely on aesthetical reasons, giving a better visual appearance to the material, but above all, an effective cleaning intend to promote the stability of the object [7].
2
Electron Microscopy coupled with Energy Dispersive Microscopy (SEM-EDS), X-Ray Fluorescence (XRF), Fourier Transform Infrared Spectroscopy (FT-IR) in both reflectance and transmission mode, microscopic and macroscopic documentation of the surface, color measurements, short- and long-term capillary absorption according to EN 15801 standard [33]. The characterization was carried out before and after treatments. Advantages and disadvantages of the cleaning products were thus highlighted, having always in mind that the treatment should meet certain requirements including safety, efficiency, non-harmfulness for the stone, absence of undesired by-products and applicability to real cases by restorers.1.2. Calcitic: [CaCO
3] and Dolomitic: [CaMg(CO
3)
2] marbles
The calcitic mineral is presented as having a rhombohedral (or trigonal) crystalline system, whereas the dolomitic mineral has a orthorhombic crystalline system. [8, 10, 11].
The calcite presents a perfect cleavage, with a hardness of 3 in Mohs`s scale, being represented normally in white. One fundamental aspect of the calcite is that the calcium ions present in the calcite are easily dissolved with acid [8]. According to its purity, it can present other compounds, such as Magnesium (Mg). When the ratio between the Mg and the Ca is about 50%, it is known as dolomite and it is less sensitive to corrosion by action of acids [10, 11].
1.3 Rust formation
Rust is formed when there is a source of iron and humidity big enough, so that the process of corrosion begins [7]. In a stone material, the origin of the rust stains can have the most varied origin. For instance, they may originate from elements used in building itself, such as grades, nails, supports, or even iron minerals present in the matrix of the stone, due to the process of formation of the stone material. As time goes by, these iron minerals can oxidize, with the presence of water, creating iron stains [5, 11, 12].
The fact that both stone and iron materials are exposed to rains creates ideal conditions for rust formation. With relative humidity above 65% iron dissolution is promoted, thus forming Fe2+
(colorless) and two free electron as shown in reaction (eq. 1), which is white in color or colorless [13, 14]. The formed electron and proton (H+) will react with FeOOH (formed with
iron, water and oxygen) to form Fe3O4 rust via reaction (eq. 2). Also, the Fe3O4 rust is generated
by the reaction of the dissolved Fe2+ with FeOOH rust (eq. 3). Totally, the formation of Fe 3O4
can be represented as reaction (eq. 4), creating the red/brownish stains typical of this oxidation product [7, 12, 13].
Fe → Fe2+ + 2e- (eq. 1)
3FeOOH + H+ + e- → Fe
3
2FeOOH + Fe2+ → Fe3O4 + 2H+ (eq. 3)
Fe2+ + 8FeOOH + 2e-→ 3Fe
3O4 + 4H2O (eq. 4)
1.4 Proposed treatments
Studies about this argument are not recent and a clear definition of a good treatment is not still defined [3]. A list of the treatments previously studied is reported in Appendix 1. After a revision of these treatments, it was concluded that in the best treatments for marbles the pH has been adjusted to pH 7-8, being this the fundamental point to avoid the dissolution of the calcite [3]. Besides the pH, another factor to be controlled is the contact time between the sample and the poultice: it should not be too long, to allow the operator to observe the results of the treatment [9].
Because of the insolubility in water, iron stains could be difficult to remove [5, 15]. The removal of this kind of stains may be performed by dissolving them in acids, by complexation, and chemical reduction with or without complexing agents [16]. Chelating agents will complex the metal ion facilitating its removal [7, 16]. It is important to use the appropriate chelating agent to avoid the dissolution of the calcite. In order to achieve that, it is necessary to observe the constants of dissolution of the stone material [3]. On table 1, the constant of dissolution of the Ca2+ is reported, as well as the Fe2+ and Fe3+. The Fe2+ and Fe3+ ions have higher constants
than the Ca2+ ion, making possible to remove the iron oxides without damaging the marble. In
this table, it is possible to observe the solubility constants of the more common chelating agents in conservation and restoration. It is also possible to see that the EDTA is a very strong agent and it will dissolve the stone substratum. At the same time, the citrate will not theoretically make any damage on the stone substrate, but it will also have less power of action on the iron stains [3].
Table 1. Constants of dissolution of Ca2+, Fe2+ and Fe3+ [3].
pKsp* Kf, Citrate Kf EDTA
Ca2+ 8.35 4.68 11.0
Fe2+ 14.43 3.08 14.33
Fe3+ 37.4 12.5 24.23
Reducing agents can be used, to convert Fe3+ to Fe2+, removing thus the iron stain by washing it
with water. When deciding to use a reducing agent, it is necessary to take into account the potential of reduction of Fe3+ (which is +0.77V), while the reducing agent should present a
4
effective washing of the stone surface should be taken, in order to avoid residual iron (II) ions on the stone which, after re-oxidation to Fe3+, may again create new staining[7, 15, 17].1.4.1 Sodium Dithionite
One of the cleaning agents chosen was sodium dithionite, Na2S2O4, widely used in the industry
for its reductive properties, such as in the dying of indigo and in the stripping of dyed fabrics and fibers. It is also used in the clay industry as whitening agent and in the removal of metal impurities and in the making of paper, functioning as a bleaching of yellowed fibers of cellulose, basic component of paper [7, 15, 18].
This product, in the field of conservation and restoration, is used to reduce Fe3+ of iron stains
from various materials to Fe2+, this latter being more soluble in water that can be removed more
easily. This product has been used in the removal of rust stains from a great variety of inorganic materials, including clay, stone and minerals [7]. The first person to note this fact and to recommend its use in the removal of iron stains in marble was Stambolov in 1968 [19].
Since goethite (one of the most common forms of rust) has lower solubility than Fe(OH)2 (10-41
against 10-15), it is necessary to use a reducing agent, in order to remove the iron oxide [7]. With
the purpose of understanding how reduction works, from Fe3+ to Fe2+,it is important to observe
the reaction of the dithionite ion (S2O42-) with the Fe3+ at slightly acid pH [14]:
2FeOOH + S2O42+ + 4H+ → 2Fe2+ + 2HSO3- + 2H2O (eq. 5)
One of the facts to take into account is the decomposition of sodium dithionite in solution, causing the acidification of the pH, which can dissolve the stone substrate. In order to avoid this, a buffered solution should be used (i.e. sodium bicarbonate), to keep the pH of the solution between 6/7 during the longest period of time possible [20, 21].
1.4.2 Sodium Hexametaphosphate
5
1.4.3 Ammonium Citrate
Organic acids due to their non-toxicity have played an important role in the field of conservation and restoration. In this case, they were considered as being effective to remove rust stains almost forty years ago. Despite the popularity of the ammonium citrate, its use, in the cleaning of monuments/sculptures of stone is very recent [24].
Some publications report ammonium citrate as effective in removing two types of dirt: dirt on limestone of Egyptian statues, medallions of French stone from the XVIII century and removal of iron stains in the case of the Metropolitan Club building in New York, as well as in the Temple of Love on Long Island [5, 24].
The efficiency of the ammonium citrate as a cleaning agent is due to its chelating properties; indeed, the citrate is able to complex various metals [15]. This is evident when observing the constant of formation (Kf) of the metal-citrate: Cu(II) > Fe(III) > Al (III) > Pb (II) > Zn (II) >
Ni(II) > Co(II) > Cd(II) > Mn(II) > Mg(II) > Ca(II) > Fe(II) > Sr(II) > Ba(II). The values of the citrate with Fe(III), Ca(II) and Fe(II) are 12.5, 4.7 and 3.1 respectively [3, 24].
As shown in Table 1, the pKsp of Fe(III) is about 37.4, meaning that AC should have some
difficulty in the complexation of Fe(III); the complexation of Fe(III), could be due to the counter-ion ammonia, which is known for being a good chelating as independent agent, for example, when used to complex copper [24].
7
2.
Experimental Design
The experimental design developed is divided essentially in three parts, as reported in the Figure 1. The description of all reagents, experimental methods and equipment used is reported in Appendix 2.
2.1 Specimens
Two types of marble were used, one dolomitic and the other calcitic with the dimensions of 5x5x2cm as shown in Figure 2. These
samples were left in the open air, exposed to the natural environment for about six months in contact with rusted iron. In these conditions they get rusty as natural as possible, exactly as if it happens in a building. Before analyzing them, specimens were washed in order to remove extraneous materials from the surface, leaving only the rust stains penetrated in the stone material.
Rusted Calcitic specimens Rusted Dolomitic specimens
Characterization before treatment
Chemical treatments
Sodium dithionite Sodium Hexametaphosphate Ammonium citrate
Characterization after treatment
Comparisonbetween before and
after the chemical treatment
Figure 1. Experimental design.
Figure 2. Specimen measurements.
Colorimetry XRF Stereo Microscope Cross-section
Water absorption XRD Surface photographs SEM-EDS
Colorimetry XRF Stereo Microscope
8
The total number of specimens used in this experiment was 36 excluding those used in the trials for which the samples were only characterized through photography. For each type of marble a set of 18 specimens was selected. Each set was then divided among the treatments, but there was a leftover of three of each kind without rust so that they could serve as a reference. The distribution of these specimens according to the applied treatment is reported in Appendix 2.1.2.2 Characterization of the specimens before treatment
In order to do this work there was a necessity of characterizing the specimens before the application of the cleaning treatment to gather a set of information for characterizing the state of the stone substrate and, at the same time allowing the analysis of the rusty spots. The process of characterization started with color measurements, so that a reference of the initial state of the surface of the specimens existed. This experimental essay process is described in Appendix 2.4. The preparation of the specimens for the stereo microscope was done afterwards, so that a comparison between the before and after treatment could be made. This experimental process is described in Appendix 2.4.
The characterization of the specimens involved SEM-EDS, XRF and XRD analysis, both to characterize the stone substrate and the kind of iron compounds present in the specimens. This experimental process and equipments used is described in Appendix 2.4.
2.3 Application of treatments
The treatments were applied according to the general guidelines reported in the literature. However, before applying the treatments in the characterized specimens, some preliminary tests were conducted in order to verify if the described conditions, such as, contact time and concentrations, could in fact, give the results presented in the bibliography. The obtained results by these trials are reported in the Appendix 3.
In order to identify the best concentrations and contact times, each cleaning agent was used with two different concentrations and two different contact times selected from the preliminary tests. Therefore it was possible to observe if a longer period with a lower concentration was better or worse than a lower period with a higher concentration. The experimental method can be found in the Appendix 2.2. In the table 2 the chosen treatments are reported.
Table 2. Treatments applied.
9
time
Sodium dithionite 3.5% 7%
3 hours
6 hours 6/7
Sodium
bicarbonate Cellulose
Hexametaphosphate 10% 2 hours 7 Ammonium 30% Cellulose
Ammonium Citrate 2%
5% 24 hours 8 Ammonium 30% Cellulose
After carrying out the first set of treatment using cellulose as support, the use of agar as poultice was tested in order to improve the efficiency of treatments. Agar is a non-toxic material from organic raw materials, extracted from several types of red seaweeds. The product is made of two polysaccharides, agaropectin and agarose [25]. Due to its gelling properties, agar is applied in different fields of industry, such as, pharmacy, biology, food industry and chemistry. To exploit as much as possible of his gelling capabilities, the water should be heated up to 80ºC before adding agar. After this stage, it will progressively develop a random coil structure that will rearrange at the cooling stage forming a rigid gel [26].
For the field of conservation and restoration, the agar poultice can be prepared as a water-based poultice or with chemicals such as, chelating agents, to create gels characterized by a variable pH for the treatment of specific substrates. This gel will act like a sponge, draining all the material dissolved by the chemical used into the matrix of the agar [27].
The better thing about agar is that, depending on the situation, it could be applied on different ways, so, if the user wants to apply it by brush on a surface, just needs to apply it when the temperature is above 40ºC. If the user wants to use it as a thin film, just has to lay it down on a plastic film and let it rest until the temperature is under 40ºC. The removal at the end of the procedure is facilitated by the low adhesion to the substrate, and it leaves almost no residues on the surface [27].
The preparation of agar is not as easy as cellulose poultice, however if it is prepared in the proper way, better results can be obtained. This way of operation gives advantages to the operator; an example of the evolution of the treatment can be checked in the results part (Figure 19). The use of agar was tested with the Ammonium Citrate and with Sodium dithionite. In the case of Hexametaphosphate, the film of agar was not formed, since this cleaning agent acts as a deflocculant, not allowing the union of the agar fibers.
10
Sodium dithionite and Sodium hydrogen carbonate, the presence of sodium salts was observed. The alternative found to try to reduce the amount of salt was to use ammonium carbonate as a buffering agent.2.4 Characterization of the specimens after the treatment
11
3.
Results and Discussion
3.1 Specimens characterization
The color measurements revealed what was already possible to observe through a naked eye. The specimens present in general a high level of red and yellow. The Table 3 and 4 present the average value for L*, a* and b* related to stained (C1 and D2) and unstained (C17 and D17) specimens. Lightness L* values range from L*=0 (black) to L*=100 (white). The value a* covers the red-green range. Values of a*>0 represent the red component while values of a*<0 represent green. The yellow-blue range is covered by the value of b*, b*>0 represent yellow while b*<0 represent blue [28, 29, 30].
In this case, it is possible to denote a slight dimming when the color of specimen C1 is compared with that of C17. A positive increase in the values of a* and b* when compared with the non-stained one, means that the surface has acquired stronger tones of red and yellow. The two values of a* and b* is translated into a deep orange coloration.
In Figure 3, the values are presented in the Table 3, relating to the points analyzed in this specimen which corresponds to calcite stone material, comparing them with specimen that serves as reference (not stained), on the right.
Table 3:
Color measurements of the stained and unstained calcitic specimens.
Stained calcitic specimens Unstained calcitic specimensSpecimen - Point L* a* b* Specimen – Point L* a* b*
C1 - 1 79,34 0,51 12,99 C17 – 1 82,74 -0,70 -0,86
C1 - 2 74,48 4,69 29,27 C17 – 2 81,90 -0,78 -0,47
C1 - 3 75,02 3,96 24,49 C17 – 3 81,97 -0,61 -0,88
C1 - 4 75,66 2,95 26,26 C17 – 4 80,50 -0,72 -0,03
Figure 3. Values of the L*, a* and b* chromatic coordinates corresponding to the 2 different
12
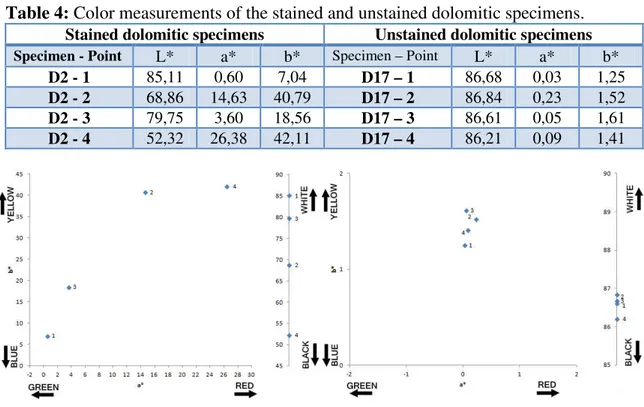
In the cases of the dolomitic specimens, rust coloration is stronger and deeper in respect to the previous one, the values are around in most cases to L* 50-70, a* 10-20 and b*20-40.Table 4:
Color measurements of the stained and unstained dolomitic specimens.
Stained dolomitic specimens Unstained dolomitic specimensSpecimen - Point L* a* b* Specimen – Point L* a* b*
D2 - 1 85,11 0,60 7,04 D17 – 1 86,68 0,03 1,25
D2 - 2 68,86 14,63 40,79 D17 – 2 86,84 0,23 1,52
D2 - 3 79,75 3,60 18,56 D17 – 3 86,61 0,05 1,61
D2 - 4 52,32 26,38 42,11 D17 – 4 86,21 0,09 1,41
It is possible to verify in the two figures above that the one on the left side is darker than the one on the right side, with L* lower than 85, whereas in the reference specimen the L* values are above 86. In the case of green/red levels, it is visible that the values tend to the red color, while in the reference specimen, they are around 0. In the blue/yellow levels, in the rusted one, these tend to yellow, whereas in the reference specimen, the value is again around zero.
A water absorption test was made in order to understand the porous behavior of the stone material. This is a helpful tool to evaluate if the treatments applied changed the porosity of the stone material [31]. The test was conducted using two different methods: i) short period of contact time, 1 minute measurements; ii) the long contact time. Despite all the care taken, some of the values presented in the first absorption test present a slight difference between them; this could be due different porosity of the stones or some external defect on the measurements such as temperature or humidity. In the Figure 5 the values for calcitic and dolomitic stones respectively are presented.
Figure 4. Values of the L*, a* and b* chromatic coordinates corresponding to the 2 different
13
The long term absorption revealed what was expected. The calcite specimens (Figure 6-A) absorbed a lightly lower amount of water respect the dolomitic stone (Figure 6-B).Xrf was conducted to evaluate the elements present in the stone substrate.
2 4 6 8 10 12 14 16
0 1000 2000 3000 4000 5000 6000 7000 8000 9000 10000 11000 12000 Ca Kβ Ca Kα Fe Kα Int ens ity ( a. u. )
Energy (KeV) 2 4 6 8 10 12 14 16
0 1000 2000 3000 4000 5000 6000 Fe Kβ Ca Kβ Ca Kα Fe Kα Int ens ity ( a. u. ) Energy (KeV)
Figure 7. XRF spectra of A) specimen C1 point 1 and B) specimen D1 point 1.
A)
B)
Figure 6. Long term water absorption g/cm2. A) Calcite B) Dolomite.
Figure 5. One minutewater absorption g/cm2 A) Calcite B) Dolomite.
14
In Figure 7 peaks are shown corresponding to Calcium (calcitic specimen) and Calcium and Magnesium (dolomitic specimens) respectively. Through the analysis of the specimens by XRF, the presence of iron was qualitatively assessed (peak at about 6.40 keV), as well as calcium (3.70 keV), with a more intense peak since this is the main constituent material of the stone substrate. The Magnesium (Mg) was not possible to detect due to the equipment sensitivity. Through X-ray diffraction (XRD) it was possible to confirm that the constituent materials are calcite and dolomite ─ the XRD spectra are reported in Figures 8 and 9 respectively. The red line represents the specimens used in this work, while the blue line represents a pattern of calcitic material, used as reference in the database of the institution.Figure 8. Diffractogram of CaCO3 specimen (──) vs standard CaCO3 diffractogram (──).
The presence of dolomite (red line) was evident when compared with the dolomite diffraction pattern (blue line). Besides this, it is also displayed the reference diffractogram for calcite (in green). Moreover, the typical XRD pattern of calcite is also present, which has some peaks in common with the detected diffraction pattern of the mentioned sample of dolomite.
Despite the fact that the stone material analyzed contains rust, it has not been possible to detect the type of ferrous oxides present in the substrate. Even though, a small area of the specimen
Figure 9. Diffractogram of Mg(CaCO3) specimen (──) vs standard Mg(CaCO3) diffractogram
15
surface, where the presence of rust was abundant, had been removed in order to be milled and subsequently analyzed, the result obtained was the same; it wasn’t possible to detect any type of ferrous oxides.3.2 Rust stain characterization
Through observation under the stereo microscope and through photographs of the surface it is evident that rust stains have different intensities and different forms, and essentially circular predominant form. In Figure 11 the surface of specimen C7 at different magnification is reported. All the others specimens are reported in appendix 4.
Figure 10. A) Surface photograph specimen D1 B) Optical microscope specimen D1.
A)
B)
A)
Figure 11. A) Surface photograph specimen C7 B) Optical microscope specimen C7.
16
The penetration depth of rust staining it is greater for dolomite respect to calcite as can be seen from the observation of cross sections in Figure 12. Probably this is due to the slightly different porosity of the two stones different crystals dimension (larger for dolomite respect to calcite).Figure 12. A) Cross-section specimen C15 B) Cross-section specimen D15.
SEM analyses were not conclusive. All the samples analyzed by this technique revealed what is possible just a little amount of iron, possible represented in the whitish color in the stone surface.
Figure 13. SEM-EDS A) specimen C8 B) specimen D3.
3.3 Chemical treatments
3.3.1 Sodium dithionite
In Figure 12 the results of the sodium dithionite cleaning intervention are present. The surface cleaning was more efficient using 3.5% solution respect to 7% solution. The contact time and solution concentration was the key factor in the removal process. It was proved that is better to have a longer time of contact with lower concentration (6 hours and 3.5%), instead a shorter
17
time using higher concentration (3 hours and 7%) in the case of deep rust. In the superficial rust, presented essentially in the calcite specimens, the 3 hour treatment was sufficient and the complete cleaning was achieved. In Figure 14 it is possible to compare the different results for the two treatments.Figure 14. Comparison between treatments A) SDT 3.5% - 6 hours B) SDT 7% - 3 hours.
Another important factor was the buffer used. It is very important to use a buffer allowing stabilization of the pH for a long period of time, which is difficult in such solutions where the decomposition of the SDT is very fast. The pH was buffered for two reasons: i) pH ≈ 7 because the SDT is very reactive with oxygen if the pH is too low; ii) the dissolution of calcite is favored when the pH values is under 7.6 [3, 12]. It is advisable to achieve 7.6 pH value, seeking to maintain the pH of the solution without variation, which could lead to a greater dissolution of the stone material. Calcite is more sensitive to these variations in pH, while dolomite is less sensitive to pH changes. The buffer used was Sodium Carbonate and trough the stabilization of pH, it was possible to maintain stable the solution of SDT.
Although the treatments were effective, the evidence is that the most important factors are pH and the SDT, used product. The fact that the buffer used has sodium in its base, it is not very beneficial for the stone material due to its salts. The salt’s crystals inside the pores can generate stresses that can turn stone into powder [32]. After the removal of the treatment, the material remaining on the Japanese paper was analyzed by means of FTIR in transmittance mode (Figure 15), being evident the large amount of sodium sulfate.
18
50 100150 200
250 300
350
Wavenumber cm-1 20
40 60 80 100
T
rans
m
it
tanc
e [
%
]
Despite this, the analysis of the surface of the stone material by FTIR, did not revealed any sulfate. This confirms the importance of a good washing of the stone substrate after applying the treatment, not only because of possible total removal of cleaning agents still on the stony substrate, but also it allows the removal of the Fe2+ deposited on the sample surface.
Through repetition of colorimetric tests, it was possible to understand how the color of the specimens changed and how they were similar to standard specimens. In Table 5 and Table 6 the colorimetric data after cleaning compared with the standard specimens are reported. After the treatment, the recovery of the color was almost complete. The remaining results regarding color measurements performed in this treatment can be found in summary table in the appendix 4.
Table 5. Color measurements of the cleaned and unstained calcitic specimens.
Cleaned calcitic specimens Unstained calcitic specimens
Specimen - Point L* a* b* Specimen - Point L* a* b*
C3 - 1 81,57 -1,40 4,57 C18 - 1 82,94 -0,68 -0,93
C3 - 2 80,32 -1,45 4,88 C18 - 2 81,36 -0,70 -0,84
C3 - 3 81,85 -1,53 4,24 C18 - 3 79,54 -0,662 -0,98
C3 - 4 82,24 -1,28 2,86 C18 - 4 82,04 -0,66 -0,86
Figure 15. Infrared spectra (──) SDT 7% poultice powder buffered with sodium hydrogen carbonate
19
Figure 16. Values of the L*, a* and b* chromatic coordinates corresponding to the 2 different
specimens (C3 and C18, respectively).
Table 6. Color measurements of the cleaned and unstained dolomitic specimens.
Cleaned dolomitic specimens Unstained dolomitic specimens
Specimen - Point L* a* b* Specimen - Point L* a* b*
D1 - 1 87,04 -0,39 3,08 D16 - 1 87,61 0,13 1,46
D1 - 2 86,28 -0,43 7,71 D16 - 2 87,91 0,11 1,45
D1 - 3 85,95 -0,45 8,34 D16 - 3 87,55 0,15 1,59
D1 - 4 86,99 -0,55 6,38 D16 - 4 87,95 0,09 1,44
Figure 17. Values of the L*, a* and b* chromatic coordinates corresponding to the 2 different specimens
(D1 and D16, respectively).
20
By means of XRF, it was possible to assess that the signal of iron practically disappear in the case of calcite sample, while for dolomitic there is still a small signal, further confirming that for dolomite the removal of rust is more difficult.To improve the performances of the treatments, the use of a different support respect to traditional based poultice cellulose has been tested: the support chosen is agar using the same formulation previously tested: SDT + 3.5% sodium carbonate with a pH of around 7. By using this new material, the treatment had a greater power of stain absorption, due to the high absorption capacity of the agar; moreover, it was possible to follow in real time the cleaning process (thanks to the transparency of poultice), without the need to stir the poultice, consequently changing the treatment conditions. This change resulted in a decrease of almost half the time of contact between the stone material and poultice. Below there is a time-line of such treatment.
Figure 19. Timeline SDT 3.5% with agar poultice.
This treatment result in an effective cleaning of the stone material, thus confirming the qualities of this treatment with respect to the rust stains cleaning and also allowing full control of the treatment process.
A last improvement was tried in order to reduce the problem of sodium salts present in solution. It is not possible to reduce sodium deriving from SDT, but it is possible to act on buffer solution. This was obtained by using ammonium carbonate instead of sodium carbonate, used
21
in previous experimental procedures. Although some stains remained, these may be the result of poor contact between the surface and the poultice, since there were other patches of equal or even higher intensity removed. This can be seen in Figure 20 before and after for the two types of stone materials.Figure 20. Before and after SDT 3.5% with agar poultice C6-D6 specimens.
The change of buffer resulted in decreasing the salts in solution. When examining the residues present in agar, in attenuated total reflectance (ATR) mode, traces of ammonium sulfate were found. Together with this compound, traces of sodium sulfate were also encountered, due to the decomposition of sodium dithionite [7].
Figure 21. Infrared spectra (──) agar poultice powder SDT 3.5% buffered with ammonium carbonate
(──), ammonium sulphate pattern (──) and sodium sulphate pattern.
50 100
150 200
250 300
350
Wavenumber cm-20
40 60 80 10
T
rans
m
it
tanc
e
[%
22
Treatment repetition
Through XRF analysis was evident that in some cases the iron was still present, especially in dolomite stone. Therefore, the treatment that gave the best results in removing iron stains (SDT) was repeated. Samples chosen for this test were C5-D5 (agar poultice) and C1-D1 (cellulose poultice). The treatments were repeated in the same conditions as the previous.
After performing these treatments, XRF analysis was repeated in order to check if any improvement was made. In the Figure 22-A) the XRF spectrum for D1 sample treated with cellulose poultice + SDT/sodium carbonate is presented. Iron is almost absent, barely impossible to see in the spectra. The same happens in Figure 22-B, specimen D5 treated with the agar poultice + SDT/ammonium carbonate.
Figure 22. XRF spectra of A) specimen D1 point 1 and B) specimen D5 point 1.
3.3.2 Sodium Hexametaphosphate
The use of this cleaning agent, has not achieved the desired results. The pH of the solution was around 4/5, reason why a buffer was used, 30% ammonium solution was used to adjust the pH of the solution to about 7. The obtained results are reported in Figure 23.
2 4 6 8 10 12 14 16
0 1000 2000 3000 4000 5000 6000 7000 8000 9000 Ca Kβ Ca Kα Fe Kα Int ens ity ( a. u. ) Energy (KeV) 2 4 6 8 10 12 14 16
0 1000 2000 3000 4000 5000 6000 7000 8000 9000 Ca Kβ Ca Kα Fe Kα Int ens ity ( a. u. ) Energy (KeV)
A) B)
Figure 23. Before and After
23
The concentration used in this treatment was 10% with a contact time of 2 hours. The concentration of 5% was not used because it was found that by using higher concentration (10%), satisfactory results were not obtained and only the superficial rust was removed.An improvement to the treatment was tried by using agar poultice instead of cellulose poultice; however due to the hexametaphosphate deflocculants properties, it did not allow the typical agar gel from forming.
Table 7. Color measurements of the cleaned and unstained calcitic specimens.
Cleaned calcitic specimens Unstained calcitic specimens
Specimen - Point L* a* b* Specimen - Point L* a* b*
C7 - 1 81,62 -0,47 1,88 C17 - 1 82,74 -0,70 -0,86
C7 - 2 51,77 19,07 29,97 C17 - 2 81,90 -0,78 -0,47
C7 - 3 67,22 11,64 28,52 C17 - 3 81,97 -0,61 -0,88
C7 - 4 70,59 7,71 20,47 C17 - 4 80,50 -0,72 -0,03
Table 8. Color measurements of the cleaned and unstained dolomitic specimens.
Cleaned dolomitic specimens Unstained dolomitic specimens
Specimen - Point L* a* b* Specimen - Point L* a* b*
D7 - 1 82,55 0,77 9,77 D17 - 1 86,68 0,03 1,25
D7 - 2 48,33 26,72 38,64 D17 - 2 86,84 0,23 1,52
D7 - 3 55,57 23,11 41,42 D17 - 3 86,61 0,05 1,61
D7 - 4 58,02 22,39 42,65 D17 - 4 86,21 0,09 1,41
Figure 24. Values of the L*, a* and b* chromatic coordinates corresponding to the 2 different
24
Figure 25. Values of the L*, a* and b* chromatic coordinates corresponding to the 2 different
specimens (D7 and D17, respectively).
When the color measurements were made to prove what was seen in the surface photographs, the color only improved a little bit when compared with the reference specimens, as is possible to see in Figure 24 and Figure 25 and the Table 7 and Table 8.
Another analysis to confirm the fact that the orange color was still due to the presence of iron was the XRF, as is possible to see in Figure 26 where the spectra before and after treatment is showed for dolomitic specimen.
3.3.3 Ammonium Citrate
The results of the ammonium citrate cleaning intervention are presented in Figure 27. The surface cleaning was almost the same using either concentration of 2% or 5% solution. The contact time used in this case was longer compared to the other two treatments, but the results were completely not satisfying. The light colored yellow rust in the surface was removed, but the deep stains were not. The use of agar poultice instead the cellulose poultice did not improve the results.
2 4 6 8 10 12 14 16
0 1000 2000 3000 4000 5000 6000 7000 Fe Kβ Fe Kα Ca Kβ Ca Kα Int ens ity ( a. u. ) Energy (KeV)
2 4 6 8 10 12 14 16
0 1000 2000 3000 4000 5000 6000 7000 Fe Kβ Fe Kα Ca Kβ Ca Kα Int ens ity ( a. u. ) Energy (KeV)
Figure 26. XRF spectra of A) specimen D7 point 1 before treatment and B) specimen D7 point 1 after
treatment.
25
Figure 27. Comparison between treatments A) 2% - 24 hours B) 5% - 24 hours.
Color measurements proved what was seen in the surface photographs: the color only improved a little bit when compared with the reference specimens, as is possible to see in Figure 28 and Figure 29 and the Table 9 and Table 10.
Table 9. Color measurements of the cleaned and unstained calcitic specimens.
Cleaned calcitic specimens Unstained calcitic specimens
Specimen - Point L* a* b* Specimen - Point L* a* b*
C9 - 1 76,16 0,41 9,53 C16 - 1 82,85 -0,68 -1,15
C9 - 2 66,60 8,65 21,34 C16 - 2 83,33 -0,66 -0,89
C9 - 3 72,51 4,98 26,32 C16 - 3 83,30 -0,67 -0,85
C9 - 4 71,17 5,8 20,46 C16 - 4 84,10 -0,70 -1,07
Figure 28. Values of the L*, a* and b* chromatic coordinates corresponding to the 2 different specimens
(C9 and C16, respectively).
26
Table 10. Color measurements of the cleaned and unstained dolomitic specimens
Cleaned dolomitic specimens Unstained dolomitic specimens
Specimen - Point L* a* b* Specimen - Point L* a* b*
D9 - 1 73,77 8,87 32,59 D17 - 1 86,68 0,03 1,25
D9 - 2 59,01 21,36 42,42 D17 - 2 86,84 0,23 1,52
D9 - 3 70,12 15,79 43,09 D17 - 3 86,61 0,05 1,61
D9 - 4 70,09 14,05 39,45 D17 - 4 86,21 0,09 1,41
The confirmation of inadequate rust removal was confirmed by XRF, as is possible to see in Figure 30 where spectra before and after treatment are shown in a sample of dolomitic stone. In this case, it is possible to observe that the intensity of the iron signal is higher before than the after treatment.
2 4 6 8 10 12 14 16
0 1000 2000 3000 4000 5000 6000 7000 8000 9000 10000 11000 12000 Fe Kβ Fe Kα Ca Kβ Ca Kα Int ens ity ( a. u. ) Energy (KeV)
2 4 6 8 10 12 14 16
0 1000 2000 3000 4000 5000 6000 7000 Fe Kβ Fe Kα Ca Kβ Ca Kα Int ens ity ( a. u. ) Energy (KeV)
A) B)
Figure 29. Values of the L*, a* and b* chromatic coordinates corresponding to the 2 different
specimens (D9 and D17, respectively).
Figure 30. XRF spectra of A) specimen D7 point 1 before treatment and B) specimen D7 point 1
27
3.4 Comparison of water absorption tests (before and after)
After all the treatments were performed, the water absorption test was carried out. The short period of contact time when compared with the same test performed before the treatments did not shown conclusive data. Some of the values for the same treatment are different (in some cases, some specimens absorbed more after treatment and other less before treatment), as it is possible to conclude from Figure 31.
These unlikely results could be due to a great variety of external factors. In the case of long period of absorption time, the results obtained showed that the treatments affected the water absorption making it absorb less water than before the treatment. Despite this fact, one sample without rust (D18) was submitted to this test and it absorbed less water than the first time the test was performed. This could represent that some external factors can be behind this results such as: i) Relative humidity; ii) the process of excess water cleaning was not well removed; iii) Or the balance could have some mal function. The results are presented in the Figure 32 and Figure 33.
A)
B)
Figure 31. One minutewater absorption g/cm2 -before and after - A) Calcitic marble B)
28
Figure 32. Long term water absorption g/cm2. – before and after - Calcite.
29
4.
Conclusions
The study of a suitable, efficient and safe technique for the removal of rust from both calcitic and dolomitic marble was carried out. In order to achieve the objective, some promising chemical products reported in the literature were used, by exploring different application procedures. In order to make a better interpretation of the results obtained, analytical techniques were used to understand which are the advantages and disadvantages of the cleaning products used, having always in mind that the treatment should meet certain requirements including safety, harmfulness and applicability to real cases by restorers.
The use of sodium dithionite, despite the fact that the safety of this product to the operator is a bit harsh, proved to be an excellent product for rusted stone cleaning. It works as a reducing agent, making possible to wash away the iron from the stone.
A major problem for this treatment was the use of a correct buffer. A proper combination could prolong the cleaning agent life (which decomposes rapidly in the presence of oxygen) but also regulate the pH of the solution in contact with the stone material. After performing the FTIR analysis, sodium sulfate in the poultice was found. In order to reduce the amount of this compound, the buffer solution was changed from sodium hydrogen carbonate to ammonium carbonate, which allowed a reduction of sodium sulfates after cleaning, thus improving the safety and stability to the stone material.
The use of Hexametaphosphate proved to be unsuitable for this type of cleaning. It would be possibly suitable for other types of cleaning, such as the dissolution of gypsum, which forms over time on the marble surface.
Finally, the use of ammonium citrate showed better results than the previous chemical compound. This cleaning agent should be used when the rust stains are still in an initial state, where its intensity and deepness are low. As this is a less aggressive product, it should be suitable for those situations.
The application method of treatments also proved to have some importance, since depending on the method, different results were obtained. The use of agar as a poultice instead of the usual cellulose poultice, allows the operator to follow more effectively the evolution of the treatment without touching the poultice, which in sensitive substrates translates into an advantage.
31
References
[1] Bams, V. Dewaele, S. 2007. Staining of white marble. Materials Characterization 58, pp 1052-1062.
[2] Dunda, S. Kujundzic, T. 2004. Historic review of exploitation and utilization of stone in Croatia. University of Zagreb, Mining, Geology and Petroleum Engineering Faculty, Zagreb, Croatia. Dimension Stone.
[3] Cushman, M. Wolbers, R. 2007. A new approach to cleaning iron-stained marble surfaces. Volume 29, number 2. WAAC Newsletter.
[4] Vergès-Belmin, V. ed. 2008. Illustrated Glossary on Stone Deterioration Patterns = Glossaire illustré sur les forms d’alteration de la pierre. English-French ed. Monuments & Sites 15. Paris: ICOMOS and ISCS.
[5] Matero, F.G. Tagle, A. A. 1995. Cleaning, iron stain removal and surface repair of architectural marble and crystalline limestone: The Metropolitan Club. Journal of the American Institute of Conservation 34, 49-68.
[6] Vella, D. Hadj Amar, A. B. Chetcuti, F. 2008. A preliminar investigation of the removal of rust stains from Globigerina limestone surfaces using coupled chelating-reducing systems. in Proceedings of the 11th International Congress on Deterioration and Conservation of Stone,
Torun, Poland, 15-20 September 2008, ed. J. Ciabach, Nicholas Copernicus University, Torun. 2607-2618.
[7] Selwyn, Lyndsie. Tse, Season. 2009. The chemistry of sodium dithionite and its use in conservation. Studies in Conservation.Volume 54 Issue Supplement-1, pp. 61-73.
[8] Aires-Barros, Luís. As Rochas dos Monumentos Portugueses, Lisboa: Instituto Português do Património Arquitetónico, Coleção Cadernos, volume I e II. 2001. ISBN 972-8087-81-0.
[9] Amoroso, G.G. Fassina, V. 1983. Stone Decay and Conservation: Atmospheric Pollution, Cleaning, Consolidation and Protecting. Materials Science Monographs, 11. Elsevier Science Publishing Company Inc. New York, Black and White Illust. And line drawings.
[10] Zaini, Nasrullah. Calcite-Dolomite Mapping to assess dolomitization Patterns using laboratory spectra and hyperspectral remote sensing: a case study of Bédarieux Mining Area, SE France. 2009. International Institute for Geo-Information Science and Earth Observation Enschede, The Netherlands.
[11] Erhard M. Winkler, ed. Stone in Architecture: Properties, Durability in Man’s Environment, 3rd ed. (Berlin: Springer Verlag, 1994).
[12] Thorn, A., Treatment of heavily iron-stained limestone and marble sculpture, in ICOM Committee for Conservation 14th Triennial Meeting: the Hague, Netherlands, 12-16 September
32
[13] Tanaka, H. Mishima, R. Hatanaka, N. Ishikawa, T. Nakayama, T. Formation of magnetite rust particles by reacting iron powder with artificial α-, β- and γ-FeOOH in aqueous media, Corrosion Science, Volume 78, January 2014, Pages 384-387[14] Cornell, R. M. Schwertmann, U. The iron Oxides: Structure, Properties, Reactions, Occurrence and Uses, 2nd edn, VCH Publichers, Weinheim (2003).
[15] Irwin, S. A comparison of the use of sodium metabisulfite and sodium dithionite for removing rust stains from paper, American Institute for Conservation, Book and Paper Specialty Group 2011.
[16] Burgess, H. The use of chelating agents in conservation treatments, The paper conservator 15 (1991) 36-44.
[17] Vanýsek, P. Electrochemical series, in CRC Handbook of Chemistry and Physics, 79th
edn, Saunders College Publishing, New York 1988.
[18] Ding. Youzhen, ed. 1998. Electrosynthesis of sodium hydrosulfite. II. The effect of cathode material. Journal of the electrochemical society. Volume 145, issue 12.
[19] Stambolov, T. Notes on the Removal of Iron from Calcareous Stone. Studies in Conservation, Vol. 13, No. 1 (1968). pp 46.
[20] Lister, M. Garvie, R. 1959. Sodium dithionite, decomposition in aqueous solution and in the solid state. Canadian Journal of Chemistry. Vol. 37. pp. 1567-1574.
[21] Mehra, O.P. & Jackson, M.L. Iron oxide removal from soils and clays by a dithionite-citrate system buffered with sodium bicarbonate. Clays & clay mineral conference, 7., London, 1960.
[22] Una vecchia ruggine. CTS Srl. 2006. [Consulted 23-08-2014] Available at: http://www.ctseurope.com/site/dettaglio-news.php?id=45.
[23] Castellini, E. Berthold, C. Malferrari, D. Bernini, F. 2013, Sodium hexametaphosphate interaction with 2:1 clay minerals illite and montmorolillonite. Applied clay science. Volume 83.84 – pp. 162 to 170.
[24] Gervais. Claire, ed. 2010. Cleaning marble with ammonium citrate. Studies in Conservation 55. pp 164-176.
[25] Praiboon J, Chirapart A, Akakabe Y, Bhumibhamound O, Kajiwarac T. 2013. Physical and chemical characterization of agar polysaccharides extracted from the Thai and Japanese species of Gracilaria. Sci Asia 2006, 32:11-17.
[26] Gulotta. Davide. ed. 2014. Setup of a sustainable indoor cleaning methodology for the sculpted stone surfaces of the Duomo of Milan. Heritage Science 2:6.
33
[28] Durán-Suárez J., García-Beltrán A. Rodríguez-Gordillo J. 1995. Colorimetric cataloguing of stone materials (biocalcarenite) and evolution of the chromatic effects of different restoring agents. The science of the Total environment 167, Elsevier Science.[29] D. Vásquez-Nion, P. Sanmartín, B. Silva, B. Prieto. 2013. Reliability of color measurements for monitoring pigment content in a biofilm-forming cyanobacterium. International Biodeterioration & Biodegradation 84, 220-226.
[30] Khan, M. A., Ueno, K., Horimoto, S., Komai, F., Someya, T., Inoue, K., Tanaka, K. and Ono, Y. (2009). CIELAB color variables as indicators of compost stability. Waste Management. 29(12), 2969-75.
[31] Vandevoorde D, Pamplona M, Schalm O, Vanhellemont Y, Cnudde V, Verhaeven E. 2009. Contact sponge method: Performance of a promising tool for measuring the initial water absorption, Journal Heritage, Volume 10, Issue 1, pp. 41-47.
[32] E. Doehne, C. A. Price, 2010. Stone Conservation, An Overview of Current Research, 2nd edition, Canada Getty editions, 40-50.
A.1
A.2
APPENDIX 1. List of previous treatments on rust removal
Table 11.
List of previous treatments on rust removal.
Treatments Authors
Carboxylic acids including citric acid and
salts Stambolov and van Rheeden 1968, Matero and Tagle 1995
Oxalic acid Stambolov 1968
Disodium EDTA Stambolov 1968, Bone 1988, Alessandrini et
al. 1984, Carter 1968
Thioglycolic acid Thorn 1993, Stambolov and Van Rheeden
1968, Howie 1974 In the major part of this last cleaning agents a buffer was used
Sodium citrate in 1957 Amoroso and Fassina 1983
EDTA In 1962 Plenderleight 1971
Citric acid, oxalic acid, and EDTA in 1976 Rinne 1976
Sodium citrate 1968 Stambolov 1968
AB57 – pH 8 Mora et al. 1984
Ammonium Thioglycolate – pH 8 Windholz 1983
Ammonium Thiosulphate Stambolov and van Rheeden 1968
Citric Acid pH 3 MacLeod and North 1979, MacLeod 1987
EDTA pH 4 Alessandrini et al. 1984, Thorn 1993
EDTA pH 11 Thorn 1993
Sodium Thiosulphate Stambolov and Van Rheeden 1968, Edos
1990
Sodium Gluconate pH 6 Stambolov and van Rheeden 1968, Edos 1990 Sodium Hydrosulfite pH 9 Merk 1981, Gilberg 1982, Barov 1987
Thioglycolic Acid Stambolov 1968, Edos 1990, Howie 1974
Ammonium Citrate pH 9 Matero and Tagle 1995
Ammonium Citrate pH 6.5 Gale 1982
“Bio-Pack” and Hydrofluoric Acid pH 2.5 Sramek 1991
Versenol (EDTA) Plenderleith 1955
Oxalic Acid, Citrate, and EDTA Rinne 1976
Trisodium Citrate pH 8 Stambolov and van Rheeden 1968
Sodium dithionite Stambolov (1968)
Sodium thiosulfate Stambolov (1968)
Ammonium citrate buffered with ammonium
hydroxide Matero and Tagle (1995)
A.3
APPENDIX 2. Experimental section
2.1. Specimens distribution
Table 12. Distribution of specimens according to the treatment.
Samples
Treatment
Concentration
Contact
time
Poultice
C1 D1 SDT + sodium hydrogen carbonate 3.5% 6 hours Cellulose C2 D2 SDT + sodium hydrogen carbonate 3.5% 6 hours Cellulose
C3 D3 SDT + sodium hydrogen carbonate 7% 3 hours Cellulose
C4 D4 SDT + sodium hydrogen carbonate 7% 3 hours Cellulose
C5 D5 SDT + Ammonium carbonate 3.5% 4 hours Agar
C6 D6 SDT + Ammonium carbonate 3.5% 4 hours Agar
C7 D7 Hexametaphosphate + Ammonium 10% 2 hours Cellulose
C8 D8 Hexametaphosphate + Ammonium 10% 2 hours Cellulose
C9 D9 Ammonium citrate + ammonium 2% 24 hours Cellulose
C10 D10 Ammonium citrate + ammonium 2% 24 hours Cellulose
C11 D11 Ammonium citrate + ammonium 5% 24 hours Cellulose
C12 D12 Ammonium citrate + ammonium 5% 24 hours Cellulose
C13 D13 SDT + sodium hydrogen carbonate 3.5% 6 hours Cellulose C14 D14 SDT + sodium hydrogen carbonate 7% 3 hours Cellulose
Table 13. Function of the specimens.
Samples Function
C15 D15 Cross-section
C16 D16 Pattern specimen
C17 D17 Pattern specimen
C18 D18 Pattern specimen
2.2. Experimental methods
Sodium dithionite solution preparation
Sodium dithionite solution was prepared using 200ml of distilled water and 7 grams of sodium dithionite to form a 3.5% solution. To prepare the 7% solution was used 14grams of sodium dithionite. Distilled water was under stirring while the reagent was added slowly to facilitate mixing. The buffer solution was prepared with sodium bicarbonate 1Molar in order to subsequently adjust the pH of the solution, adding it immediately after preparation to the sodium dithionite solution. After the preparation of the solution, for each specimen, 50ml was used mixed with cellulose or agar to form the poultice.