A Work Project, presented as part of the requirements for the Award of a Masters Degree in Finance from the NOVA – School of Business and Economics.
EDP Social Action 2020:
Sustainability and Financial Performance
Rita Isabel Espada de Sousa Carraca
#698
A Project carried out under the supervision of: Prof. Joana Story
Eduardo Moura, EDP Pedro Paes, EDP
Abstract
The Dow Jones Sustainability Index (DJSI) represents an important benchmark in the field of corporate sustainability. Energias de Portugal (EDP) has been a DJSI leader for two years, and aims to remain number one, efforts that were addressed in the adjacent Business Project. This Work Project focuses on providing a complementary financial perspective on EDP’s pursuit of sustainability, and presence in the DJSI. An overview of existing research and a study of 38 European firms, using the inclusion in the DJSI as an indicator of sustainability, are used to try to understand the relationship between sustainability and financial performance.
Table of Contents
1 Introduction ... 4
2 Brief Context ... 4
2.1 Company Overview ... 4
2.2 Market Overview ... 5
2.2.1 The Utilities Sector ... 6
2.2.2 Sustainability ... 6
2.3 Company’s Current Situation ... 7
2.4 The Business Project Challenge ... 8
3 Reflection on the Work Done ... 9
3.1 Problem Definition ... 9
3.2 Methodology ... 10
3.2.1 Analysis ... 11
3.2.2 Work Plan ... 14
3.3 Recommendations to the Company ... 15
3.3.1 Policy Recommendations ... 15
3.3.2 Operational Recommendations ... 17
3.4 Discussion of Concerns ... 21
4 Reflection on Learning ... 21
4.1 Previous and New Knowledge ... 21
4.2 Finance Perspective ... 22
4.2.1 Topic Overview ... 22
4.2.2 Do Investors Value Sustainability? ... 23
4.2.3 Implications for EDP ... 26
4.3 Personal Experience ... 26
4.4 Benefit of Hindsight ... 26
5 Conclusion ... 27
6 References ... 28
1 Introduction
The concept of corporate sustainability has grown significantly over the past decades; today it sits on the list of key strategic priorities of the majority of large corporations (KPMG 2011). Corporate sustainability takes environmental consciousness and corporate social responsibility (CSR) to a strategic level, making it a priority for today’s organization. EDP (Energias de Portugal) is no stranger to this shift in priorities, as it has over the past years made sustainability an essential part of the organization. For EDP, an important indicator of the success of its sustainability performance is its position as Utilities’ sector leader in the Dow Jones Sustainability Indices (DJSI). With that in mind, a company goal is to maintain this leadership position (EDP 2015). This goal represented the main research question of the developed Business Project (BP), which this Work Project (WP) aims to complement. The present WP is organized into three main parts*: Brief Context, Reflection on the
Work Done and Reflection on Learning †. The first part provides a foundation for the understanding of the rest of the paper, consisting of a company and market overview, and introducing the BP challenge. The following part focuses on the work developed on the BP, presenting the key points and discussing the process and possible shortcomings of the project. The last part of this WP connects the BP to my previous studies in the Masters in Finance by studying the link between sustainability practices and market performance and expresses a personal view on the work developed.
2 Brief Context
2.1 Company Overview
Energias de Portugal (EDP) dates back to 1976, when it was established to be Portugal’s sole electricity supplier. Since then, the company has grown into an important player in the Utilities sector worldwide. Today, EDP is present in 13 countries and has over 12 000 employees. The group is organized in three main business areas (Appendix 1): EDP Iberia – Electricity generation, distribution and
* The WP follows a predefined structure used by all Nova SBE CEMS MIM students
developing their work Project.
†Given the fact that the BP was a group Project while this WP is individual, the following work will shift between the first and third person in order to acknowledge what was
trade, and gas distribution and trade in Portugal and Spain; EDP Renováveis – Production of renewable energy in all the countries EDP operates; EDP Brazil – Generation, distribution and trade of electricity in Brazil. Parallel to the group’s operations, in its main three markets, EDP Foundations have been established with the goal to reinforce the group’s commitments towards citizenship, by focusing on areas related to the Utilities sector but also by sponsoring cultural, educational and social initiatives (Fundação EDP 2015).
In 2014, EDP reported a net profit distributed to shareholders of €1 040 million, up 4% from the previous year (EDP 2015) (See appendix 2 for stock price information). The company was taken public in 1997 as a first step for its privatization. The phased privatization plan reached a crucial point when in 2012, 21.35% of EDP was sold to the Chinese group, China Three Gorges, under a strategic partnership. This acquisition can have future implications for EDP, but as of today there has been no impact on daily operations.
EDP aims to be recognized as a brand that is human, innovative and sustainable and these characteristics are reflected in the company’s vision, mission, commitments and values (EDP 2015):
Vision A global energy providing company, leader in creating value, innovation and sustainability
Mission Generate well-being and increase quality of life and of the environment, promoting optimism and social dynamism.
Commitments To sustainability, people, results and clients
Values Initiative: Demonstrated through the behavior and attitude of our people
Trust: Of shareholder, customers, suppliers, and other stakeholders Excellence: In the way we perform
Sustainability: Aimed at improving the quality of life for present and future generations
Innovation: With the objective of creating value within the various areas in which we operate
Table 1: EDP’s Vision, Mission, Commitments and Values
2.2 Market Overview
As mentioned above, EDP is part of the Utilities sector. Therefore this section will provide a short overview of the most significant changes happening in the sector that
will inevitably affect EDP’s operations. Moreover, given the sustainability focus of these projects, a second part of this section will outline the relevant sustainability concepts and frameworks.
2.2.1 The Utilities Sector
Although the Utilities sector has existed for many, many years, technological advancements, changing regulations and evolving consumer preferences have, over the past decades, significantly transformed this sector.
Over the past decades, many markets, including Portugal, have undergone a gradual liberalization of its utility sector, allowing consumers to freely select their energy supplier creating new challenges to utility companies (Capgemini 2012). The ability that consumers now have to choose their supplier demands from utility companies a better service provided that goes beyond a stable energy provision. Moreover, this has led to the intensification of competition within the sector as companies struggle to differentiate themselves. Many companies have shifted their focus to renewable energy as a differentiating factor, however even though consumers prefer cleaner energy the majority of them is still not willing to pay a premium for it (WEF 2015). Other main changes stem from technology advancements. Renewable energy production technology is evolving rapidly, making this source of energy more reliable, more efficient and cheaper (WEF 2015). Smart Grid developments have, and will continue to, revolutionize the electricity distribution and consumption habits (Capgemini 2014). Lastly, advancements on solar photovoltaics have brought a new challenge to utility companies, energy home-production. Prosumers, consumers who are also producers, are beginning to play a crucial role in disrupting Utilities business models and the way these companies create value for their consumers (EY 2014). 2.2.2 Sustainability
The concept of corporate sustainability can be defined as “meeting the needs of a
firm’s direct and indirect stakeholders without compromising its ability to meet the needs of future stakeholders” (Dyllick & Hockerts 2002). Generally, mistakenly
associated solely with the environment, in reality sustainability follows a triple bottom line approach (Carroll & Buchholtz 2014). That is, in order to create long-term value, corporate sustainability needs to consider opportunities and manage risks related to economic, environmental and social dimensions.
Within the Utilities sector, sustainability began by being mostly a mandatory compliance on fulfilling targets on CO2 emissions and others. However, this view has evolved and the sector now approaches sustainability in a different manner. The evolution of technology within the renewable energy fields has made sustainability a part of most utility companies’ business model. Moreover, the intense competitive pressures of the sector as mentioned earlier, have led some companies, such as EDP, to focus on sustainability as a differentiation factor that will provide a competitive advantage in the future.
With the increase acceptance of the corporate sustainability concept, multiple international frameworks were developed in particular within the, today extremely prominent, sustainability-reporting field. Among these are the DJSI that given their importance for the BP and this work project will now be explained further.
The Dow Jones Sustainability Indices (DJSI)
Established in 1999, the DJSI was the first sustainability benchmark. Today it is a family of indices that are considered to be one of the most credible sustainability ratings (GlobeScan 2013). To be considered, a company has to go through a corporate sustainability assessment questionnaire, held by RobecoSAM, which focuses on general and industry-specific economic, environmental and social factors. The selections process follows a “best-in-class” approach, selecting for the DJSI world the to 10% with each DJSI industry are selected (RobecoSAM 2014). Every year, industry group leaders are publicly presented. The “best-in-class” approach makes the DJSI a dynamic one, as the assessment criteria evolves yearly in order to accompany and respond to industry advancements and as companies need to continuously intensify their sustainability practices in order to remain part of the index.
2.3 Company’s Current Situation
Given the focus of the Business Project and subsequently this Work Project, it is relevant to focus on EDP’s performance in terms of sustainability. In order to do this, it is important to look at the company’s position regarding sustainability and how it translates into its activities and commitments, but also to look at external entities that provide frameworks to access a company’s engagement towards sustainability. EDP has openly demonstrated its commitment to sustainability by incorporating it into its values and commitments, as seen in the Company Overview, and by
acknowledging it as a key strategic way to achieve a competitive advantage in the future. Moreover, the Group has reinforced this commitment by establishing multiple specific internal organs responsible for developing and guaranteeing the successful implementation of EDP’s sustainability strategy.
Regarding EDP’s sustainability performance in international frameworks, the company is part of and complies with multiple highly recognized frameworks. However, for the purpose of the BP, and this project, it is key to focus on EDP’s performance on the DJSI. EDP has been a part of the index since September 2008 and has gradually improved its final score and its performance in the individual dimensions. More importantly, in 2014 EDP achieved for the second consecutive year the group leader position within the Utilities sector with an overall score of 88. Given the focus of the BP on the social dimension, the following graphs showcase EDP’s scores in 2012 and 2013 social dimension indicators, where is possible to note clear strong performance in some indicators, such as human capital development:
Figure 1: EDP Score DJSI 2012 & 2013 (Data personally provided by EDP)
Overall, EDP has shown significant commitment to sustainability that has been rewarded through the recognition in various international benchmarks, such as DJSI. Nevertheless, to remain on top within the sustainability field is crucial to be one step ahead and address trends as soon as recognized; the BP aimed to aid in this pursuit.
2.4 The Business Project Challenge
As part of the requirements for the CEMS MIM Programme, EDP presented my group with a Business Project (BP) challenge. The goal of the BP was for us, with the support of our business and academic advisors, to present a solution to the presented
challenge. The EDP Social Action 2020 project focused presenting answers to the following question:
How can EDP address social sustainability in order to remain number one in the DJSI by 2020?
3 Reflection on the Work Done
3.1 Problem Definition
EDP wants to be, or better to continue to be, recognized as a sustainable company. Therefore, as previously mentioned, the BP aimed at aiding EDP in this pursuit by identified key trends and translating them into social sustainability actions that could be part of a 2020 plan. Identifying these trends and developing innovative ways to address them is extremely important given the DJSI dynamic nature. As in order to stay ahead in the rankings EDP needs to be able to quickly identify and respond to trends so to maintain its “best-in-class” position within the Utilities sector.
The BP focused on the social dimension of sustainability, one that presents a further challenge when compared to economical or environmental, as it is even harder to measure and assess. Making it challenging for companies to define KPIs to measure the successful implementation of social policies or initiatives. Nevertheless, the final outcome of the BP was a proposed scorecard for the operational recommendations. This scorecard as a final result reinforces the research question of staying number one on the DJSI, as the index uses KPIs as a measure to demonstrate compliance with the initiatives in place (DJSI 2014).
Furthermore, it is interesting to try to understand what reasons are behind EDP’s strong interest in sustainability practices and, accordingly in remaining number one in the DJSI. Competitive pressure has been identified as a key corporate sustainability driver, which is further intensified by the existence of ranking indices, such as the DJSI (GlobalScan & SustainAbility 2014). Other drivers include growing consumer demands for sustainability and transparency, and possible impact on organizations’ reputations (Heslin & Ochoa 2008). Lastly, a growing consideration is the increasing prominence of Sustainable and Responsible Investment (SRI) strategies. That is, investment strategies that consider environmental, social and corporate governance as
a criteria for long-term competitive returns. This topic will be further addressed later on, on the section Finance Perspective.
3.2 Methodology
Before looking further into what was developed during this Business Project, the scope of the project needs to be delimitated. The main objective of the project was to identify trends that are currently observed in the overall business environment and that are relevant from a social perspective for the Utilities sector, and ultimately for EDP. Followed by the recommendations of how EDP can address these trends from a strategic and operational perspective. Therefore, having a clear research process was extremely important to arrive at meaningful recommendations.
In order to help us understand our research and information collection process, we constructed a process map, presented below.
Figure 2: Research Process
This section will focus on reviewing what was developed in the Analysis part, covering both external and internal analysis (for complete version check BP
! External Internal Policy Recommendations Operational Recommendations Analysis Results Scorecard PESTEL Policy' Analysis Drivers Stakeholder+ Analysis Leads!to! Relates!to! Legend& Trends Metrics
document). Furthermore, it will also provide a reflection on the evolution of the work plan throughout the project’s duration.
3.2.1 Analysis
As depicted in Figure 2, our research process began with an external analysis later moving into an internal analysis of EDP. Although recommendations were the final output of this project, given its nature and limitations, the Analysis part is also of major importance in the goal of understanding how to address the future challenges of sustainability, in this case from a social perspective.
The first step of our analysis was a PESTEL Analysis. The main goal of this analysis was twofold: on one hand, it allowed us to understand better the environment that EDP operates in. On the other hand, it served as a foundation for the identification of general global drivers that impact the business environment. Main findings of this part were summarized earlier in the Market Overview.
3.2.1.1 Drivers
The next step was to identify general drivers that exert long-term influence on the overall business environment. Identifying key drivers helped us narrow down areas to focus on during the research for trends, as these drivers are at the origin of the trends. We identified seven key drivers that are presented below:
• Globalization • Connectivity • Competition • Technology Development • Corporate Accountability • Resource Scarcity • Changing Demographics 3.2.1.2 Trends
The identification of relevant trends was a key part of the BP since it served as a foundation for all the drafted recommendations, and ultimately the Scorecard. Trends can be defined as “the direction an industry or […] business is taking. […] These
trends have factual basis but are macro level and related to the business environment as a whole” (Feigenbaum 2015).
The process of uncovering relevant trends was extensive; it began by a general research on trends that developed from the previously presented drivers, generating a long list of trends (Appendix 3 presents a representation of the relationship between drivers and
trends). From there, it was necessary to narrow them down to social trends that were relevant for the Utilities sector and ultimately EDP. The speculative nature of this part of the work is clear, seeing as it is based on conjectures and subjective evaluations. However, in order to derive the most accurate conclusions, we crosschecked various sources and analyzed in depth each of the selected topics. Ultimately, eight key trends were identified and divided into four categories:
The Future Industry
Sphere of Influence – Companies are increasingly expected to take responsibility for
their supply chain, not only in terms of environmental impact, materials employed, and fair completion, but also in terms of social policies (Ruggie 2008).
Shift Towards Service – Technological advances and intensification of the competitive
landscape have changed the Utilities field. Providers now have increasing opportunities and need to differentiate their offers, bundling together electricity distribution with a range of additional services.
The Future Consumer
Prosumers – The rise of solar photovoltaics has the potential to transform a long
centralized utility model into a more decentralized and interactive system (PwC 2014). As such, prosumers represent a new and distinct stakeholder (Hannes & Abbott 2013).
Sharing Economy – An economic model in which individuals are able to borrow or
rent assets owned by someone else, propelled recently by technology advancements (Botsman 2010). The potential impact of this trend for EDP is speculated, yet it would be a mistake not to consider it.
The Future Employee
Workforce Diversity – The increasingly global mobility has brought a new meaning to
workforce diversity, one that is much more difficult for companies to manage (The Economist 2010). This trend will, without a doubt, have a major impact on firms’ social policies.
Flexible Workforce – Finds its roots in the increased demand for flexibility from
employees, in order to suit their lifestyle and to reconcile work and family life. Generally involves allowing for greater flexibility in managing working hours and/or working away from the office.
The Future Society
Strategic CSR – It is about CSR activities that benefit society while simultaneously
reinforcing corporate strategy and measuring impact (Porter & Kramer 2004). This is one of the main challenges for companies in order to ensure a viable business proposition in the long run.
Stakeholder Engagement – Focuses on a bidirectional relationship, one where
stakeholders have the chance to influence the decision-making process, which implies willingness from companies to listen and discuss issues (Jeffery 2009).
3.2.1.3 Stakeholders
Stakeholders are an essential part of the definition of sustainability, therefore defining them and understanding their linkage with EDP in terms of influence and effect, and their relevance for the topic of social sustainability is very important. For the purpose of this project we strayed away from the stakeholders defined by EDP in order to independently identify the stakeholders that better fit the social sustainability topic and the trends identified. A matrix was developed to establish the connection between each stakeholder and the identified trends, see BP document (pg.70).
Nine categories of stakeholders were identified, and were analyzed in terms of their linkage to EDP (influence and effects) and their relevancy for the issue of social policy (potential/ actual impact):
Customers (private and corporate) – Drive EDP’s revenues, determine its reputations
and can influence regulators’ decisions; Can shape trends and determine the acceptance of social policies.
Shareholders (individuals and institutions) – Key part of any public company;
Ultimately determine the implementation of new policies.
Current Workforce – “Employees are EDP”; Target of social policies.
Contractors (in particular, employees formally representing EDP) – Part of EDP’s
value chain; Target of social policies.
Prospective Workforce (particular, future generations of employees) – Target of talent
attraction measures; Determine future policies’ priorities.
Regulators – Determine regulation, supervise activities and are responsible for
Communities – Subject to positive/negative externalities and determine reputation;
Target of social policies.
Media (traditional and social media) – Communicate and influence reputation
perceptions; Represent a source of information on trends
R&D (universities, laboratories, think tanks) – Provide innovative technology; Can
enable innovative social policies
3.2.1.4 Policy Analysis
Policies within organizations play a significant role as a mean to communicate not only basic principles and associated guidelines, but also to direct and limit actions in pursuit of term goals. Therefore, in order to integrate the identified trends in EDP’s long-term social strategy, it was first necessary to review the situation in long-terms of topics and issues currently addressed by internal policies. In particular, policies are of special importance for companies concerned with sustainability as, on a general basis, increase transparency of the company’s activities and commitments. However, more importantly, given the research question, policies are used by the DJSI to assess a company’s performance.
In this analysis, 10 out of 17 EDP’s policies were deemed relevant for the social dimension. The purpose of the analysis was to cross-check the policies against the identified trends. A comprehensive table of the analysis can be seen in the Appendix 4. However, the main takeaways from the analysis were:
• Sphere of Influence appears to be the trend that is more commonly addressed. • The HR policy acknowledges all the trends related to HR.
• The Principles of Sustainable Develop acknowledge the majority of trends related to the external environment.
• Two trends are not present in any policy: Prosumers and Sharing Economy. Although, the majority of trends are to some extent addressed or acknowledged in the policies this does not weaken their relevance, as these mentions are generally do not cover the full extent of implications from the trend as it was later analyzed.
3.2.2 Work Plan
As with any project of this kind, the direction of our work evolved throughout time as new information was collected or as limitations to our research were reached. We were
fortunate to have to opportunity to meet weekly with EDP, which allowed us to weekly access our progress and obtain feedback from that company representatives, that helped us address the limited knowledge we possessed about the intricacies of not only EDP but also of the sector in general.
One important turning point in the BP was realization of the importance of the research process, in particular of the analysis, that led to a shift from the initial strong focus on the final recommendations. This heightened the focus placed particularly on Trends as central part of our BP, hence requiring careful considerations of the characteristics and implications of the selected trends on the rest of the analysis and recommendations. Moreover, another key realization was that in order to address trends with social sustainability implications it would, in most instances, require a more strategic approach and incorporation. Therefore, in order to address this, our recommendations shifted from focusing mainly on operational recommendations to also addressing EDP’s internal policies with the goal of achieving a long-term response and higher acceptance of the identified trends.
3.3 Recommendations to the Company
As observed on Figure 2, recommendations were divided into policy and operational recommendations. The key points of these two sets of recommendations are presented in this section, however for a complete version please refer to the BP document (pg. 35). 3.3.1 Policy Recommendations
The present section had its starting point on the previously presented Policy Analysis. This part of the process studied from the perspective of trends, which policies needed to be adapted and which new policies should be designed. A detailed table with the analysis is presented in BP document (pg.35). The main conclusion of this analysis was that no trend was fully covered by the policies. Therefore, the significant adaptation of five policies and the design of four new policies were recommended.
Changes in Existing Policies
Code of Ethics
• Include a definition of the degree of responsibility that EDP wants to assume throughout the supply chain and with contractors in general.
• Include a general recognition of and commitment to equal rights and opportunities.
Principles of Sustainable Development
• Set the promotion of home production as a goal in order to foster renewable energy production.
• Address Sharing Economy from a strategic perspective, encouraging the development of concepts for shared energy production and usage.
Diversity Policy
• In order to broaden the policy beyond mere diversity numbers, change name to Diversity and Integration Policy.
• Establish a committee or ombudsman for diversity and integration with the goal of developing EDP’s diversity goals and monitoring their acceptance and implementation.
• Add age and generation diversity to priority areas, given that EDP has a significant number of employees retiring in the upcoming years.
• State clear commitment to changing the male/female ratio
Stakeholder Relations Policy
• Include Prosumers as a stakeholder, recognizing their different needs and requirements.
Human Resources Policy
• Define the degree to which this policy should be applied to and by contractors. • Mention need for service orientation and include goal to create a sharing mindset
among employees.
• Set specific goals concerning work/life integration and provide guidelines for the implementation of remote work.
New Policies
Contractors Policy
• Clearly defined the Sphere of Influence and the degree of influence and necessary monitoring on different levels of the sphere.
• States (general) expectations towards suppliers and contractors in terms of employee rights.
• Sets the degree to which contractors working in the name of EDP are bound to (specific) internal labor regulations (e.g.: training, diversity).
• Regulated how contractors will be monitored, controlled and helped.
Customer Relations Policy
• Defines different groups of clients and how to address their individual requirements (e.g.: prosumers).
• Determines service-oriented behavior of employees and ways of communication, as well as guidelines for service-oriented trainings.
Corporate Social Responsibility Policy
• Identifies the sphere of influence and stakeholders for CSR activities. • Sets goals for Strategic CSR.
• Determines involvement of employees and includes or links to the Volunteer Policy.
• Defines measurement systems for CSR initiatives.
Social Media Policy
• Addresses both internal and external social media channels, including a Code of Conduct for social media usage of employees.
• Defines communication practices and gives guidelines for the official social media presence of EDP
• Specifies criteria for the implementation of apps for the engagement of and communication with stakeholders.
3.3.2 Operational Recommendations
The main goal of this final step was to present a few examples of concrete operational ideas that EDP could implement to address the identified trends. Moreover, these recommendations also represented an operational action linked to the above presented changes and new policies. In order to arrive at the final list of recommendations, each initial idea was evaluated on the basis of its potential value creation, focusing on whether it provided a competitive advantage and its implications on performance and
reputation, and its feasibility. The final outcome of this part, and the BP, was the scorecard that will be presented below.
Expanded Benefits to Contractors
Suggests that EDP engages directly with the contracting employees offering them the opportunity to enjoy some of the same, non-monetary benefits of a core employee, such as participation in official events or employee volunteering activities. Main benefits of this recommendation include: increased motivation and commitment of contractors to EDP, which can lead to better service provision and performance. Moreover, it can be implemented within the 5-year timeframe, although observable benefits will likely take some time. Lastly, it can carry high costs depending on how far the integration of contractors’ employees is taken.
Prosumers as Stakeholders
Focuses on the recognition of prosumers through the offering of personalized benefits, such as the establishment of an interactive social platform to allow, and promote, communication among prosumers and with EDP. Presents to EDP the opportunity to be the first provider highly focusing on this new stakeholder, helping develop a strong client base. Implementation would require further research on prosumers preferences and needs in order to develop this platform, however we believed it will be feasible within 5-years. The bulk of the costs associated with this initiative would mainly pertain to having a group of employees dedicated solely to prosumers.
Electric Cars
Proposes that EDP replaces the majority of its car fleet with electric cars, and establish a complementary service that would allow employees to share these cars for internal and external uses. The main benefits, apart from the positive impact on the environment, are the materialization of the companies’ values of sustainability and promotion of electric cars likely increasing EDP’s positive reputation. In turn this could also lead to increased job satisfaction and commitment from employees. It is not possible to fully achieve this recommendation within 5 years, however we proposed the phased substitution of the company’s vehicles. Furthermore, this recommendations carries high initial costs, however overtime running costs of the vehicles tends to be lower.
Anonymous Applications
Consists of the implementation of an electronic system that makes job applications anonymous when reaching recruiters. It is expected to aid EDP in addressing the important male/female ratio, and it can also help prevent other forms of selection biases, namely ethnic. Additionally, it signals to future candidates the company’s focus on skills and qualifications. The recommendation carries very low costs to the organization and can be easily implemented in the 5-year timeframe, however observable results at a company level can take some time.
Diversity Learning Programs
Comprises the implementation of diversity learning programs for all employees, with the goal of educating on the general advantages and strategic benefits of a diverse workforce as well as on how to deal with it on the workplace. In this way, EDP can position itself to take advantage of the many potential benefits of diversity. Costs of implementation can vary depending on the choice of teaching method, such as e-learning platform versus seminars, and the provider of these programs. Nevertheless, the programs can be implemented in the timeframe with results likely spanning over a longer time horizon.
Facilitating Remote Work
Proposed the clear implementation of guidelines on the possibilities of remote work, allowing the employees to decide how best to manage their work efficiently. Employee satisfaction and higher productivity have been linked to this type of initiatives. The recommendation carries extremely low costs and can easily be implemented.
Strategic CSR – Related Competitions
Suggests the creation of a series of competitions, similar to the idea competitions EDP already has in Portugal, but with focus on developing strategic CSR ideas and projects. Presents an opportunity to engage with different stakeholders and foster the company’s image of sustainability. Moreover, the main advantage lies in the innovative ideas that the competitions can bring. Logistics and promotion would represent the main costs of such an initiative, but it could readily be implemented.
Social Media Channels
Aims at strengthening the company’s social media presence through, for example, re-opening the official Facebook-page. The establishment of the two-way communication that social media offers, can bring many benefits for EDP, among them better understatement of its costumer needs. The initiative is relatively inexpensive, although trained, qualified and fully dedicated employees to managing these channels are an important requirement. Nevertheless, it can be achieved within the timeframe.
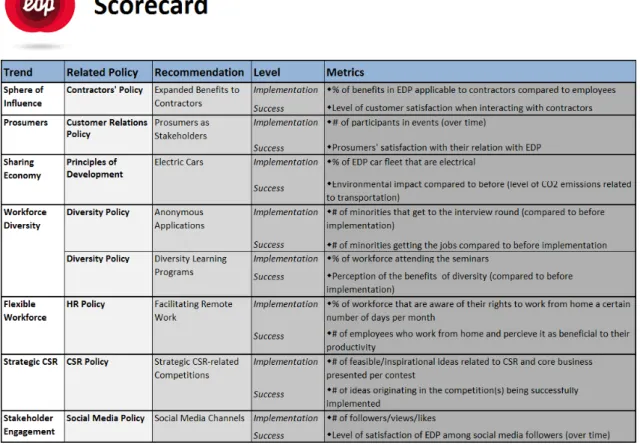
Scorecard
The final outcome of the BP ties together the relevant trends and both policy and operational recommendations. As a key feature, an in any scorecard, it proposes measurement metrics for the recommendation on hand. Each operational recommendation was address with two metrics: an implementation metric that focuses specifically on the success of the recommended initiative, and a success metric that measures the overall success in addressing the broader issue.
3.4 Discussion of Concerns
Lastly it is important to acknowledge the limitations of the project and possible concerns in the pursuit of the recommendations. One meaningful limitation, that had implications on the whole project but in particular in the recommendations, was the reduced access to the organization with regards to contact with the different people that would be affected by the recommendations. Nevertheless, we could count on the invaluable help of the representatives of the sustainability department, to guide us to the process. Although this is a significant limitation for the Recommendations, it has allowed for less biased results in the Analysis part as research was done with very little knowledge of EDP’s practices and initiatives.
Regarding the operational recommendations it is necessary to bear in mind that although an assessment of the cost implications of each recommendation was made, it was based on general research and not on real values that EDP would have to pay therefore the real impact on the company’s accounts was not measured.
The implementation of some of the presented recommendations, in particular the policy changes, would require, not only further research, but also the involvement and acceptance of the whole organization, which can pose a challenge and requires a careful implementation plan.
4 Reflection on Learning
4.1 Previous and New Knowledge
As it is possible to conclude following the overview of the work developed on the BP, the topic did not involve the development of any finance concepts. Therefore, the previous knowledge from my masters applied during this BP pertained mainly to soft skills, team work and research capabilities that were acquired throughout my studies. Regarding the acquisition of new knowledge, I believe that main acquired knowledge related to the sustainability field. In particular with regards to how a company like EDP sees sustainability, and the many different views over the reasons behind companies pursuing this topic, ultimately the discussion whether sustainability has become about “doing good and doing well”. As a finance student this has led me to wonder what are
the stock market views over sustainability, a topic that will be discussed in the following section.
4.2 Finance Perspective
Given the absence of a direct connection between the Business Project and the Masters in Finance, I believe that it is interesting to use this Work Project as a complementary document that offers a finance perspective of the main questions raised during this period. EDP’s focus on sustainability and the desire to remain among the leaders on the DJSI raises the pertinent question of whether these efforts are valued by investors when evaluating the company.
Therefore, this section will provide an overview of theory in this field, followed by an analysis that will focus on trying to ascertain whether investors value sustainability practices. Lastly, a discussion section on the implications of the findings for EDP will be presented.
4.2.1 Topic Overview
As mentioned in the Sustainability part, SRI is a growing trend among fund managers. In Europe, between 2011 and 2013 SRI practices have grown by 65% (Eurosif 2015). With such growth many have tried to ascertain whether SRI actually outperforms or not regular strategies. An overview of existing studies, finds that funds outperformance yields mixed or neutral results in 88% of the studies, however funds have not generally underperform (Deutsche Bank 2012). Given the focus on the DJSI of this project appendix 5 compares the cumulative returns of the global index with those of MSCI. Another interesting field of study relates sustainability with risk. As, for instance Petersen and Vredenburg (2009) have found that investors see sustainability mainly as risk mitigating. Deutsche Bank’s (2012) overview of existing studies finds that 100% of those found that sustainable companies have lower costs of capital. This represents an interesting outcome, which is also extremely relevant for organizations like EDP that invest highly on sustainability.
A large focus of previous research has been on the relationship between sustainability and financial performance. This has been analyzed through various types of studies among them event studies. Of particular interest for this project are studies evaluating the impact of inclusion and exclusion in the DJSI. Consolandi et al. (2008) and Cheung
(2010) found some evidence that the stock market tends to respond positively to DJSI inclusions and negatively to exclusions, however the effect tends to be temporary. A simplified version of this analysis for EDP’s inclusion and announcement of leadership position are presented in appendix 6, however they do not yield informative results. Moreover, a meta-analysis study by Margolis et al. (2007), found that, out of 197 studies, 58% presented non-significant relationship between sustainability and financial performance. The majority of these studies focused on establishing a relationship between performance either accounting-based or market-based, however some of them have studied the role of financial performance on sustainability, generating interesting results. In general, studies focusing on a specific area of sustainability, for example diversity or corporate governance, tend to produce more accurate results (Deutsche Back 2012). Reinforcing the idea that one problem of current studies is that sustainability is a concept that is broad and extremely difficult to measure given its intangible roots. All in all, it is interesting to note that after many years of research and various published studies the relationship between sustainability and financial performance is still not fully understood
4.2.2 Do Investors Value Sustainability?
Following the overview of the theory and previous studies that relate sustainability to financial performance, a small study was formulated with the goal of trying to understand better the relationship between sustainability and market value for European firms.
4.2.2.1 Methodology
Data and Sample Selection
The data used in this study was collected through publicly available information on the DJSI, in particular The Sustainability Yearbook (SY) developed by RobecoSAM, and through Bloomberg. The sample period dates from 2009 to 2014, as to guarantee EDP’s inclusion as sustainable company. The study is based on data from 38 Eurozone firms, the firm selection reasoning was the following: the DJSI organizes components into 24 different sectors; those 24 were narrowed down to 19 through the elimination of financial industries. Through the review of the SY (RobecoSAM) during the sample period, 19 high sustainability-performing companies were selected; when possible these
represented industry leaders. The SY is used as an approximation of the firms listed as part of the DJSI, information that is not publicly disclosed. To every sustainable company selected, a comparable company operating in the same industry was selected, based on the main criterion that it had not been a part of the SY during the relevant period. This resulted in a sample of 38 companies presented in appendix 7.
Empirical Model
The model used in this study is based on the models used by Lo and Sheu (2007) and Ziegler (2009). The study consist on a panel data for t years for i firms, and it can be estimated using the following equation 1:
𝑞!" = 𝛼 + 𝛽 𝐷𝐽𝑆𝐼!"+ 𝛾 𝐶!" + 𝜀!" ,
where qit represents the firm value, α is the constant, DJSIit is the sustainability dummy and Cit represents the control variables.
Dependent Variable – As an approximation of market value, Tobin’s q was used as the dependent variable (Lo & Sheu 2007; Ismail et al. 2007; Wiggins & Ruefli 2002). Tobin’s q is defined as the ratio of the market value of a firm to the replacement value of its assets. However, for simplicity purposes, in this study it was computed following the approach proposed by Lee and Tompkins (1996) as market value plus preferred stock plus debt divided by total assets. It is commonly used as a measure of long-term profitability as it reflects market’s perception of current and potential profitability (Huselin 1995).
Independent Variable – To account for sustainability a dummy variable was used mainly due to the fact that it is difficult to find measurable information on companies’ sustainability performance. Therefore, if a firm is listed on the DJSI the variable would take the value of 1 (Ziegler 2009; Eccles et al. 2012).
Control Variables – Control variables included Size (log(total sales)), Leverage (Debt/Equity), ROA (Return on assets), Sales Growth, Investment growth ( Capex/Sales, as an approximation of R&D growth) and Country Dummy Variables (Lo & Sheu 2007; Ziegler 2009; McWilliams & Siegel 2000; Eccles et al. 2012)
4.2.2.2 Results and Discussion
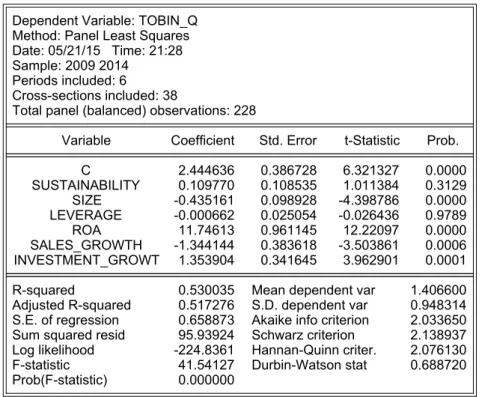
The main results of the model are presented in table 2 and appendix 8 includes variables statistical data.
Table 2: Regression Results
The key finding suggests that there is no statistically significant relation between sustainability, here measured through the DJSI, and market value, here measured by Tobin’s q. The results, albeit disappointing are not unexpected as, as previously seen, many studies have arrived at similar results (Ziegler 2009; Garcia-Castro et al. 2007). Further regressions using the log Tobin’s q, countries control variables and cross-sectionality between sustainability and sales growth were run, however the main results conclusion remained the same.
Nevertheless, some conclusions can be taken from this neutral effect. Although it does not show that sustainability has a significant positive impact on market value, at the same time it excludes the possibility posed by some scholars that the investment in sustainability destroys value (Eccles et al. 2012; Margolis et al. 2009).
One important part of the study is to recognize its limitations. Firstly, the assumption that the DJSI is a good approximate of a company’s sustainability requires that the index company selection to be thorough and unbiased, which might not be completely true given the observed tendency for larger size firms (Consolandi et al. 2008). Moreover, the “best-in-class” approach implies that firms that are not part of the index are not necessarily unsustainable. Secondly, there is the need to consider econometrical limitations possibly incurred for the sake of simplicity, such as the use of only pooled regressions versus fixed or random effects ones, which can yield different results.
Dependent Variable: TOBIN_Q Method: Panel Least Squares Date: 05/21/15 Time: 21:28 Sample: 2009 2014
Periods included: 6
Cross-sections included: 38
Total panel (balanced) observations: 228
Variable Coefficient Std. Error t-Statistic Prob.
C 2.444636 0.386728 6.321327 0.0000 SUSTAINABILITY 0.109770 0.108535 1.011384 0.3129 SIZE -0.435161 0.098928 -4.398786 0.0000 LEVERAGE -0.000662 0.025054 -0.026436 0.9789 ROA 11.74613 0.961145 12.22097 0.0000 SALES_GROWTH -1.344144 0.383618 -3.503861 0.0006 INVESTMENT_GROWT 1.353904 0.341645 3.962901 0.0001
R-squared 0.530035 Mean dependent var 1.406600
Adjusted R-squared 0.517276 S.D. dependent var 0.948314
S.E. of regression 0.658873 Akaike info criterion 2.033650
Sum squared resid 95.93924 Schwarz criterion 2.138937
Log likelihood -224.8361 Hannan-Quinn criter. 2.076130
F-statistic 41.54127 Durbin-Watson stat 0.688720
Lastly, it might be relevant to consider the European setting of the study, as investors willing to reward sustainability are generally associated with the practice of SRI, which is still not as developed in Europe as, for example, in the US.
4.2.3 Implications for EDP
As seen throughout this paper, sustainability is an important part of EDP; therefore it is interesting to consider the implications of the above presented results for the company. The unenthusiastic results regarding the relation between sustainability and market value are not necessary a cause for concern for EDP. As mentioned earlier, the results from this study and previous ones (Deutsche Bank 2012), also show that there is no negative relation between the variable, in other words that EDP’s investment in sustainability is not destroying value.
Even with this relationship not fully understood, investors continue to invest in sustainable companies as it is seen by the growth of SRI. This is a clear positive trend for EDP, given its strong sustainability strategy. Moreover, given EDP’s size and the competitive market that it is in, sustainability should also be seen as a risk mitigating strategy, one that can yield very positive results for the company, as seen earlier, as well as a reputational building strategy (Margolis et al. 2009).
4.3 Personal Experience
The BP offered the unique opportunity to work closely with an organization, similarly to a consulting project. The project provided me with an important learning experience, not only on an academic level but also at a personal one. For me one of the main challenges was during company meeting to try to make sense of all the information that was being gathered while at the same time trying to understand what EDP ultimately saw as a successful result and how it fitted with our process until that stage.
Moreover, being a team project, the BP provided another experience of group dynamics and teamwork. In my case, I believe that I played a very important role in managing the stress, conflicts and strong personalities of all the members of my group. Which I am certain it was invaluable learning for my professional career.
4.4 Benefit of Hindsight
After concluding the BP it is possible to evaluate the work done under a different perspective and further recognize the points that added the most value and what could
have been done differently. Firstly, it is necessary to acknowledge that the results can to some extent be biased towards the company, as it is my perception that most companies engaging on BPs have a clear idea of what the outcome should be from the beginning. Although as a group we were aware of this problem, it is not possible to say that the results of the BP would have been reached without the help of EDP and therefore it is not possible to guarantee unbiased results.
Considering the broad scope of the project and the many different views and approaches that could have been taken, the analysis and final recommendations could have reached various different, yet valid, conclusions. Moreover, the idea of identifying trends that are not already being addressed brought in another complex component to the process, the speculative nature of a crucial part of the presented work. The combination of these factors made the initial phase of the BP a difficult one, as it required the important selection of which approach and path to follow that would shape the subsequent work. Nevertheless, these conditions posed for a challenging yet interesting project, which demanded extensive research and brainstorming.
5 Conclusion
This WP set out to achieve a twofold purpose: to reflect on the previously developed BP and to provide a finance perspective on the matters addressed. Regarding the former, it consisted of an overview and discussion of the contents of the BP and also an evaluation of the relevance of the topic and the research process. The latter, aimed to answer a question that comes hand-in-hand with the sustainability topic, what is the relation between sustainability and market value. Results based on a sample of 38 European firms showed that the relation was not significant, however the study carried important limitations and nevertheless it showcased similar results to previous research.
All in all, although the relation between sustainability and market value is still ambiguous, there is without a doubt an increase interest and demand for sustainability practices from consumers, regulators, investors, and also from other organizations. Therefore, the pursuit by EDP of sustainability appears to be well funded as a long-term strategy.
6 References
Botsman, R. 2010. What's Mine Is Yours: The Rise of Collaborative Consumption.
HarperBusiness.
Carroll, A., & Buchholtz, A. 2014. Business and Society: Ethics, Sustainability, and Stakeholder Management (9th Edition ed.). Cengage Learning.
Ceres. 2015. “Key Drivers for Sustainability”. Ceres. Retrieved from: http://www.ceres.org/roadmap-assessment/about/key-drivers-for-sustainability
DJSI & RobecoSAM. 2015. Corporate Sustainability Assessment. DJSI. Retrieved from:
http://www.sustainability-indices.com/sustainability-assessment/corporate-sustainability-assessment.jsp
DJSI & RobecoSAM 2014. “Corporate Sustainability Assessment. Annual Scoring &
Methodology Review”. Dow Jones Sustainability Indices.
Dugarova, E., & Utting, P. 2014. Social Drivers of Sustainable Development. United Nations
Research Institute for Social Development (UNRISD). Retrieved from:
http://www.unrisd.org/social-drivers-note
Dyllick, T., & Hockerts, K. 2002. “Beyond the Business Case for Corporate Sustainability”. Business Strategy and the Environment (11), 130-141.
Economist Intelligence Unit. 2010. “Global firms in 2020. The next decade of change for
organizations and workers”. The Economist Insights.
EDP. 2013. Annual Report 2013. EDP.
EDP. 2015. Homepage. Retrieved from: https://energia.edp.pt/particulares/servicos.aspx Feigenbaum, E. 2015. Definition of Business Trends. Small Business. Retrieved from
http://smallbusiness.chron.com/definition-business-trends-3399.html
Fundação EDP. 2015. Quem Somos: Missão. Fundação EDP. Retrieved from:
http://www.fundacaoedp.pt/fundacao-edp/quem-somos/missao/126
GlobalScan and SustainAbility. 2014. “The 2014 Sustainability Leaders”. Retrieved from:
http://www.globescan.com/component/edocman/?view=document&id=103&Itemid=591
GlobeScan & SustainAbility 2013. “The 2013 Ratings Survey: Polling the Experts”.
Retrieved. from: http://www.sustainability.com/library/the-2013-ratings-survey-polling-the-experts#.VUo7rimprzI
Hannes, B., Abbott, M. 2013. “Distributed energy: Disrupting the utility business model”. Bain & Company.
Heslin, P. A., & Ochoa, J. D. 2008. „Understanding and Developing Strategic Corporate Social
Responsibility”. Organizational Dynamics , 38 (2), 125-144.
Jeffery, N. 2009. “Stakeholder Engagement: A Road Map to Meaningful Engagement”. Doughtry Centre Corporate Responsibility.
Jong, J. d., Harris, P. W., Harris, S. 2012. “Energy and Utilities: Competition – a Major
Driver for New Business Models” . Capgemini.
Lewiner, C. 2014. “A Strategic Overview of the European Energy Markets”. Capgemini. Petersen, H. L., Vredenburg, H. 2009. „Morals or Economics? Institutional investor
preferences for Corporate Social Responsibility”. Journal of business ethics , 90, 1-14.
Porter M. E., Kramer M.R. 2006. „Strategy and Society: The Link Between Competitive
Advantage and Corporate Social Responsibility”. Harvard Business Review.
PwC 2014 “The road ahead. Gaining momentum from energy transformation”. PwC Global Press Room.
Ruggie, J. 2008. “Clarifying the Concepts of “Sphere of Influence” and “Complicity””. Human Rights Council.
World Economic Forum. 2015. “The Future of Electricity: Attracting investment to build
tomorrow's electricity sector”. WEF, Bain & Company.
Capgemini. 2012. "Energy and Utilities: Competition – a Major Driver for New Business
Models". Capgemini.
Capgemini. 2012. "Eurepean Energy Markets Observatory". Capgemini.
Cheung, A. W. 2010. "Do Stock Investors Value Corporate Sustainability? Evidence from an
Event Study". Journal of Business Ethics , 145-165.
Consolandi, C., Jaiswal-Dale, A., Poggiani, E., & Vercelli, A. 2009. "Global Standards and
Ethical STock Indexes: The Case of the Dow Jones Sustainability Stoxx Index". Journal of
Business Ethics , 185-197.
DB Climate Change Advisors . 2012. "Sustainability Investing: Establishing Long-Term
Value and Performance". Deutsche Bank Group.
Eccles, R. G., Ioannou, I., & Serafeim, G. 2012. "The Impact of a Corporate Culture of
Sustainability on Corporate Behavior and Performance". Harvard Business School - Working
paper .
Eurosif. 2015. SRI Study 2014. Retrieved from
Garcia-Castro, R., Arino, M. A., & Canela, M. A. 2007. "Does Social Performance Really
Lead to Financial Performance? Accounting for Endogeneity". Journal of Business Ethics , 92 (1), 107-126.
Huselin, M. A. 1995. "The Impact of Human Resources Management Practices on Turnover,
Productivity and Corporate Financial Performance". Academy of Management Journal , 38 (3), 653-872.
KPMG & Economist Intelligence Unit. 2011. "Corporate Sustainability: A Progress Report". KPMG.
Lee, D. E., & Tompkins, J. G. 1999. "A Modified Version of the Lewellen and Badrinath
Measure of Tobin's Q". Financial Management , 28 (1), 20-31.
Lo, S.-F., & Sheu, H.-J. 2007. "Is Corporate Sustainability a Value Increasing Strategy for
Business?" Corporate Governance: An International Review , 15 (2), 345-358.
Margolis, J. D., Elfenbein, H. A., & Walsh, J. P. 2007. "Does it pay to be good? A
Meta-Analysis and Refirection of Reseacrh on the Relationship Between Corporate Social and Financial Performance". Retrieved from:
http://www.hks.harvard.edu/m-rcbg/papers/seminars/margolis_november_07.pdf
McWilliams, A., & Siegel, D. 2000. "Corporate Social Responsibility and Financial
Performance: Correlation or Misspecification?" Strategic Management Journal , 21 (5), 603-609.
CEMS Business Project 2015. EDP Social Action 2020.
Richard, O. C., Murthi, B. P., & Ismail, K. 2007. "The Impact of Racial Diversity on
Intermediate and Long-term Performance: The moderating Role of Environmental Context".
Strategic Management Journal , 28 (12), 1213-1233.
RobecoSAM. 2014. "Measuring Intangibles: RobecoSAM's Corporate Sustainability
Assessment Methodology". RobecoSAM.
RobecoSAM. (2008;2009;2010;2011;2012;2013;2014;2015). "The Sustainability Yearbook". RobecoSAM.
Wiggins, R. R., & Ruefli, T. W. 2002. "Sustained Competitive Advantage: Temporal
Dynamics and the Incidence and Persistence of Superior Economic Performance" .
Organization Science , 13 (1), 81-105.
Ziegler, A. 2009. "Is it Beneficial to be Included in a Sustainability Stock Index? A Panel Data
31
7 Appendices
Appendix 1
Appendix 2
EDP’s Stock Market Performance
Appendix 3
Appendix 4
Relationship between current policies and identified trends
Policy Addressed Trends
Code of Ethics Sphere of Influence
Promotion of human and labor rights throughout the supply chain; monitoring of ethical conduct of suppliers
Workforce Diversity
Promotion of mutual respect, diversity and non-discrimination among employees
Stakeholder Engagement
Open dialogue, respecting culture integrity and improving living conditions of local communities, inclusion of stakeholders concerns in decision making
Principles of Sustainable Development
Sphere of Influence
Fostering respect of human rights within sphere of influence, focus on improvement of environmental management in supply chain
Shift toward Service
Providing service of excellence and anticipating customers’ needs and expectations
Strategic CSR
Supporting to social and cultural initiatives, based on transparent criteria
Stakeholder Engagement
Promotion of consultation and communication channels with stakeholders
Health and Safety Policy
No relevance was identified.
Training Policy Sphere of Influence
Encouraging cooperation with the communities to which EDP belongs with a view to sharing resources, improving knowledge and fostering innovation.
Communicatio n Policy
Stakeholder Engagement
Ensuring transparency and credibility of information provided by EDP, promoting and strengthening the trust of stakeholders.
Policy on Fair Competition Practices
Sphere of Influence
Promotion of fair competition practices
Diversity Policy Workforce Diversity
Prioritization of certain areas: gender diversity, diversity of nationality, disability and employment of disadvantaged socioeconomic groups
Volunteer Policy
Strategic CSR
Assessment of resources and impact through the LBG model, in order to make volunteer work eligible for the measurement of company's social investment
Stakeholder Relations Policy
Sphere of Influence
Looking for relationship of collaboration throughout the supply chain
Stakeholder Engagement
Identification and prioritization of Stakeholders that influence and are influenced by the company sharing the knowledge and working together with the community
HR Policy Sphere of Influence
Commitment to diversity throughout the supply chain
Workforce Diversity
Connecting different generations
Flexible Workforce
+ Conciliar Program to address issues related to work-life balance Stakeholder Engagement
Communication channels throughout the company, engagement with the community and prospective workforce
Appendix 5
Appendix 6
Event Study – EDP
• Data on announcement and events day collected from the DJSI website. • Expected returns computed through CAPM, during an estimation period from
2004 to mid-2008.
• Results from other years present the same apparent random effects. • No analysis of the significance of the results was made.
• AD – Announcement day • ED – Event day
Appendix 7 Companies Sample Appendix 8 Variables data Date: 05/21/15 Time: 20:28 Sample: 2009 2014
INVESTMENT LEVERAGE TOBIN_Q__L SUSTAINABILI SIZE SALES_GRO ROA Mean 0.081108 0.757149 0.079770 0.500000 4.048259 0.046489 0.052945 Median 0.040970 0.628075 0.048690 0.500000 4.029512 0.044195 0.050007 Maximum 0.867678 18.21532 0.754020 1.000000 5.189779 0.777702 0.190533 Minimum 0.006150 -16.02532 -0.441098 0.000000 2.284004 -0.601645 -0.143381 Std. Dev. 0.133208 1.783199 0.230003 0.501100 0.575122 0.131383 0.054054 Skewness 4.227281 0.547906 0.694207 0.000000 -0.273144 0.413495 0.008479 Kurtosis 22.10050 75.60560 3.494215 1.000000 2.914095 11.24656 4.642487 Jarque-Bera 4144.934 50091.36 20.63346 38.00000 2.905204 652.5525 25.63147 Probability 0.000000 0.000000 0.000033 0.000000 0.233961 0.000000 0.000003 Sum 18.49268 172.6299 18.18763 114.0000 923.0029 10.59938 12.07149 Sum Sq. Dev. 4.027956 721.8143 12.00863 57.00000 75.08375 3.918339 0.663260 Observations 228 228 228 228 228 228 228 Covariance
INVESTMENT LEVERAGE ROA TOBIN_Q__L TOBIN_Q SIZE SALES_GRO INVESTMENT 0.017666 -0.000368 4.66E-05 0.004738 0.021458 0.007744 -0.001078 LEVERAGE -0.000368 3.165852 -0.018882 -0.057705 -0.241906 0.111989 -0.020379 ROA 4.66E-05 -0.018882 0.002909 0.008751 0.033763 -0.010591 0.003352 TOBIN_Q__L 0.004738 -0.057705 0.008751 0.052669 0.203178 -0.058630 0.007363 TOBIN_Q 0.021458 -0.241906 0.033763 0.203178 0.895356 -0.210037 0.023249 SIZE 0.007744 0.111989 -0.010591 -0.058630 -0.210037 0.329315 -0.022116 SALES_GRO -0.001078 -0.020379 0.003352 0.007363 0.023249 -0.022116 0.017186 SUSTAINABILI -0.009906 0.034764 -0.005343 -0.031179 -0.103594 0.159759 -0.010920