Ljiljana Brbaklić(1), Dragana Trkulja(1), Ankica Kondić‑Špika(1), Nikola Hristov(1), Srbislav Denčić(1),
Sanja Mikić(1), Marina Tomičić(1) and Borislav Kobiljski(2)
(1)Institute of Field and Vegetable Crops, Maksima Gorkog 30, 21000 Novi Sad, Serbia. E‑mail: [email protected], [email protected], [email protected], [email protected], [email protected], [email protected], [email protected] (2)Biogranum, Toplice Milana 20, 21000 Novi Sad, Serbia. E‑mail: [email protected]
Abstract – The objective of this work was to assess the genetic diversity and population structure of wheat
genotypes, to detect significant and stable genetic associations, as well as to evaluate the efficiency of statistical
models to identify chromosome regions responsible for the expression of spike-related traits. Eight important
spike characteristics were measured during five growing seasons in Serbia. A set of 30 microsatellite markers positioned near important agronomic loci was used to evaluate genetic diversity, resulting in a total of 349
alleles. The marker-trait associations were analyzed using the general linear and mixed linear models. The results obtained for number of allelic variants per locus (11.5), average polymorphic information content value
(0.68), and average gene diversity (0.722) showed that the exceptional level of polymorphism in the genotypes
is the main requirement for association studies. The population structure estimated by model-based clustering
distributed the genotypes into six subpopulations according to log probability of data. Significant and stable associations were detected on chromosomes 1B, 2A, 2B, 2D, and 6D, which explained from 4.7 to 40.7% of total phenotypic variations. The general linear model identified a significantly larger number of marker‑trait associations (192) than the mixed linear model (76). The mixed linear model identified nine markers associated
to six traits.
Index terms: Triticum aestivum, genetic resources, microsatellites, population structure, spike-related traits.
Associação genética na detecção de QTLs relacionados
a características da espiga de trigo
Resumo – O objetivo deste trabalho foi avaliar a diversidade genética e a estrutura de população de genótipos
de trigo, para detectar associações genéticas significativas e estáveis, bem como avaliar a eficácia de modelos estatísticos para identificar as regiões cromossômicas responsáveis pela expressão de características da espiga. Foram determinadas oito importantes características durante cinco safras agrícolas na Sérvia. Uma série de 30 marcadores microssatélites, localizados próximos a locos agronomicamente importantes, foi utilizada para avaliação da diversidade genética, o que resultou num total de 349 alelos. As associações
marcador-características foram analisadas com uso dos modelos linear generalizado e linear misto. Os resultados
obtidos para número de variantes alélicas por loco (11,5), valor médio de conteúdo de informação polimórfica (0,68) e diversidade genética média (0,722) mostraram que o nível excepcional de polimorfismo nos genótipos
é o principal requerimento para estudos de associação. A estrutura da população estimada pelo agrupamento com base no modelo distribuiu os genótipos em seis subpopulações, de acordo com o log da probabilidade
dos dados. Associações significativas e estáveis foram detectadas nos cromossomos 1B, 2A, 2B, 2D e 6D, que explicaram de 4,7 a 40,7% do total das variações fenotípicas. O modelo linear generalizado revelou número significativamente maior de associações marcador‑características (192) do que o modelo linear misto (76). O modelo linear misto identificou nove marcadores associados a seis características.
Termos para indexação: Triticum aestivum, recursos genéticos, microssatélites, estrutura da população, características da espiga.
Introduction
Wheat (Triticum aestivum L.) breeders worldwide invest a great deal of effort into creating cultivars
novel techniques and approaches that could improve current conventional breeding programs. Particularly,
the advancement in the field of molecular biology by
applying genetic marker technologies and new statistical approaches are powerful tools for indirect selection of valuable traits through marker-assisted selection
(Landjeva et al., 2007). The detection of specific and
precisely tagged chromosome regions responsible for the expression of certain agronomic traits could be an excellent contribution for the selection and generation of new high-yielding wheat varieties. Likewise, the knowledge of population diversity and structure is of
major importance for an efficient use of elite lines and varieties in a breeding process (Laido et al., 2013).
Spike‑related traits are important yield components,
which are less environmentally sensitive and exhibit higher heritability than yield per se (Cuthbert
et al., 2008). The analyses of the genetic control of
spike-related characteristics and of individual effects of different genes and quantitative trait loci (QTL)
could provide specific information and be useful for
indirect determination of yield improvement (Ma
et al., 2007). In the last few years, association mapping
has been considered one of the most promising methods for the exploration of the entire genome in the search of preferred chromosome regions, QTLs,
and desired genes (Liu et al., 2010). The association
mapping approach provides a greater potential for
the identification of targeted QTLs and fine tuning
and mapping of genes at a higher resolution than the previously used linkage mapping. Based on linkage disequilibrium, association mapping is applied directly to diverse genetic materials, resulting in a larger number of detected alleles per locus in a more representative genetic background. It also represents a higher resolution system due to the recombination events that have been accumulated during selection circles through evolution and historical breeding
processes (Haseneyer et al., 2010). Cultivars genotyped
with high-density markers and their associations show promise in resolving the genetic basis of complex traits of agronomic and economic importance (Wang et al.,
2012). The analysis of complex traits by association
mapping is required for breeders, since it facilitates even more the application of associated markers in the
breeding process. One of the first association mapping studies in wheat aimed at identifying significant
markers for kernel size and milling quality (Breseghello
& Sorrells, 2006). Subsequently, a large number of works used genome‑wide association studies (GWAS)
to detect marker-trait associations (MTAs) for a large number of traits, including quality traits in soft wheat
(Reif et al., 2011), yield and other agronomic traits in wheat (Liu et al., 2010), and seed longevity in hexaploid wheat (Rehman Arif et al., 2012). In bread wheat, a
number of yield-component QTLs was associated with spike-related and adaptive traits (Neumann et al.,
2011). The Tassel software (Bradbury et al., 2007)
is one of the most sophisticated software programs with implemented algorithms and methods useful for association studies. The structure association analysis
developed by Pritchard et al. (2000) first uses a set of
random markers to estimate the population structure (Q matrix) and then incorporates this estimation into a
general linear model (GLM) analysis. Yu et al. (2006)
developed a new methodology, the mixed linear model (MLM) method, which incorporates both the population structure and the familial relatedness or the
so‑called “kinship” (K matrix), adapted for GWAS, to
avoid false associations. This method is recommended in the absence of available pedigree data for clustering a large dataset into groups with improved statistical
power (Zhang et al., 2010).
The objective of this work was to assess the genetic diversity and population structure of wheat genotypes,
to detect significant and stable genetic associations, as well as to evaluate the efficiency of statistical models
to identify chromosome regions responsible for the expression of spike-related traits.
Materials and Methods
A set of 283 wheat accessions originating from 24
countries was used for phenotype evaluation (Table 1). These varieties are part of the largest Wheat Core
Collection in Serbia, which belongs to the Small Grains Department of the Institute of Field and Vegetable Crops in Novi Sad. The genotypes were sown in a randomized complete block design in a 1.2 m2 plot, containing six rows, with a distance of 20 cm
between rows. Field plots were cultivated at Rimski
Šančevi (45°20'N, 19°51'E) in Novi Sad, Serbia, by applying standard agrotechnical practices (Malešević et al., 1994). The following spike‑related traits were
measured and recorded for association analysis, during
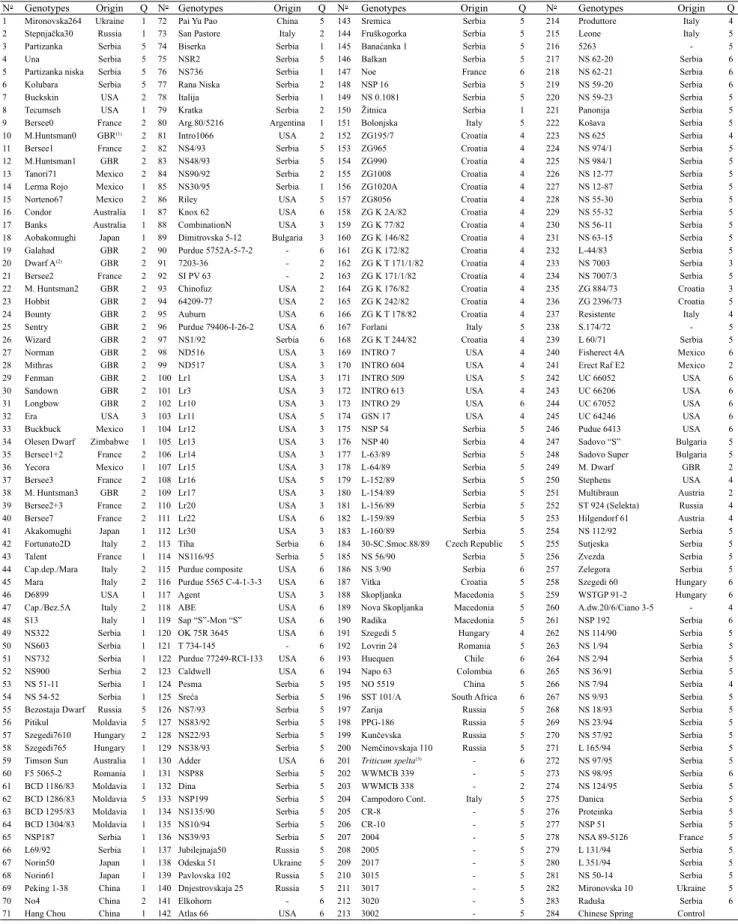
Table 1. Wheat (Triticum aestivum) varieties and lines, origin, and distribution of subpopulations (genotype clusters, Q)
obtained by the Structure software (Pritchard et al., 2000).
No Genotypes Origin Q No Genotypes Origin Q No Genotypes Origin Q No Genotypes Origin Q
1 Mironovska264 Ukraine 1 72 Pai Yu Pao China 5 143 Sremica Serbia 5 214 Produttore Italy 4
2 Stepnjačka30 Russia 1 73 San Pastore Italy 2 144 Fruškogorka Serbia 5 215 Leone Italy 5
3 Partizanka Serbia 5 74 Biserka Serbia 1 145 Banaćanka 1 Serbia 5 216 5263 - 5
4 Una Serbia 5 75 NSR2 Serbia 5 146 Balkan Serbia 5 217 NS 62‑20 Serbia 6 5 Partizanka niska Serbia 5 76 NS736 Serbia 1 147 Noe France 6 218 NS 62‑21 Serbia 6
6 Kolubara Serbia 5 77 Rana Niska Serbia 2 148 NSP 16 Serbia 5 219 NS 59‑20 Serbia 6
7 Buckskin USA 2 78 Italija Serbia 1 149 NS 0.1081 Serbia 5 220 NS 59‑23 Serbia 5
8 Tecumseh USA 1 79 Kratka Serbia 2 150 Žitnica Serbia 1 221 Panonija Serbia 5
9 Bersee0 France 2 80 Arg.80/5216 Argentina 1 151 Bolonjska Italy 5 222 Košava Serbia 5
10 M.Huntsman0 GBR(1) 2 81 Intro1066 USA 2 152 ZG195/7 Croatia 4 223 NS 625 Serbia 4
11 Bersee1 France 2 82 NS4/93 Serbia 5 153 ZG965 Croatia 4 224 NS 974/1 Serbia 5
12 M.Huntsman1 GBR 2 83 NS48/93 Serbia 5 154 ZG990 Croatia 4 225 NS 984/1 Serbia 5
13 Tanori71 Mexico 2 84 NS90/92 Serbia 2 155 ZG1008 Croatia 4 226 NS 12‑77 Serbia 5
14 Lerma Rojo Mexico 1 85 NS30/95 Serbia 1 156 ZG1020A Croatia 4 227 NS 12‑87 Serbia 5 15 Norteno67 Mexico 2 86 Riley USA 5 157 ZG8056 Croatia 4 228 NS 55‑30 Serbia 5
16 Condor Australia 1 87 Knox 62 USA 6 158 ZG K 2A/82 Croatia 4 229 NS 55‑32 Serbia 5
17 Banks Australia 1 88 CombinationN USA 3 159 ZG K 77/82 Croatia 4 230 NS 56‑11 Serbia 5
18 Aobakomughi Japan 1 89 Dimitrovska 5‑12 Bulgaria 3 160 ZG K 146/82 Croatia 4 231 NS 63‑15 Serbia 5
19 Galahad GBR 2 90 Purdue 5752A‑5‑7‑2 - 6 161 ZG K 172/82 Croatia 4 232 L‑44/83 Serbia 5
20 Dwarf A(2) GBR 2 91 7203‑36 - 2 162 ZG K T 171/1/82 Croatia 4 233 NS 7003 Serbia 3
21 Bersee2 France 2 92 SI PV 63 - 2 163 ZG K 171/1/82 Croatia 4 234 NS 7007/3 Serbia 5
22 M. Huntsman2 GBR 2 93 Chinofuz USA 2 164 ZG K 176/82 Croatia 4 235 ZG 884/73 Croatia 3
23 Hobbit GBR 2 94 64209‑77 USA 2 165 ZG K 242/82 Croatia 4 236 ZG 2396/73 Croatia 5
24 Bounty GBR 2 95 Auburn USA 6 166 ZG K T 178/82 Croatia 4 237 Resistente Italy 4
25 Sentry GBR 2 96 Purdue 79406‑I‑26‑2 USA 6 167 Forlani Italy 5 238 S.174/72 - 5
26 Wizard GBR 2 97 NS1/92 Serbia 6 168 ZG K T 244/82 Croatia 4 239 L 60/71 Serbia 5
27 Norman GBR 2 98 ND516 USA 3 169 INTRO 7 USA 4 240 Fisherect 4A Mexico 6
28 Mithras GBR 2 99 ND517 USA 3 170 INTRO 604 USA 4 241 Erect Raf E2 Mexico 2
29 Fenman GBR 2 100 Lr1 USA 3 171 INTRO 509 USA 5 242 UC 66052 USA 6
30 Sandown GBR 2 101 Lr3 USA 3 172 INTRO 613 USA 4 243 UC 66206 USA 6
31 Longbow GBR 2 102 Lr10 USA 3 173 INTRO 29 USA 6 244 UC 67052 USA 6
32 Era USA 3 103 Lr11 USA 5 174 GSN 17 USA 4 245 UC 64246 USA 6 33 Buckbuck Mexico 1 104 Lr12 USA 3 175 NSP 54 Serbia 5 246 Pudue 6413 USA 6
34 Olesen Dwarf Zimbabwe 1 105 Lr13 USA 3 176 NSP 40 Serbia 4 247 Sadovo “S” Bulgaria 5
35 Bersee1+2 France 2 106 Lr14 USA 3 177 L‑63/89 Serbia 5 248 Sadovo Super Bulgaria 5
36 Yecora Mexico 1 107 Lr15 USA 3 178 L‑64/89 Serbia 5 249 M. Dwarf GBR 2 37 Bersee3 France 2 108 Lr16 USA 5 179 L‑152/89 Serbia 5 250 Stephens USA 4
38 M. Huntsman3 GBR 2 109 Lr17 USA 3 180 L‑154/89 Serbia 5 251 Multibraun Austria 2
39 Bersee2+3 France 2 110 Lr20 USA 3 181 L‑156/89 Serbia 5 252 ST 924 (Selekta) Russia 4
40 Bersee7 France 2 111 Lr22 USA 6 182 L‑159/89 Serbia 5 253 Hilgendorf 61 Austria 4 41 Akakomughi Japan 1 112 Lr30 USA 3 183 L‑160/89 Serbia 5 254 NS 112/92 Serbia 5
42 Fortunato2D Italy 2 113 Tiha Serbia 6 184 30‑SC.Smoc.88/89 Czech Republic 5 255 Sutjeska Serbia 5
43 Talent France 1 114 NS116/95 Serbia 5 185 NS 56/90 Serbia 5 256 Zvezda Serbia 5
44 Cap.dep./Mara Italy 2 115 Purdue composite USA 6 186 NS 3/90 Serbia 6 257 Zelegora Serbia 5
45 Mara Italy 2 116 Purdue 5565 C‑4‑1‑3‑3 USA 6 187 Vitka Croatia 5 258 Szegedi 60 Hungary 6
46 D6899 USA 1 117 Agent USA 3 188 Skopljanka Macedonia 5 259 WSTGP 91‑2 Hungary 6
47 Cap./Bez.5A Italy 2 118 ABE USA 6 189 Nova Skopljanka Macedonia 5 260 A.dw.20/6/Ciano 3‑5 - 4
48 S13 Italy 1 119 Sap “S”‑Mon “S” USA 6 190 Radika Macedonia 5 261 NSP 192 Serbia 6 49 NS322 Serbia 1 120 OK 75R 3645 USA 6 191 Szegedi 5 Hungary 4 262 NS 114/90 Serbia 5
50 NS603 Serbia 1 121 T 734‑145 - 6 192 Lovrin 24 Romania 5 263 NS 1/94 Serbia 5 51 NS732 Serbia 1 122 Purdue 77249‑RCI‑133 USA 6 193 Huequen Chile 6 264 NS 2/94 Serbia 5
52 NS900 Serbia 2 123 Caldwell USA 6 194 Napo 63 Colombia 6 265 NS 36/91 Serbia 5
53 NS 51‑11 Serbia 1 124 Pesma Serbia 5 195 NO 5519 China 5 266 NS 7/94 Serbia 4
54 NS 54‑52 Serbia 1 125 Sreća Serbia 5 196 SST 101/A South Africa 6 267 NS 9/93 Serbia 5 55 Bezostaja Dwarf Russia 5 126 NS7/93 Serbia 5 197 Zarija Russia 5 268 NS 18/93 Serbia 5
56 Pitikul Moldavia 5 127 NS83/92 Serbia 5 198 PPG‑186 Russia 5 269 NS 23/94 Serbia 5
57 Szegedi7610 Hungary 2 128 NS22/93 Serbia 5 199 Kunčevska Russia 5 270 NS 57/92 Serbia 5
58 Szegedi765 Hungary 1 129 NS38/93 Serbia 5 200 Nemčinovskaja 110 Russia 5 271 L 165/94 Serbia 5
59 Timson Sun Australia 1 130 Adder USA 6 201 Triticum spelta(3) - 6 272 NS 97/95 Serbia 5
60 F5 5065‑2 Romania 1 131 NSP88 Serbia 5 202 WWMCB 339 - 5 273 NS 98/95 Serbia 6
61 BCD 1186/83 Moldavia 1 132 Dina Serbia 5 203 WWMCB 338 - 2 274 NS 124/95 Serbia 5
62 BCD 1286/83 Moldavia 5 133 NSP199 Serbia 5 204 Campodoro Cont. Italy 5 275 Danica Serbia 5
63 BCD 1295/83 Moldavia 1 134 NS135/90 Serbia 5 205 CR‑8 - 5 276 Proteinka Serbia 5
64 BCD 1304/83 Moldavia 1 135 NS10/94 Serbia 5 206 CR‑10 - 5 277 NSP 51 Serbia 5
65 NSP187 Serbia 1 136 NS39/93 Serbia 5 207 2004 - 5 278 NSA 89‑5126 France 5
66 L69/92 Serbia 1 137 Jubilejnaja50 Russia 5 208 2005 - 5 279 L 131/94 Serbia 5
67 Norin50 Japan 1 138 Odeska 51 Ukraine 5 209 2017 - 5 280 L 351/94 Serbia 5
68 Norin61 Japan 1 139 Pavlovska 102 Russia 5 210 3015 - 5 281 NS 50‑14 Serbia 5
69 Peking 1‑38 China 1 140 Dnjestrovskaja 25 Russia 5 211 3017 - 5 282 Mironovska 10 Ukraine 5
70 No4 China 2 141 Elkohorn - 6 212 3020 - 5 283 Raduša Serbia 6
71 Hang Chou China 1 142 Atlas 66 USA 6 213 3002 - 5 284 Chinese Spring Control
peduncle length, number of spikelets per spike, number of sterile spikelets per spike, spike index, spike weight, grain weight per spike, and grain number per spike.
Genomic DNA from all varieties (approximately ten
plantlets per genotype) was isolated from fresh young
leaves using the CTAB protocol described by Doyle & Doyle (1990). Wheat genotype population was profiled with 30 microsatellite markers out of 41 initial markers, excluding 11 with non‑specific PCR products. The sequences of SSR markers were taken from the GrainGenes database (GrainGenes, 2014) (Table 2). The additional variety Chinese Spring was used as a
positive control. Microsatellites were positioned along almost all three genomes and located near previously
detected important QTLs. PCR amplifications were
carried out according to the protocols given by Röder
et al. (1998). The reaction in 10 µL volume contained 30 ng of DNA template, 1x buffer solution, 2 mmol L-1
dNTPs, 1.5 mmol L-1 MgCl
2, 10 pmol of fluorescently
labeled forward and unlabeled reverse primers, and 1 unit of Taq polymerase. PCR started with an initial
denaturation at 94°C for 5 min, followed by 40 cycles of 94°C for 30 s, 52–62°C for 45 s, and 72°C for 45 s. The final extension was 10 min at 72°C. The PCR
amplicons were separated by size using capillary
electrophoresis on an ABI Prism 3130 genetic analyzer (Applied Biosystems, Foster City, CA, USA). The reaction volume of 10 µL consisted of 2 µL of mixed differently‑labeled PCR products, 0.2 µL of GeneScan 500 LIZ size standard (Applied Biosystems, Foster City, CA, USA), and 7.8 µL of Hi‑Di formamide. The dye‑labeled products were identified by fluorescence
detection, and microsatellite analysis was performed
using the GeneMapper software, version 4.0 (Applied Biosystems, Foster City, CA, USA).
The parameters of genetic diversity were calculated
with the PowerMarker software, version 3.25 (Liu & Muse, 2005). The population structure based on
genetic data was estimated by the Bayesian algorithm
implemented in the Structure software, version 2.3.4 (Pritchard et al., 2000). The hypothetical number of clusters was set ranging from 1 to 20, whereas the
length of the burn-in and the Markov chain Monte
Carlo (MCMC) were determined at 100.000. The real
number of subpopulations was obtained by comparing
log probabilities of data Pr [X|K], and corrections were done according to Evanno et al. (2005). The
selection of the most appropriate number of subgroups
was a critical step for further association analysis.
Determination of internal genetic structure was done
by additional analysis through principal coordinate analysis (PCoA).
The marker-trait associations were analyzed in
the Tassel software, version 2.1. (Bradbury et al., 2007) using two models: GLM and MLM (Yu et al., 2006). The Q matrix for further association analysis
was determined based on the average value of three iterations of log probability of data obtained by the
Structure software (Pritchard et al., 2000). In order to define the level of genetic covariance between pairs
of individuals, a kinship (K) analysis was carried out by molecular data, converting the distance matrix to a similarity matrix using the Tassel software (Bradbury
et al., 2007). The magnitude of QTL effects was
explained by the R2 parameter. The descriptive statistics
of all phenotypic data was performed in the Statistica software, version 10 (Statsoft, Tulsa, OK, USA).
Results and Discussion
A total of 349 alleles was detected in 30 SSR loci, and the mean number of alleles per loci was 11.5 (Table 3). This result was higher than the diversity (7.2) found among USA wheat accessions (Chao et al., 2007). Chen et al. (2003) reported extremely low values of mean
alleles per locus and other polymorphism parameters
as a result of the genotype’s specific region of origin,
which led to a narrowing of genetic diversity. The
sufficient genetic variation observed in the material evaluated in the present study was confirmed in other
studies with the materials from the same core collection
(Kobiljski et al., 2002). However, since the previous analysis was performed on only 96 genotypes, the mean average number of alleles per locus (7.96) was
lower than in the present study. The average number of polymorphic information content (PIC) value was
0.688, representing a highly significant level of genetic
polymorphism. Considering the cosmopolitan origin of the studied varieties (Table 1), the breeding material indicates a broad genetic diversity that proved to be an excellent base for further research.
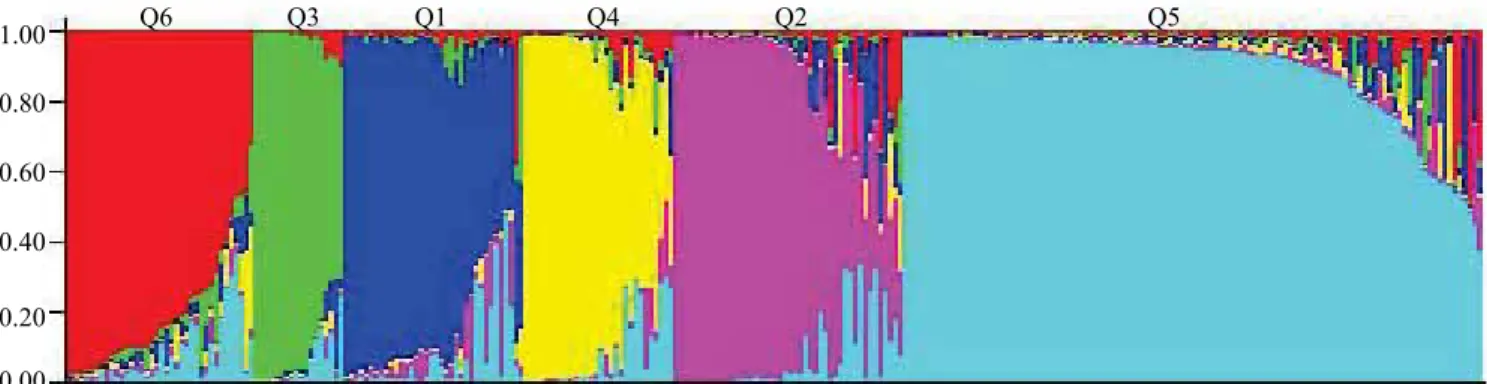
The population structure distributed genotypes into six subpopulations using log probability of data
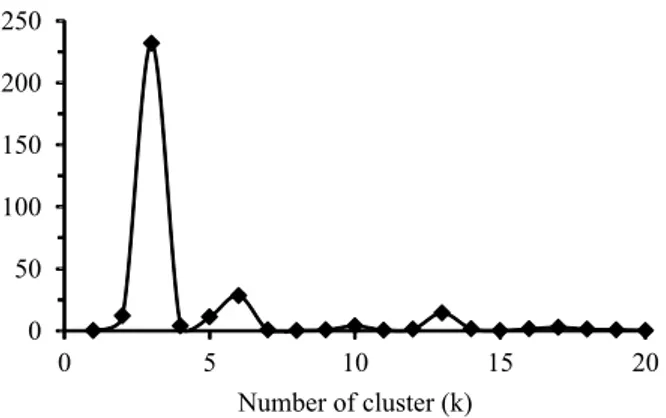
obtained by the Structure software (Figure 1), whereas the corrections of the number of clusters (ΔK) according to Evanno et al. (2005) indicated the distribution
(Figure 2). Evanno’s corrections generally predicted
the existence of two or three subpopulations regardless of the number and diversity of the investigated
materials (Vigouroux et al., 2008), which was confirmed in the present study. The classification of 283 genotypes was more effective in discriminating
the genotypes toward log probability of data. The
largest group (Q5) consisted of 114 genotypes, mainly originating from Serbia, whereas the smallest group (Q3) included 18 cultivars, mostly from the USA. The other subpopulations consisted of 37 genotypes (Q1), with diverse geographic origin; 45 genotypes (Q2),
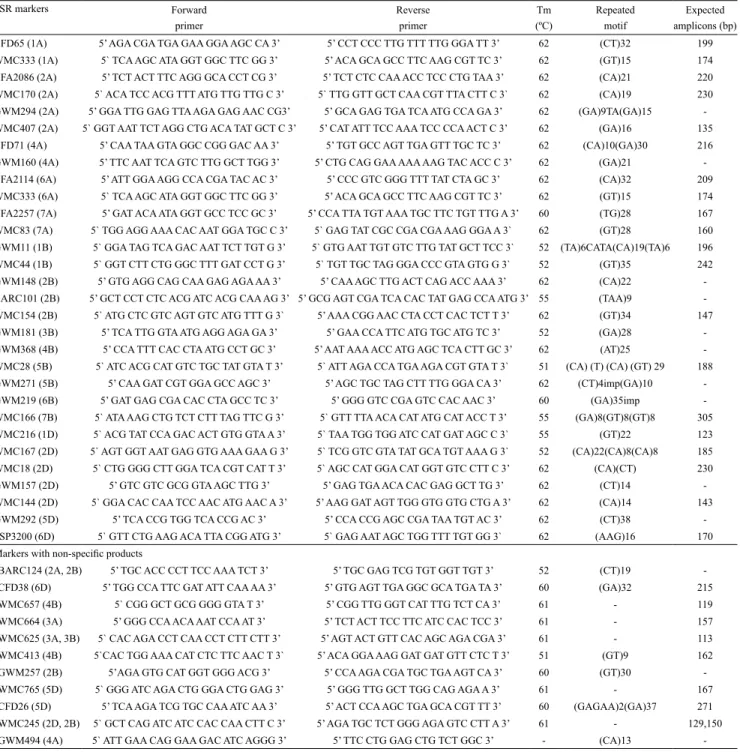
Table 2. Microsatellite markers, sequences of forward and reverse primers, annealing temperature (Tm), repeated motif, and
expected amplicons in the Chinese Spring variety of wheat (Triticum aestivum), used as a positive control.
SSR markers Forward
primer
Reverse primer
Tm (ºC)
Repeated motif
Expected amplicons (bp)
CFD65 (1A) 5’ AGA CGA TGA GAA GGA AGC CA 3’ 5’ CCT CCC TTG TTT TTG GGA TT 3’ 62 (CT)32 199
WMC333 (1A) 5` TCA AGC ATA GGT GGC TTC GG 3’ 5’ ACA GCA GCC TTC AAG CGT TC 3’ 62 (GT)15 174
CFA2086 (2A) 5’ TCT ACT TTC AGG GCA CCT CG 3’ 5’ TCT CTC CAA ACC TCC CTG TAA 3’ 62 (CA)21 220
WMC170 (2A) 5` ACA TCC ACG TTT ATG TTG TTG C 3’ 5` TTG GTT GCT CAA CGT TTA CTT C 3` 62 (CA)19 230
GWM294 (2A) 5’ GGA TTG GAG TTA AGA GAG AAC CG3’ 5’ GCA GAG TGA TCA ATG CCA GA 3’ 62 (GA)9TA(GA)15
-WMC407 (2A) 5` GGT AAT TCT AGG CTG ACA TAT GCT C 3’ 5’ CAT ATT TCC AAA TCC CCA ACT C 3’ 62 (GA)16 135
CFD71 (4A) 5’ CAA TAA GTA GGC CGG GAC AA 3’ 5’ TGT GCC AGT TGA GTT TGC TC 3’ 62 (CA)10(GA)30 216
GWM160 (4A) 5’ TTC AAT TCA GTC TTG GCT TGG 3’ 5’ CTG CAG GAA AAA AAG TAC ACC C 3’ 62 (GA)21
-CFA2114 (6A) 5’ ATT GGA AGG CCA CGA TAC AC 3’ 5’ CCC GTC GGG TTT TAT CTA GC 3’ 62 (CA)32 209
WMC333 (6A) 5` TCA AGC ATA GGT GGC TTC GG 3’ 5’ ACA GCA GCC TTC AAG CGT TC 3’ 62 (GT)15 174
CFA2257 (7A) 5’ GAT ACA ATA GGT GCC TCC GC 3’ 5’ CCA TTA TGT AAA TGC TTC TGT TTG A 3’ 60 (TG)28 167
WMC83 (7A) 5` TGG AGG AAA CAC AAT GGA TGC C 3’ 5` GAG TAT CGC CGA CGA AAG GGA A 3` 62 (GT)28 160
GWM11 (1B) 5` GGA TAG TCA GAC AAT TCT TGT G 3’ 5` GTG AAT TGT GTC TTG TAT GCT TCC 3` 52 (TA)6CATA(CA)19(TA)6 196
WMC44 (1B) 5` GGT CTT CTG GGC TTT GAT CCT G 3’ 5` TGT TGC TAG GGA CCC GTA GTG G 3` 52 (GT)35 242
GWM148 (2B) 5’ GTG AGG CAG CAA GAG AGA AA 3’ 5’ CAA AGC TTG ACT CAG ACC AAA 3’ 62 (CA)22
-BARC101 (2B) 5’ GCT CCT CTC ACG ATC ACG CAA AG 3’ 5’ GCG AGT CGA TCA CAC TAT GAG CCA ATG 3’ 55 (TAA)9
-WMC154 (2B) 5` ATG CTC GTC AGT GTC ATG TTT G 3` 5’ AAA CGG AAC CTA CCT CAC TCT T 3’ 62 (GT)34 147
GWM181 (3B) 5’ TCA TTG GTA ATG AGG AGA GA 3’ 5’ GAA CCA TTC ATG TGC ATG TC 3’ 52 (GA)28
-GWM368 (4B) 5’ CCA TTT CAC CTA ATG CCT GC 3’ 5’ AAT AAA ACC ATG AGC TCA CTT GC 3’ 62 (AT)25
-WMC28 (5B) 5` ATC ACG CAT GTC TGC TAT GTA T 3’ 5` ATT AGA CCA TGA AGA CGT GTA T 3` 51 (CA) (T) (CA) (GT) 29 188
GWM271 (5B) 5’ CAA GAT CGT GGA GCC AGC 3’ 5’ AGC TGC TAG CTT TTG GGA CA 3’ 62 (CT)4imp(GA)10
-GWM219 (6B) 5’ GAT GAG CGA CAC CTA GCC TC 3’ 5’ GGG GTC CGA GTC CAC AAC 3’ 60 (GA)35imp
-WMC166 (7B) 5` ATA AAG CTG TCT CTT TAG TTC G 3’ 5` GTT TTA ACA CAT ATG CAT ACC T 3’ 55 (GA)8(GT)8(GT)8 305
WMC216 (1D) 5` ACG TAT CCA GAC ACT GTG GTA A 3’ 5` TAA TGG TGG ATC CAT GAT AGC C 3` 55 (GT)22 123
WMC167 (2D) 5` AGT GGT AAT GAG GTG AAA GAA G 3’ 5` TCG GTC GTA TAT GCA TGT AAA G 3` 52 (CA)22(CA)8(CA)8 185
WMC18 (2D) 5` CTG GGG CTT GGA TCA CGT CAT T 3’ 5` AGC CAT GGA CAT GGT GTC CTT C 3’ 62 (CA)(CT) 230
GWM157 (2D) 5’ GTC GTC GCG GTA AGC TTG 3’ 5’ GAG TGA ACA CAC GAG GCT TG 3’ 62 (CT)14
-WMC144 (2D) 5` GGA CAC CAA TCC AAC ATG AAC A 3’ 5’ AAG GAT AGT TGG GTG GTG CTG A 3’ 62 (CA)14 143
GWM292 (5D) 5’ TCA CCG TGG TCA CCG AC 3’ 5’ CCA CCG AGC CGA TAA TGT AC 3’ 62 (CT)38
-PSP3200 (6D) 5` GTT CTG AAG ACA TTA CGG ATG 3’ 5` GAG AAT AGC TGG TTT TGT GG 3` 62 (AAG)16 170
Markers with non‑specific products
BARC124 (2A, 2B) 5’ TGC ACC CCT TCC AAA TCT 3’ 5’ TGC GAG TCG TGT GGT TGT 3’ 52 (CT)19
-CFD38 (6D) 5’ TGG CCA TTC GAT ATT CAA AA 3’ 5’ GTG AGT TGA GGC GCA TGA TA 3’ 60 (GA)32 215
WMC657 (4B) 5` CGG GCT GCG GGG GTA T 3’ 5’ CGG TTG GGT CAT TTG TCT CA 3’ 61 - 119
WMC664 (3A) 5’ GGG CCA ACA AAT CCA AT 3’ 5’ TCT ACT TCC TTC ATC CAC TCC 3’ 61 - 157
WMC625 (3A, 3B) 5` CAC AGA CCT CAA CCT CTT CTT 3’ 5’ AGT ACT GTT CAC AGC AGA CGA 3’ 61 - 113
WMC413 (4B) 5`CAC TGG AAA CAT CTC TTC AAC T 3` 5’ ACA GGA AAG GAT GAT GTT CTC T 3’ 51 (GT)9 162
GWM257 (2B) 5’AGA GTG CAT GGT GGG ACG 3’ 5’ CCA AGA CGA TGC TGA AGT CA 3’ 60 (GT)30
-WMC765 (5D) 5` GGG ATC AGA CTG GGA CTG GAG 3’ 5’ GGG TTG GCT TGG CAG AGA A 3’ 61 - 167
CFD26 (5D) 5’ TCA AGA TCG TGC CAA ATC AA 3’ 5’ ACT CCA AGC TGA GCA CGT TT 3’ 60 (GAGAA)2(GA)37 271
WMC245 (2D, 2B) 5` GCT CAG ATC ATC CAC CAA CTT C 3’ 5’ AGA TGC TCT GGG AGA GTC CTT A 3’ 61 - 129,150
-mostly from England and France; 30 genotypes (Q4),
from Croatia; and 40 genotypes (Q6), from the USA. geographical origin and partly by pedigree data.
T
he distribution could be explained partly byTable 3. Basic parameters of genetic diversity in wheat (Triticum aestivum).
SSR markers Chromosome Allelic No/
locus
Most frequent allele
PIC Gene
diversity
Observed heterozygosity
Allele size (bp)
WMC28 5B 10 0.356 0.706 0.746 0 177–203, null
CFD65 1A 10 0.271 0.739 0.777 0.004 180–202, null
GWM292 5D 14 0.342 0.777 0.802 0 196–222, null
WMC167 2D 13 0.649 0.516 0.545 0.028 141–191
GWM271 5B 7 0.528 0.626 0.663 0.004 142–166, null
CFA2257 7A 6 0.570 0.426 0.525 0.021 123–141
WMC83 7A 9 0.289 0.799 0.823 0 151–165, null
GWM148 2B 11 0.269 0.785 0.812 0.011 140–168, null
PSP3200 6D 7 0.391 0.701 0.742 0.018 159–177, null
GWM181 3B 19 0.232 0.827 0.846 0.176 117–157, null
CFA2086 2A 24 0.190 0.896 0.905 0.004 207–275, null
WMC170 2A 10 0.366 0.701 0.741 0.218 182–226, null
GWM11 1B 11 0.300 0.802 0.825 0 184‑206, null
WMC44 1B 21 0.379 0.801 0.816 0.014 204–266, null
CFA2114 6A 12 0.236 0.837 0.855 0 199–221, null
BARC101 2B 10 0.535 0.619 0.655 0.011 102–130, null
WMC216 1D 12 0.794 0.354 0.364 0.004 106–132, null
GWM294 2A 19 0.229 0.858 0.871 0.004 65–111
WMC166 7B 4 0.634 0.513 0.553 0 306–310, null
WMC18 2D 14 0.284 0.830 0.847 0.004 218–248, null
CFD71 4A 16 0.180 0.876 0.888 0.007 169–207, null
GWM157 2D 7 0.826 0.297 0.309 0.014 77–107
WMC144 2D 6 0.582 0.425 0.522 0 137–157
WMC407 2A 11 0.379 0.738 0.769 0.004 121–153
WMC333‑1A 1A 3 0.512 0.400 0.517 0 157–161
WMC333‑6A 6A 6 0.466 0.552 0.626 0 161–183
GWM160 4A 8 0.248 0.785 0.813 0.004 166–186, null
WMC154 2B 15 0.220 0.818 0.840 0.004 117–161
GWM219 6B 15 0.166 0.875 0.888 0 163–195, null
GWM368 4B 19 0.387 0.766 0.789 0 202–258, null
Total/average 349/11.5 0.394 0.688 0.722 0.020
PIC, polymorphic information content.
Figure 1. Population structure of 283 wheat (Triticum aestivum) genotypes estimated using the model-based Bayesian
algorithm implemented in the Structure software (Pritchard et al., 2000) performed with 30 microsatellite loci. Q1 to Q6,
Likewise, strict distribution according to origin is
difficult because of the use of breeding and elite lines
through and by different breeding centers. Even the distribution of genotypes originating from the same regions points to a similar selective pressure in wheat breeding during domestication and the subsequent
breeding process (Laido et al., 2013). Moreover,
internal genetic structure using PCoA separated the
largest subpopulation (Q5) and group (Q2) mostly consistent with grouping by the Structure software (Figure 3). In addition, the groups from Croatia (Q4) and from the USA (Q3) took a particular position in
the coordinate system, whereas the remaining two
clusters (Q1 and Q6) showed dispersed distribution in
the coordinate system. However, certain overlapping
Figure 2. Correction of number of clusters (ΔK) according
to Evanno et al. (2005) for the different Bayesian clustering analyses implemented by the Structure software (Pritchard et al., 2000).
Figure 3. Principal coordinate analysis of the 283 wheat (Triticum aestivum) varieties. Each mark represents a sample
within some subpopulations could be a result of the frequent use of certain varieties as parents, as well as of the inclusion of a great number of genotypes into the analysis. Population structure determined by
model‑based clustering in the Structure software was
the most appropriate tool for determining genetic structure and a key component for further association
studies (Yu et al., 2006).
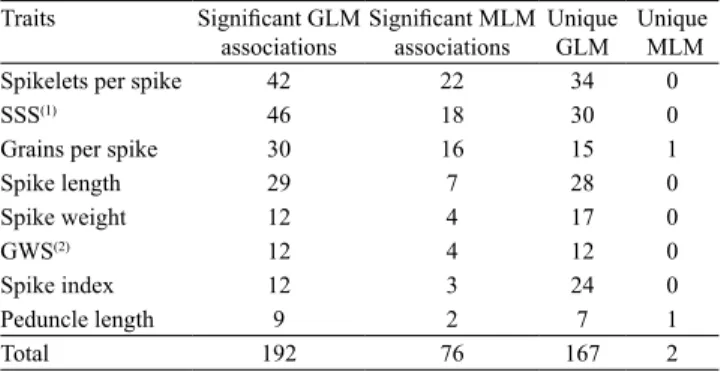
The total number of detected marker-trait
associations in the five evaluation years was of 192 using the GLM method, but decreased to 76 for
all analyzed traits and years using the MLM approach
(Table 4). The advantage of the MLM approach is the
detection of more real loci associated with agronomic traits, without false positive associations (Zhang et al.,
2013). Neumann et al. (2011) suggested the usefulness
of both models because a great number of associations could be neglected using only the MLM, resulting in many MTAs that might not be recognized as potential
loci. This statement is in accordance with Yu et al.
(2009), who proposed that new loci detected by GLM
are also useful and should be additionally validated to avoid false-positive associations. Furthermore, the differences detected by these two models could be
trait‑dependent (Neumann et al., 2011).
It is important to highlight that only the stable associations detected in more than three evaluation
years, at 1% probability, using the GLM and MLM
approaches, were reported (Table 5). Four closely located markers (wmc18, wmc167, wmc144, and gwm157) on chromosome 2D were significant for the
detection of QTLs for number of spikelets per spike, number of sterile spikelets per spike, and grain number per spike. This observation agrees with the results of high partial correlations obtained for these traits
(Table 6). Besides being a carrier of three key genes
for height reduction (Rht8), photoperiod (Ppd1), and yellow rust (Yr16), which are essential for adaptation,
chromosome 2D contained most markers associated
with the agronomically important traits.
The proximity region of the Ppd-1 gene, near
gwm484, was responsible for the expression of many
yield components and spike morphology, showing its
high value for wheat improvement (Dodig et al., 2012).
On the integrated genetic map of this chromosome
created with scaffolds and markers in Aegilops
tauschii, Jia et al. (2013) identified 33 QTLs or genes.
One of them was the QTL for test weight near marker
wmc167, which was significant for spike‑related traits
in the present study. Marker wmc144 showed the
highest effect on phenotypic variation of spikelets
per spike with mean value of 40.7%. QTLs for grain
number per spike and spike length were found in association with marker gwm294, derived by Yao et al.
(2009), located on the long arms of chromosome 2A.
Table 4. Total number of marker‑trait associations (p≤0.01)
detected with the general linear model (GLM) and the mixed linear model (MLM) methods in three evaluation years.
Traits Significant GLM
associations
Significant MLM
associations
Unique
GLM
Unique
MLM
Spikelets per spike 42 22 34 0
SSS(1) 46 18 30 0
Grains per spike 30 16 15 1
Spike length 29 7 28 0
Spike weight 12 4 17 0
GWS(2) 12 4 12 0
Spike index 12 3 24 0
Peduncle length 9 2 7 1
Total 192 76 167 2
Table 5. Markers associated (p≤0.01) with spike‑related traits in more than three evaluation years using the mixed linear
model method, and the mean value of phenotypic variation (%).
Traits/
markers
GWM157
2D WMC1442D WMC1672D WMC182D GWM111B
BARC101
2B GWM2942A CFA20862A WMC333‑26A
Spikelets per spike 12.2 40.7 26.6 13.7 ns ns ns ns ns
Sterile spikelets per spike 9.7 8.6 22.2 14.6 10.7 ns ns ns ns
Grains per spike 7.6 ns 11 8.5 ns 8.2 9.8 ns ns
Spike index ns ns ns ns ns ns ns 14.3 ns
Peduncle length(1) ns ns ns ns ns ns 12 11.1 ns
Spike length 7.6 ns ns ns ns ns 11 14.6 4.7
(1)Measured only in three years, and significant marker‑trait associations in more than two years. nsNonsignificant.
In the present study, this marker showed similar effects
on the phenotypic variation of these traits (13 and 5%,
respectively) (Table 5). Also, two markers (gwm294
and cfa2086) on chromosome 2A were associated with
peduncle length apart from the previously detected
QTL for this trait on chromosome 6A (Neumann et al., 2011). This trait has attracted great interest in recent
studies due to its importance in avoiding ear diseases. Grain number per spike is one of the most important
yield components of wheat (Ma et al., 2007), which
was associated with the largest number of markers
evaluated, i.e., five (Table 5). The specific marker for
grain number was barc101 (2BL), which has not been
previously associated with this trait, indicating the presence of a new QTL. The presence of QTLs near marker gwm11 for a large number of agronomic and adaptive traits has been proven by Wang et al.(2009), whereas, in the present study, the only association of this marker was found with sterile spikelets per spike. Only a limited number of QTL studies for sterile spikelet number per spike have been documented (Ma
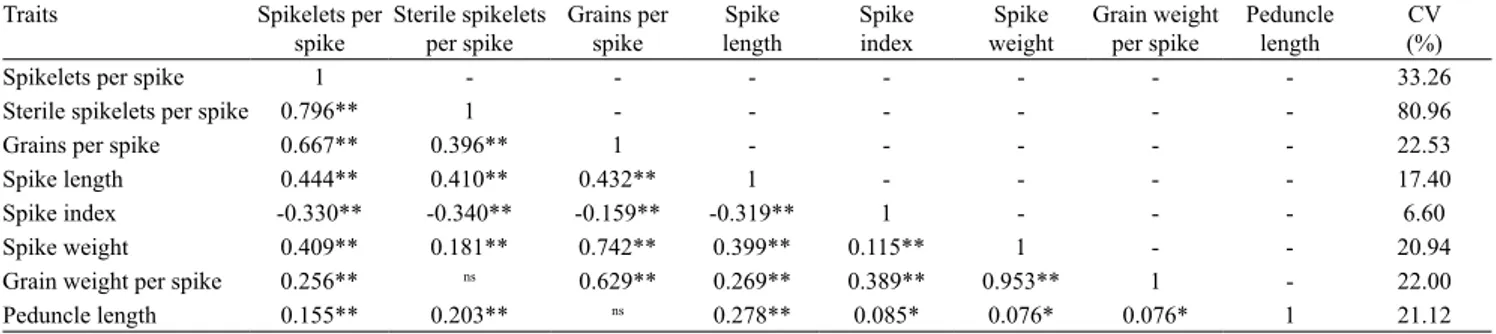
et al., 2007). The coefficient of variation for sterile
spikelets per spike obtained by descriptive statistics
was extremely high (Table 6), probably due to the
selection of a relatively small number of varieties with branched architecture of wheat spikes. Grain weight per spike and spike weight were the only traits with absence of stable associations in more evaluation years.
Using the collection of genotypes with a high level of polymorphism for association analysis and finding
stable QTLs over a course of multiple years could be
useful for the breeding process (Maccaferri et al., 2008). A potential new flowering‑time gene on chromosome 6D (psp3200) was detected in similar material from the
same core collection under contrasting water regimes
(Dodig et al., 2012). However, this region has not shown importance for spike characteristics considering field
conditions. The unique association between marker
wmc333 on chromosome 6A and spike length detected
in the present study could indicate the presence of new potential QTL with minor effect.
Conclusions
1. The evaluated collection of wheat (Triticum aestivum) genotypes shows genetic diversity, and population structure is an important tool for association analysis.
2. A significant number of associations is stable for
six spike-related traits.
3. The statistical models evaluated increase the
accuracy and power of the association analysis.
4. The new chromosome regions identified as
responsible for spike-related traits are useful for wheat breeding programs.
Acknowledgments
To the Ministry of Education, Science and Technological development of Serbia (Project number TR31066), for support.
References
BRADBURY, P.J.; ZHANG, Z.; KROON, D.E.; CASSTEVENS, T.M.; RAMDOSS, Y.; BUCKLER, E.S. TASSEL: software for association mapping of complex traits in diverse samples. Bioinformatics, v.23, p.2633‑2635, 2007. DOI: 10.1093/
bioinformatics/btm308.
BRESEGHELLO, F.; SORRELLS, M.E. Association analysis as a strategy for improvement of quantitative traits in plants.
Table 6. Partial correlations of significant phenotypic traits with mean values for each genotype and coefficient of variation
(CV) for each trait.
Traits Spikelets per
spike
Sterile spikelets
per spike
Grains per spike
Spike
length
Spike
index
Spike
weight
Grain weight per spike
Peduncle length
CV (%)
Spikelets per spike 1 - - - 33.26
Sterile spikelets per spike 0.796** 1 - - - 80.96
Grains per spike 0.667** 0.396** 1 - - - 22.53
Spike length 0.444** 0.410** 0.432** 1 - - - - 17.40
Spike index ‑0.330** ‑0.340** ‑0.159** ‑0.319** 1 - - - 6.60
Spike weight 0.409** 0.181** 0.742** 0.399** 0.115** 1 - - 20.94
Grain weight per spike 0.256** ns 0.629** 0.269** 0.389** 0.953** 1 - 22.00
Crop Science, v.46, p.1323‑1330, 2006. DOI: 10.2135/
cropsci2005.09‑0305.
CHAO, S.M.; ZHANG, W.J.; DUBCOVSKY, J.; SORRELS, M. Evaluation of genetic diversity and genome-wide linkage disequilibrium among U.S. wheat (Triticum aestivum L.) germplasm representing different market classes. Crop Science, v.47, p.1018‑1030, 2007. DOI: 10.2135/cropsci2006.06.0434. CHEN, X.M.; HE, Z.H.; SHI, J.R.; XIA, L.Q.; WARD, R.; ZHOU, Y.; JIANG, G.L. Genetic diversity of high quality winter wheat varieties (lines) based on SSR markers. Acta Agronomica Sinica, v.29, p.13‑19, 2003.
CUTHBERT, J.L.; SOMERS, D.J.; BRULE‑BABEL, A.L.; BROWN, P.D.; CROW, G.H. Molecular mapping of quantitative trait loci for yield and yield components in spring wheat (Triticum aestivum L.). Theoretical and Applied Genetics, v.117, p.595‑608,
2008. DOI: 10.1007/s00122‑008‑0804‑5.
DODIG, D.; ZORIĆ, M.; KOBILJSKI, B.; SAVIĆ, J.; KANDIĆ, V.; QUARRIE, S.; BARNES, J. Genetic and association mapping study of wheat agronomic traits under contrasting water regimes. International Journal of Molecular Sciences, v.13, p.6167‑6188,
2012. DOI: 10.3390/ijms13056167.
DOYLE, J.J.; DOYLE, J.L. Isolation of plant DNA from fresh tissue. Focus, v.12, p.13‑15, 1990.
EVANNO, G.; REGNAUT, S.; GOUDET, J. Detecting the number of clusters of individuals using the software STRUCTURE: a simulation study. Molecular Ecology, v.14, p.2611‑2620, 2005.
DOI: 10.1111/j.1365‑294X.2005.02553.x.
GRAINGENES: a database for Triticeae and Avena. Available at: <http://wheat.pw.usda.gov/GG2/index.shtml>. Accessed on: 10 Sept. 2014.
HASENEYER, G.; STRACKE, S.; PIEPHO, H.‑P.; SAUER, S.; GEIGER, H.H.; GRANER, A. DNA polymorphisms and haplotype patterns of transcription factors involved in barley endosperm development are associated with key agronomic traits. BMC Plant Biology, v.10, p.1‑11, 2010. DOI: 10.1186/1471‑2229‑10‑5.
JIA, J.; ZHAO, S.; KONG, X.; LI, Y.; ZHAO, G.; HE, W.; APPELS, R.; PFEIFER, M.; TAO, Y.; ZHANG, X.; JING, R.; ZHANG, C.; MA, Y.; GAO, L.; GAO, C.; SPANNAGL, M.; MAYER, K.F.X.; LI, D.; PAN, S.; ZHENG, F.; HU, Q.; XIA, X.; LI, J.; LIANG, Q.; CHEN, J.; WICKER, T.; GOU, C.; KUANG, H.; HE, G.; LUO, Y.; KELLER, B.; XIA, Q.; LU, P.; WANG, J.; ZOU, H.; ZHANG, R.; XU, J.; GAO, J.; MIDDLETON, C.; QUAN, Z.; LIU, G.; WANG, J.; INTERNATIONAL WHEAT GENOME SEQUENCING CONSORTIUM; YANG, H.; LIU, X.; HE, Z.; MAO, L.; WANG, J. Aegilops tauschii draft genome sequence reveals a gene repertoire for wheat adaptation. Nature, v.496, p.91‑95, 2013. DOI: 10.1038/
nature12028.
KOBILJSKI, B.; QUARRIE, S.; DENČIĆ, S.; KIRBY, J.; IVEGES, M. Genetic diversity of the Novi Sad Wheat Core Collection revealed by microsatellites. Cellular and Molecular Biology Letters, v.7, p.685‑694, 2002. DOI: 10.1038/nature12028.
LAIDO, G.; MANGINI, G.; TARANTO, F.; GADALETA, A.; BLANCO, A.; CATTIVELLI, L.; MARONE, D.; MASTRANGELO, A.M.; PAPA, R.; DE VITA, P. Genetic diversity and population structure of tetraploid wheats (Triticum
turgidum L.) estimated by SSR, DarT and pedigree data. PloS ONE, v.8, e6720, 2013. DOI: 10.13717/journal.pone.0067280.
LANDJEVA, S.; KORZUN, V.; BÖRNER, A. Molecular markers: actual and potential contributions to wheat genome characterization and breeding. Euphytica, v.156, p.271‑296, 2007. DOI: 10.1007/
s10681‑007‑9371‑0.
LIU, K.J.; MUSE, S.V. PowerMarker: an integrated analysis environment for genetic marker analysis. Bioinformatics, v.21,
p.2128‑2129, 2005. DOI: 10.1093/bioinformatics/bti282.
LIU, L.; WANG, L.; YAO, J.; ZHENG, Y.; ZHAO, C. Association mapping of six agronomic traits on chromosome 4A of wheat (Triticum aestivum L.). Molecular Plant Breeding, v.1, p.1‑10,
2010.
MA, Z.; ZHAO, D.; ZHANG, C.; ZHANG, Z.; XUE, S.; LIN, F.; KONG, Z.; TIAN D.; LUO Q. Molecular genetic analysis of spike‑related traits in wheat using RIL and immortalized F2 populations. Molecular Genetics and Genomics, v.277, p.31‑42,
2007. DOI: 10.1007/s00438‑006‑0166‑0.
MACCAFERRI, M.; SANGUINETI, M.C.; CORNETI, S.; ORTEGA, J.L.A.; SALEM, M.B.; BORT, J.; DEAMBROGIO, E.; GARCIA DEL MORAL, L.F.; DEMONTIS, A.; EL‑AHMED, A.; MAALOUF, F.; MACHLAB, H.; MARTOS, V.; MORAGUES, M.; MOTAWAJ, J.; NACHIT, M.; NSERALLAH, N.; OUABBOU, H.; ROYO, C.; SLAMA, A.; TUBEROSA, R. Quantitative trait loci for grain yield and adaptation of durum wheat (Triticum durum Desf.) across a wide range of water availability. Genetics, v.178,
p.489‑511, 2008. DOI: 10.1534/genetics.107.077297.
MALEŠEVIĆ, M.; STARČEVIĆ, S.; MILOŠEV, D. Terms of cultivation and production technology of grain crops. In: FURMAN, T. (Ed.). The mechanized production of small grains. Novi Sad:
Institute of Agriculture Technique, 1994. p.1‑17.
NEUMANN, K.; KOBILJSKI, B.; DENČIĆ, S.; VARSHNEY, R.K.; BÖRNER, A. Genome‑wide association mapping: a case study in bread wheat (Triticum aestivum L.). Molecular Breeding, v.27, p.37‑58, 2011. DOI: 10.1007/s11032‑010‑9411‑7.
PRITCHARD, J.K.; STEPHENS, M.; DONNELLY, P. Inference of population structure using multilocus genotype data. Genetics, v.155, p.945‑959, 2000.
REHMAN ARIF, M.A.; NAGEL, M.; NEUMANN, K.; KOBILJSKI, B.; LOHWASSER, U. BÖRNER, A. Genetic studies of seed longevity in hexaploid wheat using segregation and association mapping approaches. Euphytica, v.186, p.1‑13, 2012.
DOI: 10.1007/s10681‑011‑0471‑5.
REIF, J.C.; GOWDA, M.; MAURER, H.P.; LONGIN, C.F.H.; KORZUN, V.; EBMEYER, E.; BOTHE, R.; PIETSCH, C.; WÜRSCHUM, T. Association mapping for quality traits in soft winter wheat. Theoretical and Applied Genetics, v.122,
p.961‑970, 2011. DOI: 10.1007/s00122‑010‑1502‑7.
RÖDER, M.S.; KORZUN, V.; WENDEHAKE, K.; PLASCHKE, J.; TIXIER, M‑H.; LEROZ, P.; GANAL, M.W. A microsatellite map of wheat. Genetics, v.194, p.2007‑2023, 1998.
by DNA microsatellites. American Journal of Botany, v.95,
p.1240‑1253, 2008. DOI: 10.3732/ajb.0800097.
WANG, M.; JIANG, N.; JIA, T.; LEACH, L.; COCKRAM, J.; WAUGH, R.; RAMSAY, L.; THOMAS, B.; LUO, Z. Genome‑wide association mapping of agronomic and morphologic traits in highly structured populations of barley cultivars. Theoretical and Applied Genetics, v.124, p.233‑246, 2012. DOI: 10.1007/s00122‑
011‑1697‑2.
WANG, R.X.; HAI, L.; ZHANG, X.Y.; YOU, G.X.; YAN, C.S.; XIAO, S.H. QTL mapping for grain filling rate and yield‑related traits in RILs of the Chinese winter wheat population Heshangmai x Yu8679. Theoretical and Applied Genetics, v.118, p.313‑325,
2009. DOI: 10.1007/s00122‑008‑0901‑5.
YAO, J.; WANG, L.; LIU, L.; ZHAO, C.; ZHENG, Y. Association mapping of agronomic traits on chromosome 2A of wheat. Genetica, v.137, p.67‑75, 2009. DOI: 10.1007/
s10709‑009‑9351‑5.
YU, J.M.; PRESSOIR, G.; BRIGGS, W.H.; VROH BI, I.; YAMASAKI, M.; DOEBLEY, J.F.; MCMULLEN, M.D.; GAUT, B.S.; NIELSEN, D.M.; HOLLAND, J.B.; KRESOVICH, S.; BUCKLER, E.S. A unified mixed‑model method for association
mapping that accounts for multiple levels of relatedness. Nature Genetics, v.38, p.203‑208, 2006. DOI: 10.1038/ng1702.
YU, J.; ZHANG, Y.; ZHU, C.; TABANAO, D.A.; PRESSOIR, G.; TUINSTRA, M.R.; KRESOVICH, S.; TODHUNTER, R.J.; BUCKLER, E.S. Simulation appraisal of the adequacy of number of background markers for relationship estimation in association mapping. Plant Genome, v.2, p.63‑77, 2009. DOI: 10.3835/
plantgenome2008.09.0009.
ZHANG, K.; WANG, J.; ZHANG, L.; RONG, C.; ZHAO, F.; PENG, T.; LI, H.; CHENG, D.; LIU, X.; QIN, H.; ZHANG, A.; TONG, Y.; WANG, D. Association analysis of genomic loci important for grain weight control in elite common wheat varieties cultivated with variable water and fertilizer supply. PLoS ONE, v.8, e57853, 2013. DOI: 10.1371/journal.
pone.0057853.
ZHANG, Z.; ERSOZ, E.; LAI, C.‑Q.; TODHUNTER, R.J.; TIWARI, H.K.; GORE, M.A.; BRADBURY, P.J.; YU, J.; ARNETT, D.K.; ORDOVAS, J.M.; BUCKLER, E.S. Mixed linear model approach adapted for genome-wide association studies. Nature Genetics, v.42, p.355‑360, 2010. DOI: 10.1038/ng.546.