http://www.uem.br/acta ISSN printed: 1679-9275 ISSN on-line: 1807-8621
Doi: 10.4025/actasciagron.v35i4.16290
Efficiency of the leaf disc method for estimating the leaf area index
of soybean plants
Clovis Pierozan Junior1* and Jackson Kawakami2
1
Escola Superior de Agricultura “Luiz de Queiroz”, Universidade de São Paulo, Av. Pádua Dias, 11, 13418-900, Piracicaba, São Paulo, Brazil. 2
Departamento de Agronomia, Universidade Estadual do Centro-Oeste, Guarapuava, Paraná, Brazil. *Author for correspondence. E-mail: [email protected]
ABSTRACT. The objective of this study was to evaluate the efficiency of the leaf disc method for estimating the leaf area index (LAI) of soybean plants in comparison with the digital photo method. A split-plot experimental design was used with three replications. The LAIs calculated by the leaf disc and digital photo methods were compared at four growth stages in four soybean cultivars (subplot). These soybean cultivars were sowed in Guarapuava, Paraná State, Brazil, at three different sowing dates (main plot) in the 2010/2011 growing season. Regression analysis was used for each group of samples, and the efficiency of the leaf disc method was evaluated on the basis of the coefficient of determination (R²), the calculated F and the intersection and abscissa errors. The regression analysis that compared the two methods resulted in highly significant F values and low errors for all sample groups, which showed the effectiveness of the leaf disc method. Although the R2 value was high for all of
the analyses, the values were minor for the separate growth stage analysis, especially for the samples collected at the V9 and R2 stages. The results indicated that the specific leaf area calculated by the leaf disc method was lesser to the specific leaf area calculated by the digital photo method. The leaf disc method is an efficient and robust method for estimating the LAI of soybean plants.
Keywords: Glycine max, cultivars, digital photos, growth stages, sowing dates.
Eficiência do método de discos foliares para estimar o índice de área foliar em plantas de soja
RESUMO. O objetivo deste estudo foi avaliar a eficiência do método dos discos foliares para estimar o índice de área foliar (IAF) de plantas de soja em comparação como método de fotos digitais. O delineamento experimental utilizado foi o de parcelas subdivididas com três repetições. Os IAFs calculados pelo método dos discos e das fotos digitais foram comparados em quatro estádios de desenvolvimento, e em quatro cultivares de soja (subparcelas). As cultivares de soja foram semeadas em Guarapuava, Estado do Paraná, Brasil, em três diferentes datas de semeadura (parcelas principais) na safra de 2010/2011. Análise de regressão foi feita para cada grupo de amostras, e a eficiência do método dos discos foi avaliado com base no coeficiente de determinação (R²), no F calculado e nos erros da interseção e da abscissa. As análises de regressão que compararam os dois métodos resultaram em F altamente significativos e baixos erros para todos os grupos de análises, o que mostrou a eficácia do método dos discos. Embora o valor de R2 tenha sido elevado em todas as análises, os valores foram menores para as análises
separadas por estádios de crescimento, especialmente para as amostras coletadas nos estádios V9 e R2. Os resultados indicaram que a área foliar específica calculada pelo método dos discos foliares foi menor do que a área foliar específica calculada pelo método das fotos digitais. O método dos discos foliares é um eficiente e robusto método para estimar o IAF de plantas de soja.
Palavras-chave:Glycine max, cultivares, fotos digitais, estádios fenológicos, épocas de semeadura.
Introduction
The leaf area (LA) of a plant culture is related to
its growth (PEKSEN, 2007) and can indicate crop
yield (FAVARIN et al., 2002). It is important to determine the capacity of plants to synthesize and translocate photoassimilates to several organs (FONTES et al., 2005).
In studies that involve seeding density, fertilization, irrigation, pruning or pesticides application (among other treatments), the leaf area
index (LAI) is required to manage crop growth and to serve as a basis for plant growth analysis (FAVARIN et al., 2002; DAMMER et al., 2008; TAVARES JÚNIOR et al., 2002).
There are several measurement methods that are
used for estimating crop LA (KUMAR, 2009).
counting method (for example, leaf area integrator, ADAMI et al., 2008), the primary method for LA measurements. However, the digital photo method requires the software uses photo edition, which is time consuming and can cause errors (JONCKHEERE et al., 2004). According to Tavares Júnior et al. (2002), who studied coffee plants, the leaf disc area method has a higher standard error than the digital photo method, but the leaf disc area method is simpler and faster.
In soybean (Glycine max (L.) Merrill) plants,
parameters such as the crop growth rate and net assimilation rate depend on the LAI of the plants and can be used to explain an increase in the number of pods (ISODA et al., 2010). The growth and yield of soybean plants can be explained by the LAI before the pod filling period and by the net assimilation rate after the vegetative period (ISODA et al., 2010). The LAI is highly correlated with crop yield until the pod filling period and can vary significantly between soybean cultivars within similar maturation groups (LIU et al., 2005). The majority of the soybean genotypes that are used south of the Tropic of Capricorn have a growing season length that depends on their interaction with the environment, and the sowing date has a large influence on the plant growth. Thus depending on the genotype x environment interaction, the LAI of the culture can vary even for plants in the same plant phenology stage (CÂMARA, 1997; MOTTA et al., 2000; QUEIROZ et al., 1998).
Therefore, because the LAI is highly correlated with yield, it is important for calculating growth parameter for different cultivars, environments and growth stages. This way, the use of a simple and practical LAI prediction method, such as the leaf disc method, is of interest for researchers, growers and agronomists. However, it is necessary to verify the efficiency of the LAI prediction method for different field conditions.
This study tests the hypothesis that there is no difference between the digital photo and leaf disc estimation methods of the LA. The objective of this study was to evaluate the efficiency of the leaf disc method in comparison with the standard digital photo method for estimating LAI in soybean plants. This efficiency was evaluated in different environments, for different cultivars and at different phenological growth stages.
Material and methods
The experiment was conducted in Guarapuava city, in the state of Paraná, Brazil, which is at a latitude of 25º23’36” S, a longitude of 51º27’19” W and an altitude of 1,120 m. The 2010/2011 crop season was tested. According to the Köppen
classification system, the regional climate is altitude seasoned - Cfb (KOTTEK et al., 2006). A split plot experimental design was used with three replications (blocks). The main plots consisted of three sowing dates in 2010 (21/10, 18/11 and 20/12), and the subplots
consisted of four cultivars (BMX Apolo® RR, BRS
284®, BMX Energia® RR and FPS Urano® RR). The
subplots had four rows that were 11 m long and 0.4 m
apart. The sowing rate was 20 seeds meter-1, which
resulted in a total population of 500,000 seeds ha-1. For
all cultivars, the plants were thinned during the VE (FEHR; CAVINESS, 1977) stage to achieve a final population of 260,000 plants ha-1.
The LAI was estimated by the following methods
The digital photo method. Random samples of approximately 1,000 cm² of leaves were extended with the assistance of a glass and were photographed with a scale of known dimensions
to measure the LA with the Image-J® software
(ABRAMOFF et al., 2004). To determine the
specific leaf area (SLA, cm2 g-1), the photographed
samples were dried in a forced aeration oven at 70ºC until a constant mass was achieved. This method was used as a standard experimental method. According to Adami et al. (2008), this method provides excellent LA measurements with a level of precision similar to that of LA integrator equipment.
The LAI was calculated by using the following formula:
000 , 10
SA SLA DMt
LAIphotos
where:
LAI photos = Leaf area index, calculated by digital photo method;
DMt = Total dry matter of the leaves (g); SLA = Specific leaf area (cm2 g-1); and
SA = Soil surface area (m2).
000 , 10
SA SLA DMt
LAIdiscs
where:
LAI discs = Leaf area index calculated for the know area leaf disc method;
DMt = Total dry matter of the leaves (g); SLA = Specific leaf area (cm2 g-1); and
SA = Soil surface area (m2).
In each analysis all plants in a 0.4 m long section of the two central rows were sampled. On average, 8.32 plants were sampled in each subplot during the four different phenological growth stages (V4, V9, R2 and
R5.3). The FPS Urano® RR cultivar was used as a
reference to determine the phenological growth stage.
When the FPS Urano® RR cultivar achieved one of the
four cited stages, all four cultivars were sampled. A 0.4 m boarder was left between each sampling stage.
Between the two methods, the plant stages, cultivars, the sowing date and all parameters were compared. The F regression (p-value < 0.01) was used to compare the results. The determination coefficient (R²), the angular coefficient of regression and the intersection and abscissa errors were compared. The average SLA’s from the two methods were compared with a t-test.
Results and discussion
Table 1 presents the calculated F, the significance, and the regression error values for the digital photo and leaf disc methods for all analysis groups.
Table 1. The calculated F values, the significance of F and the intersection and abscissa errors of the regression analyses between the digital photo and leaf disc methods for leaf area estimates in soybean plants. Samples were collected during four growing stages, at three sowing dates and for four cultivars in the 2010/2011 growing season in Guarapuava, Paraná State.
Samplings Calculated F Significance F Intersection error Abscissa error
V4 276.0 6.9E-18 0.032 0.044
V9 105.8 5.7E-12 0.234 0.093
R2 135.0 2.19E-13 0.402 0.092
R5.2 236.4 7.1E-17 0.228 0.046
EP1 561.0 2.06E-27 0.159 0.037
EP2 1180.9 1.89E-34 0.090 0.026
EP3 834.9 3.89E-31 0.092 0.033
Apolo 824.3 2.10E-25 0.102 0.032 BRS 284 501.1 6.30E-22 0.145 0.038 Energia 549.0 1.50E-22 0.131 0.039 Urano 542.8 1.80E-22 0.151 0.040 General 2322.7 6.85E-90 0.068 0.019
The calculated F value was highly significant, and the regression errors were small for all analyses. Thus, the leaf disc method reliably and efficiently estimates
the digital photo method results. In a study of Crambe
abyssinica, Toebe et al. (2010) verified the correlation
between the leaf disc and the digital photo methods, corresponding to the results of the present soybean plant study.
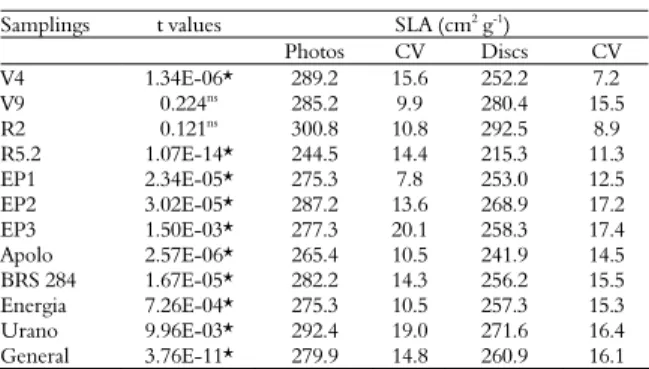
The SLA estimated by the leaf disc method was smaller than that estimated by the digital photo method (except for estimates during the V9 and R2 stages) (Table 2). This difference was probably results from the consistent collection of the central nervures in the leaf disc method, which decreases the SLA in comparison to the digital SLA photos. The coefficient of variation (CV) of the leaf disc method was similar to that of the digital photo method, which suggests that the precision of both methods is similar.
Table 2. Specific leaf area (SLA, cm2
g-1
) and coefficient of variation (CV) of soybean plant estimates by the digital photo method (photos) and the leaf disc method (discs). Samples were collected at four growth stages, for four soybean cultivars and at three different sowing dates in the 2010/2011 growing season in Guarapuava, Paraná State.
Samplings t values SLA (cm2 g-1)
Photos CV Discs CV
V4 1.34E-06* 289.2 15.6 252.2 7.2 V9 0.224ns 285.2 9.9 280.4 15.5 R2 0.121ns 300.8 10.8 292.5 8.9 R5.2 1.07E-14* 244.5 14.4 215.3 11.3 EP1 2.34E-05* 275.3 7.8 253.0 12.5 EP2 3.02E-05* 287.2 13.6 268.9 17.2 EP3 1.50E-03* 277.3 20.1 258.3 17.4 Apolo 2.57E-06* 265.4 10.5 241.9 14.5 BRS 284 1.67E-05* 282.2 14.3 256.2 15.5 Energia 7.26E-04* 275.3 10.5 257.3 15.3 Urano 9.96E-03* 292.4 19.0 271.6 16.4 General 3.76E-11* 279.9 14.8 260.9 16.1 * and ns: The SLA results from the digital photo and leaf disc methods were or were not
different, respectively, as determined by a t-test with a 5% probability level.
A high correlation was found between the digital photo and leaf disc methods at different culture growth stages, particularly during the first (V4) and last (R5.3) growth stages (Figure 1).
y = 0.986x R² = 0.794*** 0
2 4 6 8
0 2 4 6 8
LA
I d
is
c
s
LAI photos (c)
y = 0.864x R² = 0.824*** 0
2 4 6 8 10
0 2 4 6 8 10
LAI photos (d)
y = 0.977x R² = 0.756***
0 1 2 3 4
0 1 2 3 4
(b)
y = 0.875x R² = 0.848*** 0
0,3 0,6 0,9 1,2 1,5
0 0,3 0,6 0,9 1,2 1,5
LA
I d
is
cs
(a )
0.3 0.6 0.9 1.2 1.5 1.5
1.2
0.9
0.6
0.3
The second and third samplings (Figure 1b and 1c, respectively) that were conducted during the V9 and R2 stages had the smallest R² values. However, the significant F value from the regression analysis (Table 1) shows that the leaf disc method is highly efficient for estimating the LAI.
By comparing the LAI estimations between the two methods, a subestimation of the LAI is obtained from the leaf disc method. In contrast to the results obtained by Tavares Júnior et al. (2002) and Dombroski et al. (2010), who compared the digital scanner method with the leaf disc method, we concluded that the LA was overestimated in the leaf disc method. Dombroski et al. (2010), working with a pine cone culture, used a correction factor (0.894) to balance the overestimation of LA by the leaf disc
method. In a study that used Chrysobalanus icaco,
Cunha et al. (2010) found a high coefficient of determination (R² = 0.978) and a high angular coefficient (0.994) between the digital scanner and the leaf disc methods. However, to reduce errors due to sampling and variation that occurred between the leaves, the authors emphasize that a LA correction factor is necessary for measurements made with the leaf disc method.
The discrepancy between the leaf disc method LAI results in the present study and those from others studies likely results from the fact that other researches avoided the perforated central leaf area. Thus, the central nervure was excluded from sampling. The smaller SLA value for the leaf disc method in comparison to the digital photo method explains why the angular coefficient is below 1. In addition, this finding partially clarifies the differences between the present and past research results. The underestimation of LA in the present study is proportional to or smaller than the overestimation that was observed in other studies, such as those by Dombroski et al. (2010), Marrocos et al. (2010) and Lucena et al. (2011).
In a comparison between the leaf disc method and the digital scanner analysis method in beet plants, Marrocos et al. (2010) obtained a result of R² = 0.87. The authors suggest that this result occurred because the leaves were not always perforated in the same place, which increased the SLA variability and error and decreased the R² value. Lucena et al. (2011) compared different LA measurement methods in acerola plants and obtained the smallest R² value (0.859) with the leaf disc method. This finding was hypothesized to result from the high SLA variability of the acerola plants. Specifically, the plasticity within the plant differed depending on the plant age, the canopy position and the leaf adaptation to light microenvironments. Nevertheless, the
authors concluded that the leaf disc method was efficient for measuring the LA of acerola plants.
It could be suggested that the branching and uneven leaf development during the V9 and R2 stages was responsible for reduced sampling efficacy and the relatively low observed R² during the V4 and R5.3 stages. However, this hypothesis is not supported by the similar CVs for the observed SLAs at each sampling date (Table 2).
Lopes et al. (2007) determined that the highest accuracy of digital photo LA estimations occurred during the phenological growth stages. In this study, the authors only used one cultivar and only sampled at one date of plant development. However, as observed in this study, mixing cultivars and sowing dates for estimating LA at different growth stages probability decreased the resulting R². Therefore, we suggest that the LA analysis of soybean plants should be conducted separately for different cultivars or sowing dates within each growth stage to estimate the LA of different cultivars at different sowing dates and growth stages.
Monteiro et al. (2005) worked with cotton plants and reported that morphological uniformity of the leaves within and between plants is important. They mention that the estimation of LA by the length of leaves also depends on leaf uniformity. Therefore, the sampling performed without standards can increase the sample error. In this study, the inclusion of the central nervure proved to be an effective method for reducing variability and increasing the estimation efficiency.
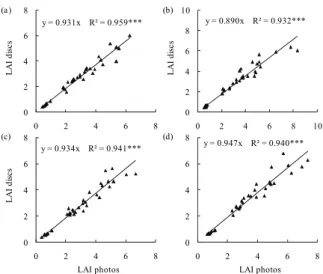
In the curve fits of each of the cultivars (Figure 2), the leaf disc method had a robust estimation and a R² of between 93 and 96% among the cultivars.
y = 0.931x R² = 0.959***
0 2 4 6 8
0 2 4 6 8
LA
I d
isc
s
(a )
y = 0.890x R² = 0.932***
0 2 4 6 8 10
0 2 4 6 8 10
LA
I d
isc
s
(b)
y = 0.934x R² = 0.941***
0 2 4 6 8
0 2 4 6 8
LA
I d
is
c
s
LAI photos (c)
y = 0.947x R² = 0.940***
0 2 4 6 8
0 2 4 6 8
LA
I d
is
c
s
LAI photos (d)
Figure 2. Relationship between the leaf area index (LAI) estimated by the digital photo method (photos) and by the leaf disc method (discs) in four soybean cultivars, including (a) BMX Apolo®
RR, (b) BRS 284®
, (c) BMX Energia®
RR and (d) FPS Urano® RRin the 2010/2011 growing season in Guarapuava,
Thus, the significant F and the intersection and the abscissa errors were similar for all cultivars (Table 1). The estimated LA regressions for the cultivars in this work had higher R² values than those obtained by Lucena et al. (2011) and by Marrocos et al. (2010). In a study that calibrated the LA method for leaf sizes in chestnut plants, Serdar and Demirsoy (2006) observed that no differences occurred among genotypes, which agrees with the results of this study. Therefore, it is suggested that the leaf disc method is also highly accurate for estimating the LA of soybean cultivars that were not used in the present study (such as BMX
Apolo® RR, BRS 284, BMX Energia® RR and FPS
Urano® RR) when it is used during the entire culture
life cycle. Soybean cultivars are generally compared with many genotypes, which results in multiple plots. The leaf disc method is fast, easy and accurate, which are important advantages for LAI estimations in such studies.
Similar results are presented in Figure 3, which compares the two methods across sowing dates. In this case, the leaf disc method was also efficient. However, the intersection error of the first sowing date is higher than the others sowing dates (Table 1). This difference was probably caused by the higher LAI in the plants from the first sowing date relative to the later sowing dates. Thus, it is suggested that it is necessary to sample a larger number of leaf discs when the LAI of soybean plants is high (for example, more than 10) to obtain high accurate results.
y = 0.913x R² = 0.922***
0 2 4 6 8 10
0 2 4 6 8 10
LA
Id
is
c
s
(a )
y = 0.921x R² = 0.961***
0 2 4 6 8
0 2 4 6 8
LA
I d
isc
s
(b)
y = 0.956x R² = 0.947***
0 1 2 3 4 5
0 1 2 3 4 5
LA
I d
is
c
s
LAI photos (c)
Figure 3. Relationship between the leaf area indexes (LAI) estimated by the digital photo method (photos) and by the leaf disc method (discs) for three sowing dates, including (a) 21/10/2010, (b) 18/11/2010 and (c) 20/12/2010, in Guarapuava, Paraná State. ***: Statistically significant at 0.1%.
Estimating the LA with the leaf disc method for different sowing dates was efficient and accurate, as
indicated by the high R2 (Figure 3). However, Isoda
et al. (2010) observed high variation in the LAI across sowing dates and different environmental conditions. Once that the sowing dates of the present study include the typical regional soybean sowing dates and the variations in the environmental conditions that are faced by the soybean plants, the equations in the Figure 3 can be used to estimate the LAI of the soybean plants in south-central Brazil with high precision.
The leaf disc method for estimating the LAI can be done according to the growth stages of the soybean crop. However, when conducted in this manner, the R² values were smaller than when they were conducted according to cultivars or by sowing dates. Thus, it is preferable that the LA estimations by the leaf disc method are conducted separately according to cultivar or sowing date. This finding is important for researchers and for growers who cultivate several cultivars and/or plant them at different times. In addition, using the leaf disc method resulted in high LA estimations across the various sampling stages (Figure 1), cultivars (Figure 2) and sowing dates (Figure 3). This result demonstrates the robustness and validity of the leaf disc method.
Figure 4 shows the relationship between the LAI values that were determined by either the digital photo method or the leaf disc method for all of the studied samples. The coefficient of determination for this correlation was high (R² = 0.940), which demonstrated the general efficiency of the leaf disc method. In addition, a highly significant F value and a small error (Table 1) occurred as a result of the large sample number.
y = 0.924x R² = 0.940***
0 2 4 6 8 10
0 2 4 6 8 10
LA
I d
is
cs
LAI photos
Figure 4. Relationship between the leaf area indexes (LAI) estimated by the digital photo method (photos) and by the leaf disc method (discs) in the soybean plants during the 2010/2011 growing season in Guarapuava, Paraná State. ***: Statistically significant at 0.1%.
Conclusion
Estimating the leaf area index in soybean plants with the leaf disc method by perforating the central nervure of the leaves resulted in a high coefficient of determination (R²) in comparison with the traditional method. The leaf disc method is a fast, easily applied and reliable method with small errors and coefficients of variation. Thus, the leaf disc method is an efficient method for estimating soybean leaf area in different evaluation situations.
References
ABRAMOFF, M. D.; MAGALHAES, P. J.; RAM, S. J. Image Processing with ImageJ. Biophotonics International, v. 11, n. 7, p. 36-42, 2004.
ADAMI, M.; HASTENREITER, F. A.; FLUMIGNAN, D. L.; FARIA, R. T. Estimativa de área de folíolos de soja usando imagens digitais e dimensões foliares. Bragantia, v. 67, n. 4, p. 1053-1058, 2008.
BENINCASA, M. M. P. Análise de crescimento de plantas: noções básicas. Jaboticabal: Funep, 2003. BRANDELERO, E. M.; PEIXOTO, C. P.; SANTOS, J. M. B. S.; MORAES, J. C. C. M.; SILVA, V. Índices fisiológicos e rendimento de cultivares de soja no recôncavo baiano. Magistra, v. 14, n. 2, p. 77-88, 2002. CÂMARA, G. M. S.; SEDIYAMA, T.; DOURADO NETO, D.; BERNARDES, M. S. Influence of photoperiod and air temperature on the growth, flowering and maturation of soybean (Glycine max (L.) Merrill).
Scientia Agricola, v. 54, n. spe, p. 149-54, 1997.
CUNHA, J. L. X. L.; NASCIMENTO, P. G. M. L.; MESQUITA, H. C.; SILVA, M. G. O.; DOMBROSKI, J. L. D.; SILVA, I. N. Comparação de métodos de área foliar em Chrysobalanus icaco L. Agropecuária Científica no Semi-Árido, v. 6, n. 3, p. 22-27, 2010.
DAMMER, K. H.; WOLLNY, J.; GIEBEL, A. Estimation of the leaf area index in cereal crops for variable rate fungicide spraying. European Journal of Agronomy, v. 28, n. 3, p. 351-360, 2008.
DOMBROSKI, J. L. D.; RODRIGUES, G. S. O.; BATISTA, T. M. V.; LOPES, W. A. R.; LUCENA, R. R. M. Análise comparativa de métodos de determinação de área foliar em pinha (Annona squamosa L.). Revista Verde, v. 5, n. 3, p. 188-194, 2010.
FAVARIN, J. L.; DOURADO NETO, D.; GARCÍA, A. G.; VILLA NOVA, N. A.; FAVARIN, M. G. G. V. Equações para estimativa do índice de área foliar do cafeeiro. Pesquisa Agropecuária Brasileira, v. 37, n. 6, p. 769-773, 2002.
FEHR, W. R.; CAVINESS, C. E. Stages of soybean development. Ames: Iowa State University of Science and Technology, 1977.
FONTES, P. C. R.; DIAS, E. N.; SILVA, D. J. H. Dinâmica do crescimento, distribuição de matéria seca na planta e produção de pimentão em ambiente protegido.
Horticultura Brasileira, v. 23, n. 1, p. 94-99, 2005.
ISODA, A.; MAO, H.; LI, Z.; WANG, P. Growth of high-yielding soybeans and its relation to air temperature in Xinjiang, China. Plant Production Science, v. 13, n. 2, p. 209-217, 2010.
JONCKHEERE, I.; FLECK, S.; NACKAERTS, K.; MUYS, B.; COPPIN, P.; WEISS, M.; BARET, F. Review of methods for in situ leaf area index determination Part I. Theories, sensors and hemispherical photography.
Agricultural and Forest Meteorology, v. 121, n. 1-2, p. 19-35, 2004.
KOTTEK, M.; GRIESER, J.; BECK, C.; RUDOLF, B.; RUBEL, F. World Map of the Köppen-Geiger climate classification updated. Meteorologische Zeitschrift, v. 15, n. 3, p. 259-263, 2006.
KUMAR, R. Calibration and validation of regression model for non-destructive leaf area estimation of saffron (Crocus sativus L.). Scientia Horticulturae, v. 122, n. 1, p. 142-145, 2009.
LIMA, J. F.; PEIXOTO, C. P.; LEDO, C. A. S. Índices fisiológicos e crescimento inicial de mamoeiro (Caricapapaya L.) em casa de vegetação. Ciência e Agrotecnologia, v. 31, n. 5, p. 1358-1363, 2007.
LIU, X.; JIN, J.; HERBERT, S. J.; ZHANG, Q.; WANG, G. Yield components, dry matter, LAI and LAD of soybeans in Northeast China. Field Crops Research, v. 93, n. 1, p. 85-93, 2005.
LOPES, S. J.; BRUM, B.; DOS SANTOS, V. J.; FAGAN, E. B.; DA LUZ, G. L.; MEDEIROS, S. L. P. Estimativa da área foliar de meloeiro em estádios fenológicos por fotos digitais. Ciência Rural, v. 37, n. 4, p. 1153-1156, 2007. LUCENA, R. R. M.; BATISTA, T. M. V.; DOMBROSKI, J. L. D.; LOPES, W. A. R.; RODRIGUES, G. S. O. Medição de área foliar de aceroleira. Revista Caatinga, v. 24, n. 2, p. 40-45, 2011. MARROCOS, S. T. P.; DANTAS, M. S. M.; DOMBROSKI, J. L. D.; LUCENA, R. R. M.; BATISTA, T. M. V. Análise comparativa de métodos de estimativa de área foliar em beterraba. Revista Verde, v. 5, n. 5, p. 140-146, 2010.
MONTEIRO, J. E. B. A.; SENTELHAS, P. C.; CHIAVEGATO, E. J.; GUISELINE, C.; SANTIAGO, A. V.; PRELA, A. Estimação da área foliar do algodoeiro por meio de dimensões e massa das folhas. Bragantia, v. 64, n. 1, p. 15-24, 2005.
MOTTA, I. S.; BRACCINI, A. L.; SCAPIM, C. A.; GONÇALVES, A. C. A.; BRACCINI, M. C. L. Características agronômicas e componentes da produção de sementes de soja em diferentes épocas de semeadura.
Revista Brasileira de Sementes, v. 22, n. 2, p. 153-162, 2000.
PEKSEN, E. Non-destructive leaf area estimation model for faba bean (Vicia faba L.). Scientia Horticulturae, v. 113, n. 4, p. 322-328, 2007.
SERDAR, Ü.; DEMIRSOY, H. Non-destructive leaf area estimation in chestnut. Scientia Horticulturae, v. 108, n. 2, p. 227-230, 2006.
TAVARES JÚNIOR, J. E; FAVARIN, J. L.; DOURADO NETO, D.; MAIA, A. H. N.; FAZUOLI, L. C.; BERNARDES, M. S. Análise comparativa de métodos de estimativa de área foliar em cafeeiro. Bragantia, v. 61, n. 2, p. 199-203, 2002.
TOEBE, M.; BRUM, B.; LOPES, S. J.; CARGNELUTTI FILHO, A.; DA SILVEIRA, T. R. Estimativa da área foliar de
Crambe abyssinica por discos foliares e por fotos digitais.
Ciência Rural, v. 40, n. 2, p. 445-448, 2010.
Received on March 7, 2012. Accepted on July 17, 2012.