Printed version ISSN 0001-3765 / Online version ISSN 1678-2690 http://dx.doi.org/10.1590/0001-3765201720160666
www.scielo.br/aabc
Soil-vegetation relationships and community structure in a
“terra-firme”-white-sand vegetation gradient in Viruá National Park, northern Amazon, Brazil
BRUNO A.F. DE MENDONÇA1
, ELPÍDIO I. FERNANDES FILHO2
, CARLOS E.G.R. SCHAEFER2, JÚLIA G.F. DE MENDONÇA3 and BRUNO N.F. VASCONCELOS2
1
Departamento de Silvicultura, Instituto de Florestas, Universidade Federal Rural do Rio de Janeiro, BR 465, Km 7, 23897-005 Seropédica, RJ, Brazil
2
Departamento de Solos, Universidade Federal de Viçosa, Avenida Peter Henry Rolfs, s/n, Campus Universitário, 36570-900 Viçosa, MG, Brazil
3
Instituto de Ciências Biológicas, Universidade Federal de Juiz de Fora, Rua José Lourenço Kelmer, s/n, Martelos, 36036-330 Juiz de Fora, MG, Brazil
Manuscript received on October 4, 2016; accepted for publication on January 2, 2017
ABSTRACT
Viruá National Park encompasses a vast and complex system of hydromorphic sandy soils covered largely by the white sand vegetation (“Campinarana”) ecosystem. The purpose of this study was to investigate a vegetation gradient of “terra-firme”-white sand vegetation at the Viruá National Park. Nine plots representing three physiognomic units were installed for floristic and phytosociological surveys as well as to collect composite soil samples. The data were subjected to assessments of floristic diversity and similarity, phytosociological parameters and to statistical analyses, focused on principal components (PC) and canonical correspondence analysis (CCA). The vegetation of the Campinaranas types and Forest differed in biomass and species density. Ten species, endemic to Brazil, were particularly well-represented. PC and CCA indicated a clear distinction between the studied plots, based on measured soil variables, especially base sum and clay, which were the most differentiating properties between Campinarana and Forest; For the separation of the Campinarana types, the main distinguishing variable was organic matter content and cation exchange capacity. Higher similarity of Campinaranas was associated to a monodominant species and the lower similarity of Forest was related to the high occurrence of locally rare species.
Key words: Amazon, Campinarana, Canonical correlation, Monodominant species, Phytosociology.
Correspondence to: Bruno Araujo Furtado de Mendonça E-mail: [email protected]
INTRODUCTION
Viruá National Park (VVNP), located in south-central Roraima, in the lower Rio Branco region, covers an area of 227,011 ha, of which about 60% belong to the Campinarana ecosystem (Mendonça et al. 2013). The name “Campinarana” refers to
a vegetation type of the Amazon region, typical
in humid climate, on sandy, predominantly
hydromorphic soils, also called white-sand
vegetation (Anderson 1981). Campinaranas are
characterized by a particular landscape that stands
An Acad Bras Cienc (2017) 89 (2)
1270 BRUNO A.F. DE MENDONÇA et al.
levels, which affect phytophysiognomic nuances associated with different levels of hydromorphism. With increasing waterlogging of the soil, the forested Campinarana are replaced by arboreous Campinarara formations, then by grassy-woody and finally by purely herbaceous Campinarana, with characteristics of marshy grassland (Mendonça et al. 2013, Mendonça et al. 2014a).
Located on large patches of sandy soil, Campinaranas are found from the upper Rio Negro beyond the north-northwest of Brazil to the region of Vaupés and Caquetá in Colombia to southern Venezuela, in large areas of the upper Tapajós river, along the right hand banks of the Rio Madeira, and also in small patches, e.g., vegetation enclaves, in southwestern Amazonia (IBGE 1992, Duivenvoorden 1996, Oliveira and Daly 2001, Alonso 2002, Silveira 2003, Poleto and Aleixo 2005, Daly et al. 2016, Adeney et al. 2016). In the Peruvian Amazon, a similar vegetation on sandy soils is called “varillales”, which is known in the forests of Guyana as “wallaba” (Anderson 1981, Oliveira and Daly 2001, Alonso 2002, Adeney et al. 2016). On the plains of the Brazilian coastline, the “restinga” forests and “mussunungas” have features that are very similar to those of the Campinaranas, with some species and many genera of plants in common (Anderson 1981, Oliveira and Daly 2001, Boeger and Wisniewski 2002, Prance 1996, Meira Neto 2005, Sarcinelli 2010, Saporetti-Junior et al. 2012).
In some regions, the Campinaranas have monodominant formations, in which most plants belong to a single species. In Guyana, Eperua falcata is predominant in some formations, while in the region of the upper Rio Negro, both in Venezuela and Brazil, curuni (Micrandra spruceana) can dominate (Oliveira and Daly 2001). Pires (1973) uses the term “Umirizal” for formations with predominance of Humiria floribunda. Lisbôa (1975) calls formations where Aldina heterophylla or Aldina latifolia are predominant “Macucuzal”.
However, other locations may have species that stand out without any specific predominance. Throughout the entire Rio Negro basin, there are also monodominant formations of palm trees on sandy and waterlogged soils, for example, on huge interfluves at the Jaú National Park, dominated by caranã (Mauritia carana) (Oliveira and Daly 2001). From the pedological point of view, the Campinaranas are situated on a large domain of Spodosols and Quartzipsamments developed on quartz sand resulting from clay hydrolysis and/or impoverishment by clay loss or selective erosion (Bravard and Righi 1990). Some studies in French Guiana and Brazil have shown that these Spodosols can be formed by the transformation of an initial latosolic cover on various types of parent material (Lucas et al. 1984, Andrade 1990, Dubroeucq et al. 1991); the Spodosol is considered a final degradation stage of the tropical soil covers (Boulet et al. 1984). Other studies indicate a soil development in the sense of Spodosols towards the formation of Histosols, with thick peat layers (Bonifacio et al. 2006, Dubroeucq and Volkoff 1998), often affected by frequent flooding.
In the contact areas with rainforest, in transition areas to latosolic cover, the Campinaranas have transitional features. The purpose of this study was to investigate a vegetation gradient at the VNP, from forest (“terra-firme”) to white-sand vegetation (“Campinaranas”), including a focus on the subgroups Forested and Arboreous Campinaranas, and to describe the main soil-vegetation relationships and the community structure. Thus, we hypothesized that variation in vegetation structure and composition is related to soil chemical and physical attributes.
MATERIALS AND METHODS
STUDY AREA
classification of Veloso et al. (1991): Open Ombrophilous Forest (OF); Forested Campinaranas (FC) and Arboreous Campinaranas (AC) (Figure 1). The sequence of locations was distributed in the following geographical ranges, respectively: from 61°0’43’’W to 1º28’’52’’N (OF), from 60°58’ 30’’W to 1º18’7’’N (FC), and from 60º58’27’’W to 1º18’6’’N (AC).
According to Köppen’s climate classification, the climate of the northeast sector of the Park is Aw (humid summer and dry winter), where the OF plots were established. The Campinaranas plots were marked in the central-eastern sector, defined in the transition to Amw (monsoonal rain). In general, the regional climate is typically equatorial, with strong and torrential rains, interrupted by a short dry period (Brasil 1975).
The soils of the OF plots were on clayey soils, developed from alkaline volcanic rocks of the Iricoumé Group (Brasil 1975). Oxisols and Inceptisols were predominant and located, in a gentle undulated to undulated terrain (Mendonça et al. 2013). Chemical and physical properties of a Typic Hapludox located in the study area were show in Table I.
The Spodosols are the main soils of the Campinarana landscapes in the VNP (Mendonça et al. 2013). These soils were developed from reworked Pre-Cambrian source material, sediments of the Plio-Pleistocene age (Brasil 1975). These geological units are mostly represented by deep sand beds, which suffered an in situ pedogenesis, as pointed out in studies in the State of Amazonas (Andrade et al. 1997, Bravard and Righi 1990, Lucas et al. 1984). High rainfall rates contribute directly to the processes of podzolization and arenization of the soils which in turn, are associated with high leaching and consequent chemical impoverishment (Schaefer et al. 2008). Table I shows the chemical and physical properties of two Spodosols in the study area.
These soils occur in the two Campinarana types (FC and AC); however they show some variations in organic carbon content, according to the geomorphic conditions and vegetation biomass. The FC soil has higher levels of organic carbon and occurs at slightly higher topographic levels, about 0.4 to 1.0 meter above AC, which is enough to prevent flooding of these soils. On the other hand, soils from the AC experience annual flooding. The O horizon only occurs at the FC, being 10 cm thick and rich in fine roots and at the AC soil the E horizons are thicker and albic (Table I).
Vegetation description
Two main vegetation types are notable in the landscape of the VNP: OF and the Campinaranas types. OF in the VNP occur in the low mountains (“Serra da Perdida” and “Serra do Preto”) and surroundings (Figure 1 - a), with highly clayey soils derived from acid volcanic rocks. For this reason, these environments are covered by rainforest vegetation, mapped by the radar survey project RADAMBRASIL (Brasil 1975) as an area of ecological tension in Open Ombrophilous Forest, in which forest growth is also favored by the transitional climate.
The Campinaranas under study, on mostly sandy soils, were divided into two vegetation types: FC and AC. In FC, the groundwater level does usually not reach the surface, which allows a greater vegetation height, consisting of a forest physiognomy with relatively thin trees (Figure 1 - b), up to 15 m tall. The trees have straight, little twisted or untwisted stems (Figure 1 - b) and form an almost continuous canopy, sometimes more open. In the AC, the vegetation is shorter and poorer (Figure 1 - c).
An
Acad Bras Cienc
(2017)
89
(2)
1272
BRUNO
A.F
. DE MENDONÇA
et al.
TABLE I
Chemical and physical properties of a soil sequence in plots studied in the Viruá National Park, in south-central Roraima.
Horizons (cm)
pH H2O
P K Na Ca Mg Al H+Al BS CEC V m OM Prem CS FS Silt Clay
--- mg dm-3
--- --- cmolc dm-3
--- --- % --- dag
kg-1 mg L-1 --- dag kg-1
---P1 –Typic Hapludox – Open Ombrophilous Forest
A (0-5) 4.09 1.9 22 0 0.1 0.55 0.86 5.3 0.71 6.01 11.8 54.8 2.18 41.3 35 30 15 20
Bw (5-55) 4.62 0.3 0 0 0 0.51 1.05 3.9 0.51 4.41 11.6 67.3 1.28 35.1 26 28 17 29
BC
(55-90) 4.79 0.3 0 0 0 0.49 0.67 3.1 0.49 3.59 13.6 57.8 0.77 34.9 25 27 12 36
Termites* 4.35 2.2 38.3 1.6 0.7 0.90 1.4 11.3 1.73 13.0 12.6 49.7 8.74 32.0 22 20 20 38 P2 - Typic Haplorthods– Forest Campinarana
O (0-10) 3.82 0.6 33 38.1 0.02 0.49 3.71 26.7 0.76 27.46 2.8 83 55.02 59.9 19 26 29 26
A (10-15) 4.52 2.2 15 11.9 0 0.45 3.24 21.1 0.54 21.64 2.5 85.7 11.2 24.8 23 40 26 11
AE
(15-23) 4.95 2.1 3 0.9 0 0.42 1.43 11.9 0.43 12.33 3.5 76.9 4.8 18.6 18 51 23 8
Bh
(23-80) 5.29 0.6 0 0 0 0.43 0.67 9.3 0.43 9.73 4.4 60.9 3.84 12.1 16 47 27 10
Bhs
(80-120) 4.98 0.6 0 0 0 0.42 0.29 3.8 0.42 4.22 10 40.8 1.28 22.5 17 47 27 9
C (120-180+
) 4.75 0.4 0 0 0 0.41 0.19 1.6 0.41 2.01 20.4 31.7 0.26 46.6 20 45 20 15
Termites* 3.76 17.2 120.7 70.5 0.14 0.27 5.54 54.7 1.03 55.73 1.83 84 52.7 54.3 40 12 34 14 P3 - Oxyaquic Haplorthods– Arboreous Campinarana
A (0-10) 4.22 4.9 30 8.3 0.08 0.09 1.33 9.8 0.29 10.09 2.9 82.1 6.14 59.9 20 53 23 4
E (10-60) 4.8 1 0 0 0.03 0.04 0.31 1.5 0.07 1.57 4.5 81.6 0 60 30 49 20 1
Bh
(60-80) 4.26 4.1 4 0 0.01 0.04 1.54 9.3 0.06 9.36 0.6 96.3 1.03 36.2 25 48 24 3
Bhs
(80-100) 4.82 1 0 0 0 0.04 1.33 2.5 0.04 2.54 1.6 97.1 2.58 7.1 22 46 24 8
C1
(100-140) 4.69 0.5 1 0 0.17 0.04 0.51 2.2 0.21 2.41 8.7 70.8 0.13 44.4 18 48 20 14
C2
(140-200) 4.79 0.4 1 0 0.06 0.04 0.51 1.7 0.1 1.8 5.6 83.6 0 47.9 18 49 19 14
Termites* 3.54 8.3 88.7 34.2 0.08 0.31 5.23 53.7 0.76 54.46 1.4 87.2 37.2 54.7 11 21 45 23
pH H20 with 1:2.5 relationship; P - Na - K - Mehlich 1 extactor; Ca - Mg - Al - KCl (1 mol L-1) extractor; H + Al - Calcium Acetate (0.5 mol/L - pH 7.0) extractor; OM (organic matter) = C.Org x 1.724 - Yeomans and Bremner (1988); BS = Bases Sum; CEC - Cation Exchange Capacity at pH 7.0; V = Bases saturation; m = Al saturation; Prem = CaCl2 10 mmol L-1
Figure 1 - Overview of the Serra da Perdida mountains, covered by Open Ombrophilous Forest and a profile of the Typic Hapludox, from the Open Forest plot (a), view of the understory of a forested Campinaranas and a profile of a Typic Haplorthods profile of this area (b); Arboreous Campinarana
An Acad Bras Cienc (2017) 89 (2)
1274 BRUNO A.F. DE MENDONÇA et al.
in the surface mineral horizons of the surrounding soils (Table I). Under these conditions, the termite mounds, aside from releasing nutrients, improve soil aeration and favor the survival of the plants on these constantly flooded soil.
COLLECTION AND ANALYSIS OF SOIL AND LITTER
Five representative samples were collected consisting of soil and forest litter (layers 0-10 cm and 10-20 cm) from all plots (OF, FC and AC). All litter samples were sent to a laboratory to determine N, P, K, Ca and Mg levels, as described by Malavolta et al. (1997). The soil was ground and sieved (2 mm mesh) to obtain air-dried fine earth (ADFE) samples for the routine chemical and physical analyses, according to Embrapa (1997). The soils were classified according to the Soil Taxonomy (Soil Survey Staff 1999).
Chemical analysis
The pH was determined in water and in 1 mol L-1 KCl (soil:solution 1:2.5). The concentrations of Ca, Mg and exchangeable Al were extracted with 1 mol L-1 KCl, at a 1:20 ratio, and determined by AAS (Atomic Absorption Spectrometry). Exchangeable K and Na were extracted with Mehlich-1 solution and determined by flame photometry. Phosphorus was extracted with 0.05 mol L-1 HCl and 0.025 mol L-1 H2SO4 (Mehlich - 1) and determined by ascorbic acid colorimetry (Defelipo and Ribeiro 1997). Iron, zinc, manganese and copper were extracted with Mehlich-1 solution and determined by AAS. The potential acidity was determined by titration with NaOH (0.025 mol L-1) of the extraction of 0.5 mol L-1 calcium acetate at pH 7.0. The remaining phosphorus (Prem) is a quantite of phosphate in equilibrium solution with answers to a 60 mg L-1 phosphate concentration adds in soil with a 1:10 soil/solution relation (Donagemma et al. 2008), and was determined by CaCl2 10 mmol
L-1 solution (Novais and Smyth 1999). The Total Organic Carbon (TOC) was determined by the method of Yeomans and Bremner (1988) and the humic substances were fractionated by the method adapted from Swift (1996) (Mendonça and Matos 2005).
Physical analyses
The particle size was determined by dispersing 10 g of ADFE in 0.1 mol L-1 NaOH and shaking
at 50 rpm for 16 hours. Then, the coarse and fine sand fractions were separated by wet sieving (mesh size 0.2 mm and 0.053 mm, respectively). The clay fraction was determined by the pipette method and the silt fraction calculated as the difference (Ruiz 2005).
FLORISTICS AND COMMUNITY STRUCTURE
Three 20 x 20 m plots per vegetation type (OF, FC and AC) were installed for vegetation sampling. For the OF and FC, the limit for inclusion of a tree was the circumference at breast height (CBH) > 10 cm. In the AC, the limit of inclusion was the circumference at soil height (CSH) > 3 cm.
The plant material was identified based on specific literature and comparisons with specimen of the herbarium of the National Institute of Amazonian Research and deposited in the herbarium of the Department of Plant Biology, Federal University of Viçosa. To update the specific binomials, the species index of the Royal Botanic Gardens Kew (1993) was used and the information available at site of the Missouri Botanical Garden was accessed (http://www.mobot.org/W3T/search/ vast.html, October 2009). The classification adopted was APG III (The Angiosperm Phylogeny Group 2009).
parameters (Mueller-Dombois and Ellenberg 1974): absolute density (AD), relative density (RD), absolute dominance (ADo), relative dominance (RDo), absolute frequency (AF), relative frequency (RF), cover value (CV) and importance value ( IV).
The vegetation was evaluated for the floristic similarity between the studied types. A matrix of species presence and absence was constructed from which the floristic similarity was calculated using the Sørensen index (Mueller-Dombois and Ellenberg 1974). The dendrogram was constructed by the UPGMA method (unweighted pair-group method using arithmetic averages). The similarity analysis was performed using the software package PC-ORD (McCune and Mefford 1999).
STATISTICAL ANALYSIS
From the results of the chemical and physical variables of the soil and litter samples, the mean and standard deviation were computed. A total of 15 replicates per vegetation were used, with five replicates per plot and three plots per vegetation type. For a discussion of the chemical and physical properties of soil and litter, means were subjected to a t test at a significance level p <0.05, comparing the averages separately for each evaluated soil or litter property, using the software Statistica 6 (Statsoft Inc. 2003).
For the correlation analyses between environmental variables (soil properties in the 0-10 cm layer) and the species abundance, principal components (PC) and canonical correspondence analysis (CCA) was used (Ter Braak 1987). We use all (eight) edaphic variables and summarize these variables into a PC axis, before applying CCA methods. For testing whether edaphic conditions significantly explain variation in community composition, we apply a variation partitioning methods, including spatial vectors of all plots with the respective geographic coordinates, according to Peres-Neto et al. (2006) and Borcard et al.
(2011). For these analyses we use R functions (R Development Core Team 2011) indicated at Borcard et al. (2011).
CCA allows a direct gradient ordination analysis, and try to explains the species distribution in relation to the PCs, a representation of the environmental variables (Ter Braak 1987, 1995). Thus, three matrices were prepared as follows: a vegetation matrix with the values of species density per plot, an environmental matrix with the soil analysis data, and a spatial matrix with the geographical coordinates of the center of each plots. The ordination diagram was performed using the software Fitopac 2 (Shepherd 1995).
The values of the species abundance matrix were transformed by their natural logarithm (x = ln(y + 1)), to standardize the data of species abundance, with few high and many low values (Rodrigues et al. 2007). The vegetation matrix was composed of 26 species, representing the 10 most abundant species of each vegetation type. The soil matrix was composed with the following variables: phosphorus (P), aluminum (Al), bases sum (BS), cation exchange capacity at pH 7 (CEC), organic matter (OM), coarse sand (CS), fine sand (FS), and clay. The Monte Carlo test was used with 99 permutation to test the significance of correlations between the species and environmental variables detected by CCA using Fitopac 2 (Shepherd 1995).
RESULTS AND DISCUSSION
SOIL-VEGETATION RELATIONS
Soil chemical and physical characterization
An
Acad Bras Cienc
(2017)
89
(2)
1276
BRUNO
A.F
. DE MENDONÇA
et al.
TABLE II
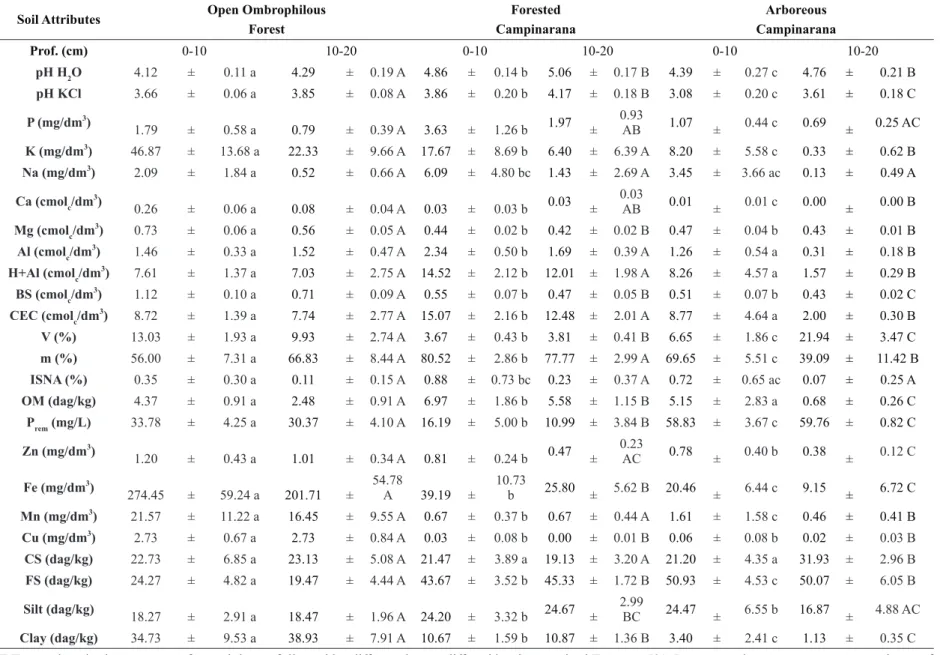
Soil chemical and physical properties in the 0-10 and 10-20 layers of the vegetation types studied in the Viruá National Park, Roraima. The data are represented by the plot averages and their standard deviations.
Soil Attributes Open Ombrophilous
Forest
Forested Campinarana
Arboreous Campinarana
Prof. (cm) 0-10 10-20 0-10 10-20 0-10 10-20
pH H2O 4.12 ± 0.11 a 4.29 ± 0.19 A 4.86 ± 0.14 b 5.06 ± 0.17 B 4.39 ± 0.27 c 4.76 ± 0.21 B
pH KCl 3.66 ± 0.06 a 3.85 ± 0.08 A 3.86 ± 0.20 b 4.17 ± 0.18 B 3.08 ± 0.20 c 3.61 ± 0.18 C
P (mg/dm3 )
1.79 ± 0.58 a 0.79 ± 0.39 A 3.63 ± 1.26 b 1.97 ±
0.93
AB 1.07 ± 0.44 c 0.69 ± 0.25 AC
K (mg/dm3
) 46.87 ± 13.68 a 22.33 ± 9.66 A 17.67 ± 8.69 b 6.40 ± 6.39 A 8.20 ± 5.58 c 0.33 ± 0.62 B
Na (mg/dm3
) 2.09 ± 1.84 a 0.52 ± 0.66 A 6.09 ± 4.80 bc 1.43 ± 2.69 A 3.45 ± 3.66 ac 0.13 ± 0.49 A
Ca (cmolc/dm3 )
0.26 ± 0.06 a 0.08 ± 0.04 A 0.03 ± 0.03 b 0.03 ±
0.03
AB 0.01 ± 0.01 c 0.00 ± 0.00 B
Mg (cmolc/dm3
) 0.73 ± 0.06 a 0.56 ± 0.05 A 0.44 ± 0.02 b 0.42 ± 0.02 B 0.47 ± 0.04 b 0.43 ± 0.01 B
Al (cmolc/dm3
) 1.46 ± 0.33 a 1.52 ± 0.47 A 2.34 ± 0.50 b 1.69 ± 0.39 A 1.26 ± 0.54 a 0.31 ± 0.18 B
H+Al (cmolc/dm3) 7.61 ± 1.37 a 7.03 ± 2.75 A 14.52 ± 2.12 b 12.01 ± 1.98 A 8.26 ± 4.57 a 1.57 ± 0.29 B
BS (cmolc/dm3
) 1.12 ± 0.10 a 0.71 ± 0.09 A 0.55 ± 0.07 b 0.47 ± 0.05 B 0.51 ± 0.07 b 0.43 ± 0.02 C
CEC (cmolc/dm3
) 8.72 ± 1.39 a 7.74 ± 2.77 A 15.07 ± 2.16 b 12.48 ± 2.01 A 8.77 ± 4.64 a 2.00 ± 0.30 B
V (%) 13.03 ± 1.93 a 9.93 ± 2.74 A 3.67 ± 0.43 b 3.81 ± 0.41 B 6.65 ± 1.86 c 21.94 ± 3.47 C
m (%) 56.00 ± 7.31 a 66.83 ± 8.44 A 80.52 ± 2.86 b 77.77 ± 2.99 A 69.65 ± 5.51 c 39.09 ± 11.42 B
ISNA (%) 0.35 ± 0.30 a 0.11 ± 0.15 A 0.88 ± 0.73 bc 0.23 ± 0.37 A 0.72 ± 0.65 ac 0.07 ± 0.25 A
OM (dag/kg) 4.37 ± 0.91 a 2.48 ± 0.91 A 6.97 ± 1.86 b 5.58 ± 1.15 B 5.15 ± 2.83 a 0.68 ± 0.26 C
Prem (mg/L) 33.78 ± 4.25 a 30.37 ± 4.10 A 16.19 ± 5.00 b 10.99 ± 3.84 B 58.83 ± 3.67 c 59.76 ± 0.82 C
Zn (mg/dm3 )
1.20 ± 0.43 a 1.01 ± 0.34 A 0.81 ± 0.24 b 0.47 ±
0.23
AC 0.78 ± 0.40 b 0.38 ± 0.12 C
Fe (mg/dm3 )
274.45 ± 59.24 a 201.71 ±
54.78
A 39.19 ±
10.73
b 25.80 ± 5.62 B 20.46 ± 6.44 c 9.15 ± 6.72 C
Mn (mg/dm3
) 21.57 ± 11.22 a 16.45 ± 9.55 A 0.67 ± 0.37 b 0.67 ± 0.44 A 1.61 ± 1.58 c 0.46 ± 0.41 B
Cu (mg/dm3) 2.73 ± 0.67 a 2.73 ± 0.84 A 0.03 ± 0.08 b 0.00 ± 0.01 B 0.06 ± 0.08 b 0.02 ± 0.03 B
CS (dag/kg) 22.73 ± 6.85 a 23.13 ± 5.08 A 21.47 ± 3.89 a 19.13 ± 3.20 A 21.20 ± 4.35 a 31.93 ± 2.96 B
FS (dag/kg) 24.27 ± 4.82 a 19.47 ± 4.44 A 43.67 ± 3.52 b 45.33 ± 1.72 B 50.93 ± 4.53 c 50.07 ± 6.05 B
Silt (dag/kg)
18.27 ± 2.91 a 18.47 ± 1.96 A 24.20 ± 3.32 b 24.67 ±
2.99
BC 24.47 ± 6.55 b 16.87 ± 4.88 AC
Clay (dag/kg) 34.73 ± 9.53 a 38.93 ± 7.91 A 10.67 ± 1.59 b 10.87 ± 1.36 B 3.40 ± 2.41 c 1.13 ± 0.35 C
T Test; values in the same row, for each layer, followed by different letters differed by the unpaired T test, at 5%. Lowercase letters represent comparisons of
between each vegetation type. In the 10-20 cm layer, the soil pH was slightly higher (4.29 - 5.06), with significant differences (p <0.05) between OF and the Campinaranas types. The OM content and Al (m%) and Na saturation in the soil were highest in the FC, followed by AC and OF. In the 0-10 cm layer, the OM content and exchangeable aluminum in the FC differed significantly (p <0.05) from the other vegetation types. The P content in FC was more than twice as high as in the OF and AC, with significant differences (p <0.05), which can be related with their higher OM content. The contents of exchangeable Ca and K and sum of bases (SB) increased towards the more forested vegetation types, associated with a higher clay content (Mendonça et al. 2013). The increase of exchangeable bases may be related to stemflow and canopy throughfall (natural cycling) and due to the occurrence of clay minerals richer in bases.
The soils under the Campinaranana vegetation types are quartz-sandy and have a high content of fine sand (twice as high as in the OF), associated with wind-reworked sedimentary rocks of the Içá Formation (Brasil 1975, Carneiro Filho et al. 2003, Mendonça et al. 2013). There is a gradual decrease in the clay soils of the OF, for FC and AC soils, respectively, and inversely with fine sand; both (clay and fine sand) with significant differences (p <0.05) between the vegetation types. The higher clay content in forest soils is associated with the soil source material, composed of feldspar-rich basic volcanic rocks (Brasil 1975).
The AC soils had larger deviations for the OM amount in the surface layer, due to the more open vegetation type, which means a more sparse supply of plant biomass. The values of K, Ca, Mg, base saturation, Zn, Fe, Mn, Cu, and clay in the OF soils are higher than that in the Campinaranas types, with significant differences (p <0.05) in the 0-10 cm layer. The Prem is lowest in FC soil and is associated with the highest levels of exchangeable Al and of CEC, possibly because of the occurrence
of Al-rich low crystallinity material with strong phosphate adsorption (Mendonça et al. 2014b).
Chemical characterization of litter
The chemical data of the forest litter of each vegetation type are listed in Table III. In the chemical analysis, the highest phosphorus (P) content was detected in total litter from the FC. The highest P soil content in this vegetation type (Table II), together with the litter contents, indicates that the organic P was incorporated in the soil matrix, certainly associated with more decomposed organic material.
Nitrogen contents were highest in the AC litter, followed by FC and OF, although the values were not statistically different (p <0.05). In the OF litter, the levels of the elements K, Ca, Mg, Zn, Fe, Cu, and Mn were significant, 2-80 times higher than in the Campinaranas litter. The iron (Fe) contents were very high (80 times higher) in the OF, possibly due to the presence of mineral particles (iron oxides) in the litter. The Fe levels were higher in the litter of the AC litter than of the FC, although at a lower proportion in soils of the former than of the latter. The soil and litter of OF contained significantly higher levels of Zn, Fe, Mn, Cu, followed by FC and AC, suggesting the presence of these elements in nutrient cycling and soil matrix.
Environmental variables and species distribution
Canonical Correspondence Analysis
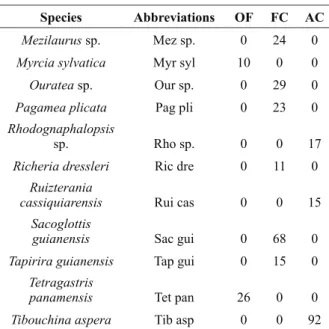
The Canonical Correspondence Analysis (CCA) was used to evaluate the 26 most abundant species of the 117 listed. Table IV shows the abbreviated names and abundance of the species. The edaphic variables with respective scores and PC eigenvalues and explanation proportion are represented in Table V.
An Acad Bras Cienc (2017) 89 (2)
1278 BRUNO A.F. DE MENDONÇA et al.
importance to CS. PC2 indicates a positive score only for FS, and negative for all others variables, with the highest negative scores on Clay, BS, Al, P and CEC. Despite the low importance of PC3 (14%), it show a relevant positive score for Clay and a high negative score for CS.
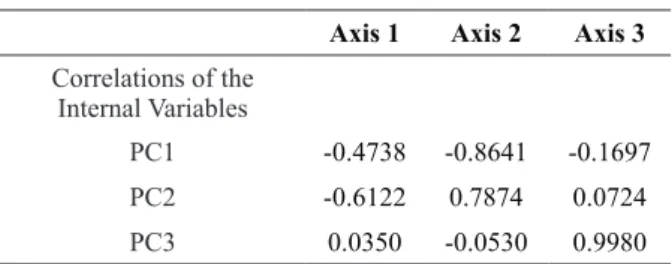
CCA results with the eigenvalues found in the ordination analysis of PCs, which summarize soil variables, for axes 1 and 2 (Table VI) were considered high (> 0.5), according to Ter Braak (1995). The three axes explained 40.91% (axis 1), 31.4% (axis 2) and 4.0% (axis 3) of the variance; total variance was 76,3%. The high cumulative value indicates high positive correlations between the PCs and the species.
The Monte Carlo permutation test indicated that these densities were also significantly correlated with the environmental variables used, with p = 0.01 for axis 1 and p = 0.01 for axis 2 (Table V).
The three groups of plots were clearly separated, with strong correlations for PC1, PC2 and PC3, representing the scores of edaphic variables which distinguished the Campinarana types from Forest (“terra-firme”) (Figure 2). Axis 1 had a strong negative correlation with the PC1 and PC2, which shows the highest negative scores for BS and Clay variables, representing the most differentiating properties between Campinarana and Forest. Thus, the OF was more distant from the other vegetation types (Campinaranas), with differentiated soil conditions, e.g., higher BS and clay values. PC3 indicate a weakness positive correlation in Axis 1, but suggests the importance of Clay and CS variables for separation of Campinarana types and Forest.
Duivenvoorden (1995) also uses CCA to separate Colombian forest types, which the most frequently found tree species are listed according to their preference with respect to drainage, flooding, and soil nutrient status. Fine et al. (2005) in a soil-vegetation relationships study of Burseraceae
trees in Peru and Ecuador found a contribution of edaphic heterogeneity into the evolution and diversity of these family, also differentiating the white-sand and clayey soils. Other studies also indicate that soil factors may play an important role for species distribution, even at local and broader scale (Tuomisto et al. 2003, Poulsen et al. 2006, ter Steege et al. 2006).
Positive correlation in PC1, which have high positive scores for P, Al, CEC and OM, in FC plots, and the negative correlation in PC2 in the AC plots, with a negative score for these variables, indicate a strong differentiating soil conditions for Campinaranas vegetation types, especially by OM content and Cation Exchange Capacity, corroborating with others studies (Mendonça et al. 2013, 2014b). In general, the most abundant species form differentiated groups for each formation (Table V). Only a few species are found in both Campinarana types and are little distant from the groups, e.g., Humiria balsamifera and Andira micrantha (Figure 2). These species seem to play an important role in the colonization and formation of new and more arboreous areas in the transition between the vegetation types (Forest-Campinarana), respectively.
VARIATION PARTITIONING
Figure 2 - Ordination diagram of canonical correspondence analysis (CCA) of the axis 1-2 based on Principal Components of edaphic variables scores and absolute plant densities on plots of the Open Ombrophilous Forest (F), Forested Campinarana (C) and Arboreous Campinarana (A), in the National Park of Viruá , Roraima.
TABLE III
Chemical properties of the forest litter of three vegetation types in the Viruá National Park, Roraima. The data are
represented by plot means and their standard deviations, followed by the T test.
Litter Attributes Open Ombrophilous
Forest Forested Campinarana
Arboreous Campinarana
N (dag/kg) 1.08 ± 0.33 a 1.13 ± 0.11 a 1.15 ± 0.13 a
P (dag/kg) 0.03 ± 0.01 a 0.04 ± 0.00 b 0.01 ± 0.00 c
K (dag/kg) 0.14 ± 0.08 a 0.08 ± 0.01 b 0.05 ± 0.00 c
Ca (dag/kg) 0.67 ± 0.16 a 0.08 ± 0.03 b 0.12 ± 0.06 c Mg (dag/kg) 0.16 ± 0.07 a 0.04 ± 0.02 b 0.04 ± 0.02 b Zn (mg/kg) 12.96 ± 3.77 a 6.31 ± 1.53 b 7.71 ± 1.51 c Fe (mg/kg) 8293.63 ± 5959.46 a 96.63 ± 23.74 b 465.39 ± 253.23 c Mn (mg/kg) 410.49 ± 173.70 a 34.69 ± 7.59 b 50.19 ± 31.23 b Cu (mg/kg) 18.82 ± 7.25 a 2.03 ± 2.15 b 1.53 ± 0.60 b T Test; values in the same row followed by different capital letters differ by the unpaired T test, at 5%.
and 17% was not explained. The highest value for spatial components (0.556 + 0.186) could be related to the short distance of Campinaranas plots (FC and AC) compared to Forest plots (OF). Generally, the Campinaranas vegetation types occurs in a mosaic of complex seasonally flooded forested and nonforested environments, and in the most cases with greatest differences in the vegetation physiognomy in short distances (Mendonça et al. 2013, 2014a).
FLORISTICS AND COMMUNITY STRUCTURE
A total of 1,335 individuals steams were
sam-pled (1307 alive and 28 dead) in three distinct
vegetation types of the VNP: OF (169 plants),
FC (561 plants) and AC (578 plants).
Altoge-ther, 117 species were identified in 73 genera
and 37 families.
The following families with the highest number
An Acad Bras Cienc (2017) 89 (2)
1280 BRUNO A.F. DE MENDONÇA et al.
Figure 3 - Variation partitioning for the “terra-firme”-Campinarana gradient explained by soil variable (X1) and spatial location (X2) of each plots.
TABLE IV
Species considered in the calculation of canonical correlation analysis (CCA), represented by 10 or more
plants in the sampling in the Viruá National Park, Roraima. Open Ombrophilous Forest (OF), Forested Campinarana (FC) and Arboreous Campinarana (AC).
Species Abbreviations OF FC AC
Andira micrantha And mic 1 25 0
Astrocaryum
gynacanthum Ast gyn 13 0 0
Barcella odora Bar odo 0 0 30
Calyptrantes
cusipdata Cal cus 0 0 41
Clusia regneriodes Clu reg 0 25 0
Faramea torquata Far tor 0 29 0
Ferdinandusa
goudotiana Fer gou 0 18 0
Guatteria foliosa Gua fol 0 16 0
Humiria
balsamifera Hum bal 0 8 42
Humiriastrum
cuspidatum Hum cus 0 11 0
Ilex sp. Ile sp. 0 8 249
Licania
heteromorpha Lic het 0 137 0
Macrolobium
bifolium Mac bif 0 0 16
Malpighiaceae sp. Mal sp. 0 0 43
Matayba opaca Mat opa 0 17 0
Species Abbreviations OF FC AC
Mezilaurus sp. Mez sp. 0 24 0
Myrcia sylvatica Myr syl 10 0 0
Ouratea sp. Our sp. 0 29 0
Pagamea plicata Pag pli 0 23 0
Rhodognaphalopsis
sp. Rho sp. 0 0 17
Richeria dressleri Ric dre 0 11 0
Ruizterania
cassiquiarensis Rui cas 0 0 15
Sacoglottis
guianensis Sac gui 0 68 0
Tapirira guianensis Tap gui 0 15 0
Tetragastris
panamensis Tet pan 26 0 0
Tibouchina aspera Tib asp 0 0 92
TABLE IV (continuation)
TABLE V
Results of Principal Components (PC) summarizing the soil chemical properties of OF, FC and AC, Roraima.
PC1 PC2 PC3
Eigenvalue 3.7212 2.5728 1.0956
Proportion Explained 0.4652 0.3216 0.1369
Cumulative Proportion 0.4652 0.7867 0.9237
Scores
P 0.99681 -0.7882 0.12304
Al 1.19076 -0.9561 0.21088
BS -0.96717 -1.2531 -0.57511
CEC 1.31900 -0.7262 -0.26747
OM 1.25177 -0.5354 -0.05407
CS -0.02283 -0.1336 -2.69015
FS 0.84178 1.4240 -0.19413
Clay -0.79826 -1.4264 0.51049
TABLE VI
Results of canonical correspondence analysis (CCA) for Principal Components. representing the soil chemical properties, and the absolute species densities of OF, FC
and AC, Roraima.
Axis 1 Axis 2 Axis 3
Eigenvalues 0.8856 0.6796 0.08655
Percentage of cumulative
variance 40.91 72.31 76.30 Significance of the
correlation (Monte Carlo test)
Chrysobalanaceae (9 spp.), Burseraceae (9 spp.), Sapotaceae (9 spp.), Fabaceae (7 spp.), Lauraceae (7 spp. ), Myrtaceae (6 spp.), Arecaceae (6 spp.), Apocynaceae (4 spp.) and Sapindaceae (4 spp.). Most families (26) were represented by three or less species, representing 72.2% of the registered families. The best-represented families in the OF were Lecythidaceae (66.6%), Burseraceae (45%) and Arecaceae (29.2%); Chrysobalanacea (52.3%), Humiriaceae (47.1%) and Rubiaceae (30.6%) in the forested Campinarana and the families Aquifoliaceae (114.4%), Humiriaceae (31%), and Melastomataceae (30%) in the AC.
The OF had the largest total basal area of the studied vegetation types, with 6.73 m2, followed
by FC with a total basal area of 2.90 m2 and AC with 1.77 m2. Assessment in community structure
considering vegetation types with difference in inclusion criteria of the wooded, likeAC (CSH ≥ 3 cm) and FC (CBH ≥ 10 cm), are relevant because the smaller trees below the threshold contribute relatively little to the total basal area (Durigan 2009). Total basal area is directly related with plant biomass and indirectly with the microclimate (light and temperature), water interception by rain and availability of shelter and food for wildlife (Muller-Dombois and Ellenberg 1974, cited by Durigan 2009).
The total plant density is also an important attribute to separate the vegetation types. The OF had 1,408 pl ha-1 while the Campinaranas were approximately three times more densely populated, with 4,675 pl ha-1 in FC and 4,816 pl ha-1 in AC, however, this differentiation was influenced by the
sampling method. The analysis of total basal area and density reveals important structural aspects of these communities, such as the presence of few plants with greater biomass in the OF and many plants with lower biomass in Campinaranas. Table VII shows the summary of phytosociology for the studied areas.
Open Ombrophilous Forest
The species abundance in this vegetation type was the highest of all studied areas indicated by the higher Shannon diversity and evenness index (Table VII). The evenness index indicates the division of the specimens between the different taxonomic units (Magurran 1988); in this case, the calculated value indicated no marked dominance of any species.
The most abundant families were Burseraceae with 8 species, followed by Sapotaceae and Chrysobalanaceae (7), Arecaceae (6), Myrtaceae and Fabaceae (4 species each), besides Lecythidaceae, Apocynaceae, Meliaceae, Anacardiaceae, Annonaceae and Melastomataceae (2 species each). The occurrence of these families was mentioned in some studies conducted in upland forests in the Rio Negro basin (Prance 1990, Rankin-de-Mérona et al. 1992, Milliken 1998). According to Daly et al. (2012) Burseraceae have a high ecological importance in Amazon Basin, with high diversity and occupying several and specificity TABLE VI (continuation)
Axis 1 Axis 2 Axis 3
Correlations of the Internal Variables
PC1 -0.4738 -0.8641 -0.1697 PC2 -0.6122 0.7874 0.0724 PC3 0.0350 -0.0530 0.9980
TABLE VII
Summary results of phytosociology for the studied areas. State of Roraima. Brazil. H’: Shannon diversity; J’: evenness index. S’: species numbers; F: families numbers;
N: number of individuals; D: dead individuals; BA: basal area. Area: AC: Arboreous Campinarana; FC: Forest
Campinarana; OF: Open Ombrophilous Forest.
Area H’ J’ S G F N D BA
An Acad Bras Cienc (2017) 89 (2)
1282 BRUNO A.F. DE MENDONÇA et al.
habitats; a key family to testing relative importance of geographic barriers vs. habitat diversity in the speciation process.
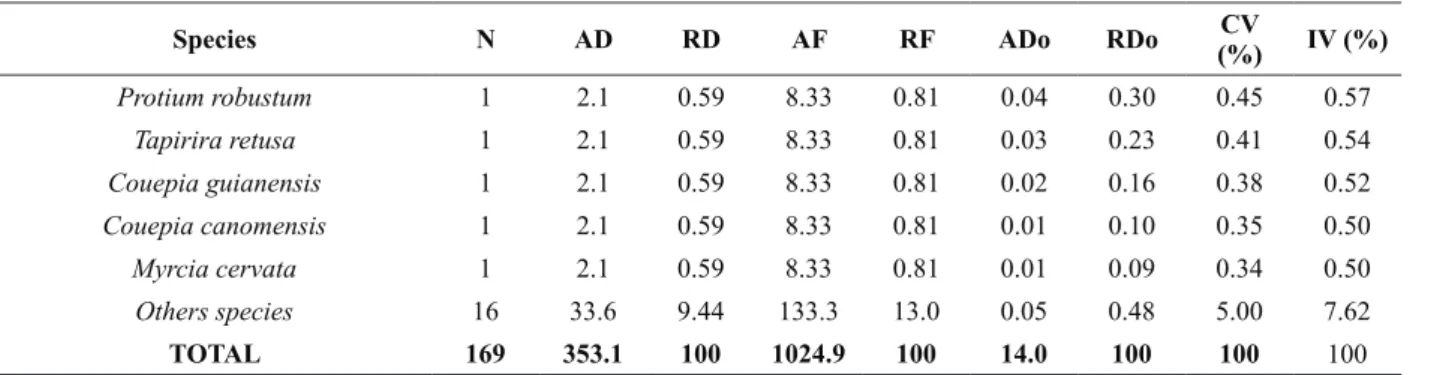
The species with highest importance values that characterized the general vegetation physiognomy were Couratari oblongifolia (Lecythidaceae), Tetragastris panamensis (Burseraceae) and Astrocaryum gynacanthum (Arecaceae). The community structure is mainly characterized by the species Tetragastris panamensis and Astrocaryum gynacanthum, with the second and third highest importance value (IV), but with higher density and absolute and relative frequency. The T. panamensis was also found in clayey soils in Peruvian, Venezuelan and Colombian Amazon, and also in State of Acre in Brazil (Duque and Cavelier 2003, Trivede et al. 2004, Fine et al. 2005, Rockwell et al. 2007, Lozada et al. 2014), showing a widespread distribution in Amazon forest. The same occurs with A. gynacanthum with distribution throughout the Amazon basin and the Guianas, found in Bolivia, Brazil (Acre, Amapá, Amazonas, Pará, Rondônia, Roraima), Colombia, French Guiana, Guyana, Peru, Suriname, Venezuela (Kahn 2008).
The species Couratari oblongifolia had the highest importance value (18.35%), due to its basal area, but with only three tall plants (Table VIII). In this vegetation type, 31 species (53.4%) were found with only one individual. C. oblongifolia was also found in Eastern Amazon (Mazzei et al. 2010, Procópio et al. 2010) and also in French Guiana, Guyana and Suriname (Funk et al. 2007).
According to Oliveira and Amaral (2004) “locally rare” species are those represented by a single plant in the sample. At sampling, 31 rare species were observed, which corroborates other studies in the Amazon region (Prance et al. 1976, Oliveira and Amaral 2004, Alves and Miranda 2008). However, the high number of rare species (with only one plant) can also be related to the small sample area of 0.12 ha.
Some species of OF are typical of the Amazon region, e.g., Licania sothersiae (Chrysobalanacea), Swartzia corrugata (Fabaceae), and Pouteria campanulata (Sapotaceae) (Prance and Sothers 2010, Mansano et al. 2010, Carneiro and Almeida 2010). The species Andira micrantha (Fabaceae) does occur in this vegetation type, but is predominant among the main species of the FC (Table V and VIII). The genera Cordia, Duroia, Guatteria, Licania, Ocotea, Protium, and Tapirira occur in the OF as well as in FC. The widespread occurrence of these genera corroborates the ecotonal characteristics of this region, with ecological contact areas between Campinarana and Open Forest.
The species Eugenia puniciflora (Myrtaceae) occurs in all three tree vegetation types studied in VNP (OF, FC and AC), but in different sizes and is shortest in the AC. This species is also endemic in Brazil and widely distributed in all states (Sobral et al. 2010); it has been reported for Campinaranas of the Serra do Cachimbo (PA) and Parintins (AM) (Ferreira 2009), in the savannas of Roraima (Miranda and Absy 2000), in the transition Cerrado-flooded forest in São Paulo, in the Cerrado in Maranhão (Conceição and Aragão 2010), in rainforests in all states of the northeastern region (Nascimento et al. 2010), and in montane shrub grassland in the Serra dos Carajás (Nunes et al. 2015). However, E. puniciflora was not sampled in Campinaranas of Cruzeiro do Sul (AC) and Vigia do Nazaré (PA) (Ferreira 2009).
TABLE VIII
Phytosociological parameters of the species and the group of trees sampled in an Open Ombrophilous Forest, at the Viruá National Park, Roraima. The species are ranked in decreasing order by the importance value - N = number of plants; AD = absolute density (number of plants/ha), RD = relative density (%), AF = absolute frequency, RF = relative frequency
(%); ADo = absolute dominance (m2/ha), RDo = relative dominance (%), CV = cover value (%) and IV = importance value (%).
Species N AD RD AF RF ADo RDo CV
(%) IV (%)
Couratari oblongifolia 3 6.3 1.78 25.00 2.44 7.13 50.83 26.31 18.35
Tetragastris panamensis 26 54.2 15.38 75.00 7.32 0.75 5.32 10.35 9.34
Dead 6 12.5 3.55 33.33 3.25 1.03 7.31 5.43 4.70
Astrocaryum gynacanthum 14 29.2 8.28 50.00 4.88 0.09 0.64 4.46 4.60
Myrcia sylvatica 10 20.8 5.92 58.33 5.69 0.19 1.38 3.65 4.33
Buchenavia cf. grandis 1 2.1 0.59 8.33 0.81 1.49 10.63 5.61 4.01
Eschweilera ovata 8 16.7 4.73 41.67 4.07 0.18 1.28 3.01 3.36
Protium tenuifolium 7 14.6 4.14 41.67 4.07 0.15 1.08 2.61 3.10
Cordia fallax 6 12.5 3.55 33.33 3.25 0.15 1.05 2.30 2.62
Licania sothersiae 6 12.5 3.55 33.33 3.25 0.06 0.44 2.00 2.41
Protium divaricatum 5 10.4 2.96 41.67 4.07 0.02 0.17 1.57 2.40
Attalea maripa 4 8.3 2.37 16.67 1.63 0.40 2.86 2.62 2.29
Oenocarpus bacaba 4 8.3 2.37 25.00 2.44 0.23 1.64 2.01 2.15
Duroia gransabanensis 4 8.3 2.37 33.33 3.25 0.06 0.40 1.39 2.01
Trichilia cipo 4 8.3 2.37 25.00 2.44 0.14 0.97 1.67 1.93
Pouteria hispida 2 4.2 1.18 16.67 1.63 0.26 1.82 1.50 1.54
Astronium leicontei 3 6.3 1.78 25.00 2.44 0.01 0.06 0.92 1.43
Myrcia fallax 3 6.3 1.78 25.00 2.44 0.01 0.05 0.92 1.42
Chrysophylum columbianum 3 6.3 1.78 16.67 1.63 0.07 0.52 1.15 1.31
Pouteria guianensis 3 6.3 1.78 16.67 1.63 0.04 0.31 1.05 1.24
Guatteria discolor 3 6.3 1.78 16.67 1.63 0.03 0.20 0.99 1.20
Aspidosperma sp. 1 2.1 0.59 8.33 0.81 0.31 2.18 1.39 1.19
Sclerolobium paniculatum 1 2.1 0.59 8.33 0.81 0.25 1.82 1.21 1.07
Trattinickia rhoifolia 2 4.2 1.18 16.67 1.63 0.06 0.41 0.80 1.07
Eugenia punicifolia 2 4.2 1.18 16.67 1.63 0.04 0.27 0.73 1.03
Euterpe precatoria 2 4.2 1.18 16.67 1.63 0.03 0.24 0.71 1.02
Protium ocultum 2 4.2 1.18 16.67 1.63 0.03 0.19 0.69 1.00
Aspidosperma desmanthum 2 4.2 1.18 16.67 1.63 0.02 0.14 0.66 0.98
Licania parvifolia 2 4.2 1.18 16.67 1.63 0.01 0.08 0.63 0.96
Guarea carinata 2 4.2 1.18 16.67 1.63 0.01 0.07 0.63 0.96
Scheffera morototoni 1 2.1 0.59 8.33 0.81 0.18 1.28 0.94 0.89
Ocotea rhynchophylla 1 2.1 0.59 8.33 0.81 0.12 0.85 0.72 0.75
Protium apiculatum 1 2.1 0.59 8.33 0.81 0.08 0.60 0.60 0.67
Astrocaryum aculeatum 1 2.1 0.59 8.33 0.81 0.06 0.43 0.51 0.61
Ampelocera edentula 1 2.1 0.59 8.33 0.81 0.06 0.40 0.50 0.60
Andira micrantha 1 2.1 0.59 8.33 0.81 0.05 0.36 0.48 0.59
An Acad Bras Cienc (2017) 89 (2)
1284 BRUNO A.F. DE MENDONÇA et al.
Forested Campinarana
The most abundant families were Lauraceae and Rubiaceae with eight and five species, respectively, followed by Humiriaceae, Sapindaceae, Clusiaceae, Phyllanthaceae, and Apocynaceae, with three species each.
The FC is a short-stature vegetation, with an average height of 9 m and few 15-20 m high trees. It is a vegetation type with upright trees, with a very poorly branched canopy and scarce foliation. In VNP, much of this vegetation was affected by the fire that devastated the state of Roraima in 1998 (Kohlhepp 1998, Barbosa and Fearnside 1999, 2005). These findings were observed in the plot of forested Campinarana, based on the high importance value (6.38%) of dead plants as well as on the charred trunks of the larger trees (Table IX).
Tree death is a natural phenomenon and contributes to the vegetation dynamics in tropical forests (Franklin et al. 1987). In this study, among the causes that explain most of the tree mortality in VNP, is fire. This suggests a community in a not very advanced succession stage that has not reached its climax. According to Kohlhepp (1998), the region of the middle Anauá river near the VNP is one of the main fire source areas.
In general, the transition between the Forested Campinarana and Ombrophilous Forest (upland forest) is sharp, not only in terms of tree species but also in their frequency (Richards 1952, Rodrigues
1961), aside from the peculiar soil characteristics of the sandy and clay soils, respectively.
According to Richards (1952), the Forested Campinaranas seem to have reached a development level at which they could be considered in a stable edaphic climax. For Rodrigues (1961), this vegetation is rather conditioned by the soil composition than by climate. But other authors call this a pluvial vegetation type (Brasil 1977), referring to the associations with climate conditions, the high rainfall, necessary for the occurrence of this vegetation. These conditions are also decisive for the formation of tropical podzols, typical in the region of the Rio Negro basin (Mafra et al. 2002).
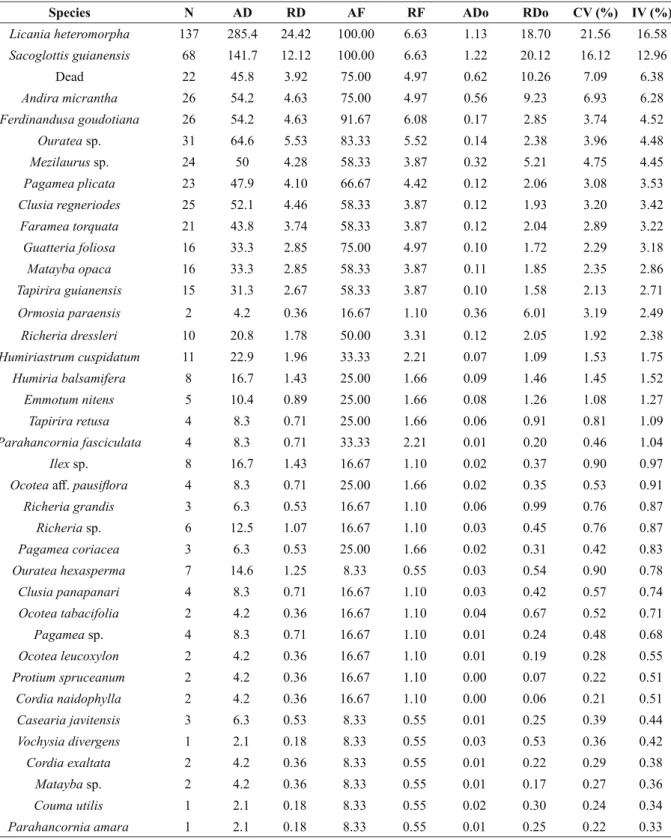
T h e s p e c i e s L i c a n i a h e t e ro m o r p h a (Chrysobalanacea), which has the highest importance value (16.58%), Andira micrantha ( F a b a c e a e ) , H u m i r i a s t r u m c u s p i d a t u m ( H u m i r i a c e a e ), P a r a h a n c o r n i a a m a r a (Apocynaceae), Ormosia paraensis (Fabaceae) and Faramea godetiana (Rubiaceae) are endemic to Brazil and typical in the Amazon region (Prance and Sothers 2010, Medeiros 2010, Pennington 2010, Rapini et al. 2010, Meireles 2010). In this study, they are restricted to the forested Campinaranas. The species Sacoglottis guianensis (Humiriaceae) was also highly relevant in the sample, with the second highest IV (12.96%), and was recorded in the region of “campos do Rio Ariramba”, in Pará (Egler 1960); in forest fragments at the top of the
Species N AD RD AF RF ADo RDo CV
(%) IV (%)
Protium robustum 1 2.1 0.59 8.33 0.81 0.04 0.30 0.45 0.57
Tapirira retusa 1 2.1 0.59 8.33 0.81 0.03 0.23 0.41 0.54
Couepia guianensis 1 2.1 0.59 8.33 0.81 0.02 0.16 0.38 0.52
Couepia canomensis 1 2.1 0.59 8.33 0.81 0.01 0.10 0.35 0.50
Myrcia cervata 1 2.1 0.59 8.33 0.81 0.01 0.09 0.34 0.50
Others species 16 33.6 9.44 133.3 13.0 0.05 0.48 5.00 7.62
TOTAL 169 353.1 100 1024.9 100 14.0 100 100 100
TABLE IX
Phytosociological parameters of the species and the group of trees sampled in Forested Campinarana, in the Viruá National Park, Roraima. The species are ranked in decreasing order by the importance value - N = number of plants; AD
= absolute density (number of plants/ha); RD = relative density (%); AF = absolute frequency; RF = relative frequency (%); ADo = absolute dominance (m2/ha); RDo = relative dominance (%); CV = cover value (%) and IV = importance
value (%).
Species N AD RD AF RF ADo RDo CV (%) IV (%)
Licania heteromorpha 137 285.4 24.42 100.00 6.63 1.13 18.70 21.56 16.58
Sacoglottis guianensis 68 141.7 12.12 100.00 6.63 1.22 20.12 16.12 12.96
Dead 22 45.8 3.92 75.00 4.97 0.62 10.26 7.09 6.38
Andira micrantha 26 54.2 4.63 75.00 4.97 0.56 9.23 6.93 6.28
Ferdinandusa goudotiana 26 54.2 4.63 91.67 6.08 0.17 2.85 3.74 4.52
Ouratea sp. 31 64.6 5.53 83.33 5.52 0.14 2.38 3.96 4.48
Mezilaurus sp. 24 50 4.28 58.33 3.87 0.32 5.21 4.75 4.45
Pagamea plicata 23 47.9 4.10 66.67 4.42 0.12 2.06 3.08 3.53
Clusia regneriodes 25 52.1 4.46 58.33 3.87 0.12 1.93 3.20 3.42
Faramea torquata 21 43.8 3.74 58.33 3.87 0.12 2.04 2.89 3.22
Guatteria foliosa 16 33.3 2.85 75.00 4.97 0.10 1.72 2.29 3.18
Matayba opaca 16 33.3 2.85 58.33 3.87 0.11 1.85 2.35 2.86
Tapirira guianensis 15 31.3 2.67 58.33 3.87 0.10 1.58 2.13 2.71
Ormosia paraensis 2 4.2 0.36 16.67 1.10 0.36 6.01 3.19 2.49
Richeria dressleri 10 20.8 1.78 50.00 3.31 0.12 2.05 1.92 2.38
Humiriastrum cuspidatum 11 22.9 1.96 33.33 2.21 0.07 1.09 1.53 1.75
Humiria balsamifera 8 16.7 1.43 25.00 1.66 0.09 1.46 1.45 1.52
Emmotum nitens 5 10.4 0.89 25.00 1.66 0.08 1.26 1.08 1.27
Tapirira retusa 4 8.3 0.71 25.00 1.66 0.06 0.91 0.81 1.09
Parahancornia fasciculata 4 8.3 0.71 33.33 2.21 0.01 0.20 0.46 1.04
Ilex sp. 8 16.7 1.43 16.67 1.10 0.02 0.37 0.90 0.97
Ocotea aff. pausiflora 4 8.3 0.71 25.00 1.66 0.02 0.35 0.53 0.91
Richeria grandis 3 6.3 0.53 16.67 1.10 0.06 0.99 0.76 0.87
Richeria sp. 6 12.5 1.07 16.67 1.10 0.03 0.45 0.76 0.87
Pagamea coriacea 3 6.3 0.53 25.00 1.66 0.02 0.31 0.42 0.83
Ouratea hexasperma 7 14.6 1.25 8.33 0.55 0.03 0.54 0.90 0.78
Clusia panapanari 4 8.3 0.71 16.67 1.10 0.03 0.42 0.57 0.74
Ocotea tabacifolia 2 4.2 0.36 16.67 1.10 0.04 0.67 0.52 0.71
Pagamea sp. 4 8.3 0.71 16.67 1.10 0.01 0.24 0.48 0.68
Ocotea leucoxylon 2 4.2 0.36 16.67 1.10 0.01 0.19 0.28 0.55
Protium spruceanum 2 4.2 0.36 16.67 1.10 0.00 0.07 0.22 0.51
Cordia naidophylla 2 4.2 0.36 16.67 1.10 0.00 0.06 0.21 0.51
Casearia javitensis 3 6.3 0.53 8.33 0.55 0.01 0.25 0.39 0.44
Vochysia divergens 1 2.1 0.18 8.33 0.55 0.03 0.53 0.36 0.42
Cordia exaltata 2 4.2 0.36 8.33 0.55 0.01 0.22 0.29 0.38
Matayba sp. 2 4.2 0.36 8.33 0.55 0.01 0.17 0.27 0.36
Couma utilis 1 2.1 0.18 8.33 0.55 0.02 0.30 0.24 0.34
An Acad Bras Cienc (2017) 89 (2)
1286 BRUNO A.F. DE MENDONÇA et al.
Serra dos Carajás (Nunes 2009), and near Manaus in upland forest (Oliveira and Amaral 2004).
The genus Cybianthus occurs in the FC and AC studied. This genus is also observed in Campinaranas in Cantá (RR) and Cruzeiro do Sul (AC) (Ferreira 2009), and in “restinga” forest on the coast of São Paulo (Guedes et al. 2006). The following species are also described for the Serra dos Carajás (PA), especially in forest fragments and forests on slopes (on the edge of the highland): Tapirira guianensis, Guatteria foliosa, Clusia panapanari, Sclerolobium paniculatum and Casearia javitensis (Nunes 2009, Nunes et al. 2015).
Arboreous Campinarana
Of all vegetation types studied, this formation had the lowest diversity and lowest evenness indices (Table VII). The AC is composed of species of the tree, shrub and herbaceous strata (the latter one not sampled). It has an intermediate stratum of shrubs from the ground up to a height of 2 m, and an upper stratum of small, less frequent, 2-7 m tall trees. In the lower stratum (not sampled), herbaceous species are predominant, especially of the family Cyperaceae and Poaceae.
The most abundant families were Malpi-ghiaceae, Myrtaceae, Fabaceae, Vochysiaceae, and
Rubiaceae, with two species each. The species Ilex sp., of the Aquifoliaceae family is noteworthy, with the highest importance value and 50% more cover (Table IX), due to its dominance in this vegetation type, coincident with the lowest evenness index found. Some floristic studies of Campinaranas (Oliveira and Daly 2001, Pires 1973, Lisbôa 1975, Barbosa and Ferreira 2004) also report the monodominance of certain species.
Of all sampled species, 14 (12%) were unique to the AC. The species Barcella odora is typical in the Campinaranas of the Rio Negro basin (Leitman et al. 2010). Of the plants of this vegetation type, only two were not identified (Table X) at the of genus or species level.
The species Ilex sp. (Aquifoliaceae), Humiria balsamifera (Humiriaceae), Clusia panapanari (Clusiaceae), Pagamea coriacea (Rubiaceae), and Ternstroemia sp. (Pentaphyllacaceae) also occur both in FC and in AC. The same is true for some species of the genus Cybianthus. Despite these similarities, these environments are remarkably different in the overall species composition (Prance 1996), as well as in the size of each plant in common, which can have more forest or more shrubby characteristics. Moreover, the relatively depauperate vegetation of the AC contrasts sharply with the forest vegetation types studied (FC and
Species N AD RD AF RF ADo RDo CV (%) IV (%)
Matayba elaeagnoides 1 2.1 0.18 8.33 0.55 0.01 0.16 0.17 0.30
Faramea godetiana 1 2.1 0.18 8.33 0.55 0.01 0.09 0.14 0.27
Licania niloi 1 2.1 0.18 8.33 0.55 0.00 0.08 0.13 0.27
Ocotea cujumari 1 2.1 0.18 8.33 0.55 0.00 0.07 0.13 0.27
Vochysia sp. 1 2.1 0.18 8.33 0.55 0.00 0.07 0.13 0.27
Duroia sp. 1 2.1 0.18 8.33 0.55 0.00 0.06 0.12 0.26
Cybianthus reticulatus 1 2.1 0.18 8.33 0.55 0.00 0.05 0.12 0.26
Eugenia punicifolia 1 2.1 0.18 8.33 0.55 0.00 0.05 0.12 0.26
Ternstroemia sp. 1 2.1 0.18 8.33 0.55 0.00 0.03 0.11 0.25
Tovomita cf. schomburgkii 1 2.1 0.18 8.33 0.55 0.00 0.03 0.11 0.25
TOTAL 561 1169 100 1508 100 6 100 100 100
TABLE X
Phytosociological parameters of the species and the dead tree group sampled in a Arboreous Campinarana, in the Viruá National Park, Roraima. Species are ranked in decreasing order by the importance value - N = number of plants; AD = absolute density (number of plants/ha); RD = relative density (%); AF = absolute frequency; RF = relative frequency (%); ADo = absolute dominance (m2/ha); RDo = relative dominance (%); CV= Cover value (%) and IV =% importance value (%).
Species N AD RD AF RF ADo RDo CV (%) IV (%)
Ilex sp. 249 519 43.08 100.00 12.77 2.13 57.98 50.53 37.94
Humiria balsamifera 42 87.5 7.27 100.00 12.77 0.38 10.38 8.83 10.14
Tibouchina aspera 92 192 15.92 91.67 11.70 0.07 1.82 8.87 9.81
Blepharandra sp. 43 89.6 7.44 41.67 5.32 0.48 13.11 10.28 8.62
Calyptrantes cf. cusipdata 41 85.4 7.09 83.33 10.64 0.08 2.23 4.66 6.65
Barcella odora 30 62.5 5.19 41.67 5.32 0.24 6.57 5.88 5.69
Macrolobium bifolium 16 33.3 2.77 50.00 6.38 0.08 2.07 2.42 3.74
Ruizterania cassiquiarensis 15 31.3 2.60 41.67 5.32 0.09 2.48 2.54 3.47
Rhodognaphalopsis sp. 17 35.4 2.94 33.33 4.26 0.05 1.27 2.11 2.82
Taralea sp. 7 14.6 1.21 41.67 5.32 0.02 0.52 0.87 2.35
Bredemeyera sp. 5 10.4 0.87 25.00 3.19 0.01 0.18 0.53 1.41
Clusia panapanari 3 6.3 0.52 16.67 2.13 0.00 0.03 0.28 0.89
Cybianthus 2 4.2 0.35 16.67 2.13 0.00 0.08 0.22 0.85
Morphospecies 2 2 4.2 0.35 16.67 2.13 0.00 0.07 0.21 0.85
Eugenia punicifolia 2 4.2 0.35 16.67 2.13 0.00 0.02 0.19 0.83
Verrucullaria sp. 3 6.3 0.52 8.33 1.06 0.02 0.55 0.54 0.71
Ruizterania sp. 2 4.2 0.35 8.33 1.06 0.01 0.18 0.27 0.53
Ternstroemia sp. 1 2.1 0.17 8.33 1.06 0.01 0.27 0.22 0.50
Doliocarpus hispidobaccatus 2 4.2 0.35 8.33 1.06 0.00 0.02 0.19 0.48
Pradosia sp 1 2.1 0.17 8.33 1.06 0.01 0.14 0.16 0.46
Morphospecies1 1 2.1 0.17 8.33 1.06 0.00 0.02 0.10 0.42
Pagamea coriacea 1 2.1 0.17 8.33 1.06 0.00 0.00 0.09 0.41
Pagamea 1 2.1 0.17 8.33 1.06 0.00 0.00 0.09 0.41
TOTAL 578 1205 100 783.3 100 3.68 100 100 100
OF), which are characterized by a higher species diversity (H’ arboreous < H’ forested).
T h e s p e c i e s H u m i r i a b a l s a m i f e r a (Humiriaceae), with the second largest IV (10.14%), has a wide distribution in Brazil and is typically found in the Amazonian Campinaranas, sometimes in monodominant communities. In studies of a Campinarana in the state of Roraima, Barbosa and Ferreira (2004) reported that this species represented over 60% of the arboreous biomass of the whole environment, demonstrating the monodominance also recorded for this genus in other parts of the Amazon region (Pires 1973).
An Acad Bras Cienc (2017) 89 (2)
1288 BRUNO A.F. DE MENDONÇA et al.
Myrcia, Clusia and Licania (Silva et al. 2010, Sarcinelli 2010).
The occurrence of the family Humiriaceae with great relevance in the sampled Campinaranas also indicates an affinity with the highland flora of the tepui complexes, the typical table-top mountains of the northern Amazon region (Oliveira and Daly 2001). Many typical families and species of the flora in Guyana, which are rare or absent in other parts of Amazonia, are rather well-represented in the Rio Negro basin, which makes this a priority area in terms of conservation, as it hosts a flora with a series of species that are endemic or from other regions, making it unique and extremely diverse (Oliveira and Daly 2001).
According to Anderson et al. (1975), although relatively poor, the Campinaranas vegetation is not uniform, and can vary considerably from one place to another in the same region; some species tend to occur only in concentrated but widely dispersed areas. The conditions given by the low fertility of the soils and the large fluctuations in the groundwater level seem to select the best-adapted species, tending to the predominance of one or few species over the others (Richards 1952). Several authors also report this feature for these formations in the region of the Rio Negro basin, in contrast to the surrounding forest (Richards 1952, Rodrigues 1961, Pires 1973, Anderson et al. 1975, Lisbôa 1975, Oliveira and Daly 2001). In VNP, 43% of all plants sampled belonged to the Ilex sp. (IV 37.9%),
showing the dominance of this species in arboreous Campinarana.
Aside from the pedological and hydrological aspects that influence the adaptation and selection of species, fire also seems to play a relevant role in species structuring and distribution of the Arboreous Campinaranas (Adeney et al. 2016). The few months of drought, coupled with excellent soil drainage, are enough to make the Arboreous Campinaranas, rich in herbaceous species, highly inflammable. These conditions can select and concentrate the most resistant species in widely scattered areas.
In the AC, drastic marks of the fire of 1998 (Kohlhepp 1998, Barbosa and Fearnside 1999, 2005) were observed: 367 (63.5%) of all sampled trees and shrubs have branches at the soil level, which are often typical regrowing shoots resulting from the severe burning of the main stem.
Similarity analysis
The dendrogram of floristic similarity of the plots is shown in Figure 4. The cophenetic correlation analysis was satisfactory above 0.989135, and associated with the cluster analysis, increased the reliability of conclusions regarding the interpretation of the dendrograms (Sokal and Rohlf 1962). The dendrogram shows a remarkable floristic separation between the two Campinaranas types and Open Ombrophilous Forest without floristic similarity between them. The FC and AC formed
a large cluster with 49% of floristic similarity. This result reinforces the floristic similarity but different structural characteristics of these vegetation types, explained by the specific soil conditions.
The floristic similarity of the plots of FC and AC was 99% and 95%, respectively. The high similarity of Campinaranas may be associated to the presence of monodominant species. The floristic similarity of the OF plots was 90%. The lower similarity of OF was related to the high occurrence of locally rare species.
CONCLUSIONS
Canonical Correspondence Analysis and Principal Components indicated a clear distinction between the studied plots, based on measured soil variables, especially base sum and clay, which were the most differentiating properties between Campinarana and Forest; For the separation of the Campinarana types, the main distinguishing variable was organic matter content and Cation Exchange Capacity. The more open oligotrophic vegetation with reduced tree height in the Campinaranas reflects the low fertility, very sandy texture and hydromorphic character of the soils. The soils of the more densely forested habitats were better drained and contained higher nutrient and clay levels. The vegetation types of Campinaranas and Open Ombrophilous Forest had differentiated structural features, with contrasting differences in biomass and species density. Ten species, endemic to Brazil, some typical of the Amazon region, were particularly well-represented. The high similarity of Campinaranas may be associated to the presence of monodominant species and the lower similarity of Open Forest was related to the high occurrence of locally rare species. Some highly important species of the studied Campinaranas have a continental distribution, also reported for other areas at Amazonian Campinaranas and in restingas and mussunungas at southeast of Brazil.
The floristic similarity between the vegetation types of the Campinaranas, together with the differentiated structural characteristics of biomass and species distribution in the plots were related to morphological and physiological adaptations of some common species of the vegetation types, as survival strategies on the soil under particular conditions.
ACKNOWLEDGMENTS
The authors thank the Programa de Áreas Protegidas da Amazônia (ARPA), the Instituto Chico Mendes de Conservação da Biodiversidade (ICMBio) of Roraima, the staff of the Viruá National Park and to the Conselho Nacional de Desenvolvimento Científico e Tecnológico (CNPq), for supporting and sponsoring this research. They also wish to thank Mr. Paulo Apóstolo for identifying the species at the Instituto Nacional de Pesquisas da Amazônia (INPA).
REFERENCES
ADENEY JM, CHRISTENSEN NL, VICENTINI A AND COHN-HAFT M. 2016. White-sand Ecosystems in Amazonia. Biotropica 48(1): 7-23.
ALONSO JA. 2002. Characteristic avifauna of white-sand forests in northern peruvian Amazonia. MSc thesis, Louisiana State University, Baton Rouge, LA.
ALVES JCZO AND MIRANDA IS. 2008. Análise da estrutura de comunidades arbóreas de uma floresta amazônica de Terra Firme aplicada ao manejo florestal. Act Amazonica 38(4): 657-666.
ANDERSON AB. 1981.White-sand Vegetation of Brazilian Amazonia. Biotropica 13(3):199-210.
ANDERSON AB AND PRANCE GT AND ALBUQUERQUE BWP. 1975. Estudos sobre as vegetações de Campinas Amazônica III: A vegetação lenhosa da Campina da Reserva Biológica INPA –SUFRAMA (Manaus-Caracaraí, km 62). Act Amazonica 5(3): 225-246.
ANDRADE H. 1990. Evolução de uma seqüência de solos argilosos até arenosos no Complexo Guianense da Amazônia. D.Sc. thesis. Escola Superior de Agricultura “Luiz de Queiroz”. Piracicaba, 179 p.
An Acad Bras Cienc (2017) 89 (2)
1290 BRUNO A.F. DE MENDONÇA et al.
Quartzosa Hidromórfica sobre rochas cristalinas do Estado do Amazonas. Genomos. Belo Horizonte 5(1): 55-66. BARBOSA RI AND FEARNSIDE PM. 1999. Incêndios na
Amazônia brasileira: estimativa da emissão de gases do efeito estufa pela queima de diferentes ecossistemas de Roraima na passagem do Evento El Niño (1997/98). Act Amazonica 29(4): 513-534.
BARBOSA RI AND FEARNSIDE PM. 2005. Fire frequency and area burned in the Roraima savannas of Brazilian Amazonia. For Eco Management 204(2-3): 371-384. BARBOSA RI AND FERREIRA CAC. 2004. Densidade
básica da madeira de um ecossistema de campina em Roraima, Amazônia brasileira. Act Amazonica 34(4): 587-591.
BOEGER MR AND WISNIEWSKI C. 2002. Estrutura e teores de nutrientes foliares de seis espécies arbóreas ao longo de um gradiente sucessional da planície litorânea do estado do Paraná, Brasil. Iheringia. Série Botânica 57(2): 243-262.
BONIFACIO E, SANTONI S, CELI L AND ZANINI E. 2006. Spodosol - Histosol evolution in the Krkonose National Park (CZ). Geoderma 131: 237-250.
BORCARD D, GILLET F AND LEGENDRE P. 2011. Numerical Ecology with R. Springer, New York Dordrecht London Heidelberg, 306 p.
BOULET R, CHAUVEL A AND LUCAS Y. 1984. Les systémes de transformation en pédologie. In: Livre Jubilaire du Cinquantenaire de Association Française pour l’Étude du Sol. Paris, AFES, p. 167-179.
BRASIL. 1975. Ministério das Minas e Energia. Projeto RADAMBRASIL. Folha NA. 20 Boa Vista e parte das Folhas NA -21 Tumuqumaque, NB – 20 Roraima e NB – 21, Rio de Janeiro, 8: 428. (Levantamento dos Recursos Naturais, 8).
BRASIL. 1977. Ministério das Minas e Energia. Projeto RADAMBRASIL. Folha SA. 19 Içá, geologia, geomorfologia, pedologia, vegetação e uso potencial da terra. Rio de Janeiro, 452 p. (Levantamento dos Recursos Naturais, 14).
BRAVARD S AND RIGHI D. 1990. Podzols in Amazonia. Catena 17: 461-475.
BROWER JE AND ZAR JH. 1984. Field & laboratory methods for general ecology. W.C. Brown Publishers, Boston. CARNEIRO CE AND ALMEIDA JR EB. 2010. Sapotaceae
in Lista de Espécies da Flora do Brasil. Jardim Botânico do Rio de Janeiro. (http://floradobrasil.jbrj.gov.br/2010/ FB024796).
CARNEIRO FILHO A, TATUMI SH AND YEE M, 2003. Dunas Fósseis na Amazônia. Ciência Hoje-SBPC 191: 24-29.
CONCEIÇÃO GM AND ARAGÃO JG. 2010. Diversidade e importância econômica das Myrtaceae do Cerrado, Parque Estadual do Mirador, Maranhão. Scientia Plena 6(7).
DALY D, SILVEIRA M, MEDEIROS H, CASTRO W AND OBERMÜLLER FA. 2016. The White-sand Vegetation of Acre, Brazil. Biotropica 48(1): 81-89.
DALY DCB, FINE PVA AND MARTÍNEZ-HABIBE MC. 2012. Burseraceae: a model for studying the Amazon flora.Rodriguésia 63(1): 21-030
DEFELIPO BV AND RIBEIRO AC. 1997. Análise Química do Solo. 2ª ed., Viçosa, MG. UFV, 26 p. (Boletim de extensão, 29)
DONAGEMMA GK, RUIZ HA, ALVAREZ VH, KER JC AND FONTES MPF. 2008. Fósforo Remanescente em Argila e Silte Retirados de Latossolos após Pré-Tratamentos na Análise Textural. R Bras Ci Solo 32: 1785-1791
DUBROEUCQ D AND VOLKOFF B. 1998. From Oxisols to Spodosols and Histosols: evolution of the soil mantles in the rio Negro basin (Amazonia). Catena 32: 245-280. DUBROEUCQ D, VOLKOFF B AND PEDRO G. 1991. La
couverture pédologique du bouclier du nord de l’Amazonie (bassin du Haut rio Negro). Séquence évolutive des sols et son role dans l’aplanissement généralisé des zones tropicales perhumides. C R Acad Sci Sér II 312: 663-671. DUIVENVOORDEN JF. 1995. Tree species composition
and rain forest-environment relationships in the middle Caqueta area, Colombia, NW Amazonia. Vegetatio 120: 91-113.
DUIVENVOORDEN JF. 1996. Patterns of tree species richness in rainforests of the middle Caqueta area, Colombia, NW Amazonia. Biotropica 28(2): 142-158.
DUQUE A AND CAVELIER J. 2003. Strategies of Tree Occupation at a Local Scale in terra firme Forests in the Colombian Amazon. Biotropica 35(1): 20-27.
DURIGAN G. 2009. Estrutura e diversidade de florestas tropicais. In: Sebastião Venâncio Martins. (Org), Ecologia de Florestas Tropicais do Brasil. 1ª ed., Viçosa: Editora UFV, p. 185-215.
EGLER WA. 1960. Contribuições ao conhecimento dos campos da Amazônia. Campos do Ariramba. Boletim do Museu Goeldi. Nova Série Botânica 4: 1-36.
EMBRAPA. 1997. Empresa Brasileira de Pesquisa Agropecuária. Serviço Nacional de Levantamento e Conservação de Solos. Manual de métodos de análises de solo. 2ª ed., Rio de Janeiro: Embrapa Solos, 212 p. FERREIRA CAC. 2009. Análise comparativa de vegetação
lenhosa do ecossistema campina na Amazonia Brasileira. Universidade Federal do Amazonas (tese de Doutorado). 277 p.
FINE PVA, DALY DC, MUÑOZ GV, MESONES I AND CAMERON KM. 2005. The contribution of edaphic heterogeneity to the evolution and diversity of Burseraceae trees in the Western Amazon. Evolution 59(7): 1464-1478. FRANKLIN JF, SHUGART HH AND HARMON ME. 1987.