Rui Miguel Ribeiro Sampaio
UMinho|20 15 abril de 2015 The ef fects of sovereign credit rating downgrades on inves
tment-to-price sensitivity
Universidade do Minho
Escola de Economia e Gestão
The effects of sovereign credit rating
downgrades on investment-to-price
sensitivity
R ui Miguel Ribeir o Sam paioMaster Dissertation
Master in Finance
Dissertation supervisor:
Professor Doutor Gilberto Loureiro
Rui Miguel Ribeiro Sampaio
April, 2015
Universidade do Minho
Escola de Economia e Gestão
The effects of sovereign credit rating
downgrades on investment-to-price
sensitivity
DECLARAÇÃO
Nome: Rui Miguel Ribeiro Sampaio
Endereço electrónico: rui.m.sampaiootmail.com
Número do Bilhete de Identidade: 13655711
Título dissertação: “The effects of sovereign credit rating downgrades on investment-to-price sensitivity”
Orientador: Gilberto Loureiro
Ano de conclusão: 2015
Designação do Mestrado: Mestrado em Finanças
É AUTORIZADA A REPRODUÇÃO INTEGRAL DESTA DISSERTAÇÃO APENAS PARA EFEITOS DE INVESTIGAÇÃO, MEDIANTE DECLARAÇÃO ESCRITA DO INTERESSADO, QUE A TAL SE COMPROMETE;
Universidade do Minho, 29/04/2015
iii
ACKNOWLEDGEMENTS
I would like to dedicate my first acknowledgement’ words to my parents and Mariya, the love and all the support that was given to me over the years of academic life. No doubt it was very important. To all my family, thank you.
Then, to Professor Gilberto Loureiro, as my scientific supervisor. I wish to express my gratitude for the availability and critical rigor with which accompanied this dissertation, as well as the advice and references that helped enrich my knowledge stadium.
Finally, I want to thanks to all my friends who have always accompanied me and lived with me in recent years. I cannot mention everyone, but would like to make a special thanks to a few. To João Pereira and Rafael Silva, that have been advising and keeping up throughout this route. To "Maçonaria da Biblioteca" members and Carlos Pereira, thank you for understanding in times of absence, for the strength to move on, the moments of companionship and friendship shown throughout this route. For various reasons I know I can count on you because true friendship feels even with the distance.
As mentioned above, I cannot mention everyone, so I thank to all the friends who had the pleasure of knowing throughout my life and that, in some way, helped to get where I am, whether the support, strength or affection - to all my friends and the entire EEG’ staff for the excellence demonstrated over the years.
iv
ABSTRACT
This work examines how changes in the information environment affect real investment decisions. The information contained in stock prices, accordingly to the managerial learning hypothesis, can guide managers’ investment decision; a deterioration in the informational environment should thus affect negatively decision-making. Sovereign credit rating downgrades, as an exogenous information shock, test this prediction by analyzing changes in the sensitivity of investment to stock prices, using a difference-in-differences methodology. Following a worsening in the informational environment, results find a decrease in investment-to-price sensitivity. The decrease in the investment-to-price sensitivity is stronger for investment grade rating home government’ firms, than for non-investment grade rating home government’ firms, following a worsening in the informational environment. Results also evidence that the stock price of investment grade rating home government’ firms have negative and statistically significant relationship with investment. Finally, results document an increase on the investment-to-price sensitivity during the late 2000’s crisis relative to the period before, but a higher decrease following a worsening in the macroeconomic fundamentals.
v
RESUMO
Este trabalho examina como as mudanças no ambiente de informação afectam as decisões de investimento reais. A informação contida nos preços das acções, de acordo com a managerial learning hypothesis , pode direccionar as decisões de investimento dos gestores; então, uma deterioração do ambiente informacional deve afectar a tomada de decisões de forma negativa. Os downgrades nos ratings dos créditos soberanos são considerados um choque informacional exógeno, para testar a previsão anterior, analisando as mudanças na sensibilidade do investimento para os preços das acções, utilizando uma metodologia de diferenças em diferenças. Na sequência da deterioração do ambiente informacional, os resultados encontram uma diminuição na sensibilidade investimento-preço. Na sequência de um agravamento do ambiente informacional, a diminuição da sensibilidade do investimento-preço é mais forte nas empresas cujos governos estão classificados como nível de investimento do que para as empresas cujos governos estão classificados como nível de não investimento. Os resultados também revelam que o preço das acções das empresas, cujos governos estão classificados como nível de investimento, tem uma relação negativa e estatisticamente significativa com o investimento. Finalmente, os resultados documentam um aumento na sensibilidade do investimento para preços durante a crise dos finais dos anos de 2000, em relação ao período anterior, mas um decréscimo mais elevado após uma deterioração nos fundamentos macroeconómicos.
vi
Index
ACKNOWLEDGEMENTS ... iii
ABSTRACT ... iv
RESUMO ... v
LIST OF TABLES ... vii
1. INTRODUCTION ... 1
2. LITERATURE REVIEW ... 3
3. DATA AND METHODOLOGY ... 7
3.1. SAMPLE DESCRIPTION ... 7
3.2. METHODOLOGY TO MEASURE THE INVESTMENT-TO PRICE SENSITIVITY ... 11 4. EMPIRICAL RESULTS ... 12 4.1. HYPOTHESIS 1 ... 12 4.2. HYPOTHESIS 2 ... 19 4.3. HYPOTHESIS 3 ... 22 5. CONCLUSION ... 33 6. REFERENCES ... 34
vii
LIST OF TABLES
Table 1 – Sample description ... 8
Table 2 – Ratings – numerical scale ... 9
Table 3 – Descriptive statistics ... 9
Table 4 – Descriptive statistics for investment grade and non-investment grade ... 10
Table 5 – Sovereign Credit Rating Downgrade and firms’ investment-to-price sensitivity ... 14
Table 6 – Alternative investment measures – robustness tests ... 15
Table 7 – Alternative sovereign credit rating downgrade measures ... 17
Table 8 – Effects in investment grade and non-investment grade ... 20
1
1. INTRODUCTION
In the late 2000s the European sovereign debt crisis took place in several member states of the eurozone, characterized by rising levels of debt and overly high sovereign structural deficits. It means that these states not only were rising debt but also already facing concerns about how to repay it, refinance their government debt or help overindebted banks that were on the national command. Thus, these states had to resort to third-party assistance such as the International Monetary Fund and other entities.
The complications that these states faced were triggered by the Greek situation, where their problems were being covered up to fulfill Maastricht’s criteria of limiting the deficit spending and the debt levels were revealed. Investors started to fear sovereign defaults of other member-states which lead to a wave of downgrades of these sovereign debt states and lead also to concerns about future debt sustainability requiring higher interest rates.
In the aftermath of this crisis some developed countries experienced downgrades, even such countries as USA and France, who were downgraded from AAA for the first time in history.
In this work, I intend to test the prediction of the “managerial learning hypothesis” studying the impact of the sovereign credit rating downgrades as an exogenous shock to the information environment on real investment decisions, specifically on investment-to-price sensibility, with a difference-in-differences methodology. First, I perform basic test whether stock investment-to-price sensibility changes after a sovereign downgrade. Second, I explore whether investment-to-price sensibility changes around the late 2000s crisis. Finally, I examine whether investment-to-price sensibility changes between investment grades and non-investment grades.
This work finds: first, a decrease, statistically significant, in the investment-to-price sensibility after a worsening in the informational environment due to a sovereign credit rating downgrade; second, a lower decrease in the investment-to-price sensibility after a sovereign credit rating downgrade in non-investment grades; finally, a higher decrease in the investment-to-price sensibility during late 2000’s crisis, after a sovereign credit rating downgrade. Evidence suggests that sovereign credit rating downgrades affect investment and that can lead to harder access to the capital markets.
2
A sovereign credit rating downgrade is an exogenous information shock that is associated, at least, to a stable information environment, though may be associated with a deterioration of the informational environment. If informational environment is negatively affected, the lower price informativeness won’t provide the most accurate signals to managers and decision makers. Thus, sovereign credit rating downgrades may lead to inefficient decision making.
Results are consistent with the expectations and are an extra support to the managerial learning hypothesis, but the possibility of other omitted factors may interfere cannot be ruled out. Though, several robustness tests, as alternative measures of investments and alternative proxies of downgrades, were performed and the results hold (in most of them).
This work contributes to the literature of macroeconomic factors’ effects, as sovereign credit rating downgrades, on the informational role of market prices, showing that it has negative effects on the optimal allocation resources.
3
2. LITERATUREREVIEW
Each individual has his/her own consumption and investment preference, creating a subjective time preference rate between the present and the future. Therefore, there are several subjective interest rates.
The capital markets allow efficient funds transfers between all the participants, creating endogenously a unique market interest rate that is used by all in their consumption and/or investment decision making.
On the one hand, markets allow access to higher utility levels for borrowing institutions with insufficient funds to undertake certain projects, influencing the wealth maximization of its shareholders. On the other hand, the market-determined interest rate is an important piece of information for manager’s investment decisions, because the return of the investment project should at least match the opportunity cost of capital.
Capital asset pricing model is used to evaluate the expected return for each security and only needs non-systematic risk, which is the risk related to the microeconomic component. Any deviation from the expected return is interpreted as an abnormal return, but it’s only interpreted as an evidence of inefficiency if such deviation is persistent. However, it has been expanded (for example: Fama and French three factor model) and an alternative model was built, the arbitrage pricing theory, which uses the expected return of the risky security and the risk premium of several macroeconomic factors.
The efficiency of capital markets relies on arbitrageurs’ ability to recognize the mispriced securities in order to profit from it, leading prices to an equilibrium value consistent with relevant available information. Most of the evidences suggest that capital markets are efficient in its’ weak and semi-strong forms.
Grossman and Stiglitz (1980) suggest that stock prices just reflect a subset of all relevant information, because it is costly to collect private information. Though, if the costs decrease, informed trading increases leading to more information contained on stock prices.
Outside investors have less information than managers, but stock prices can still be informative and relevant for managers as long as they don’t have perfect information
4
about all decision’ factors, consistent with Bond et al. (2012). Outside investors and speculators may be collectively more informed than managers, because stock prices aggregate all the information, they can be informative and relevant, as Grossman (1976) and Hellwig (1980) shows. Therefore, the more investors there are the more competitiveness among them, leading a more informative price to managers.
Fama and Miller (1972) evidence that higher stock price informativeness enable superior decision-making and influence real decisions such as investment. Foucault and Frésard (2011) is one example of the growing literature that highlights the informational feedback of stock prices suggesting that managers can learn from the information contained in stock prices. If so firms can make more efficient investment decisions.
An exogenous shock on the informational environment that increases the cost of obtaining private information, such as sovereign credit rating downgrades may do, can lead to lower informativeness of stock prices to manager; making it harder for managers to make the best decision. Therefore, agency ratings have the important role of accessing the rating of a debt issuer, which is related to its’ default risk and to its’ ability to repay the debt issued, through a grade system.
There are several studies that evidence which information is used by agency ratings when assessing it sovereign ratings. While Cantor and Packer (1996) conclude that they aggregate all the macroeconomic information, Afonso (2003), Bissoondoyal-Bheenick (2005) and Afonso, Gomes and Rother (2011) evidence that external debt, public debt level, government balance, GDP per capita and real GDP growth are the main factors.
Credit rating changes should reflect changes in the risk profile that are likely to be permanent (consistent with the normative of the long term perspective), working as a reaction and not as predictor, as Sy (2003) concludes. However, rating agencies are known to have a pro-cyclical behavior which destabilizes the market, because downgrades occur after bad performance periods and upgrades occur after market rallies, as Ferri, Liu and Stiglitz (1999) and Kaminskiy and Schmukler (2002) show.
Sovereign credit rating downgrades mean an increase on the default risk and occur after bad performance periods, leading to an expected negative stock market reaction on stock prices and an expected increase on the interest rates, as Holthausen and Leftwich (1986) show. Griffin and Sanvicente (1982) also evidence that downgrades lead to
5
negative stock market reactions on stock prices. Goh and Ederington (1999) go further and conclude that negative stock market reactions are higher in and into non-investment grades.
Ratings can affect the pool of investors, since there might be some type of investors (such as mutual funds investors) who under a certain level won't invest due to its investment policies. However, most of the investors just require higher interest rates to compensate their exposure to higher default risk.
Durbin and Ng (2005) show that firms with higher foreign revenue and firms who are linked to a foreign firm or linked to the home government have a better position (lower spreads) on the bond markets than the home government.
The sovereign ceiling shouldn’t be a determinant rule otherwise it would carry real effects to some firms, though investors use it as convenient and intuitive aids in valuing projects in contexts of asymmetric information, transparency problems or costly private information.
Almeida et al. (2014) study the sovereign credit rating downgrades effects, using the sovereign ceiling policies, on financial policy and on firm investment, concluding that downgrades lead to an increase in corporate bond yields and to large decreases in investment and leverage. Afonso, Furceri and Gomes (2012) evidence that downgrades announced by the main rating agencies can lead to harder access to the capital markets.
Hypothesis 1: Investment-to-price sensitivity should decrease, or at least maintain equal, following a credit rating downgrade, ceteris paribus.
By the managerial learning hypothesis, following an informational shock that declines the informational content of stock prices for managers, investment-to-price sensitivity is expected to decrease, or at least to maintain equal.
Hypothesis 2: Investment-to-price sensitivity should decrease less in non-investment grades following a credit rating downgrade, ceteris paribus.
6
Non-investment grades are expected to have lower negative effects on the investment-to-price sensitivity following an information shock, by the managerial learning hypothesis.
Hypothesis 3: Investment-to-price sensitivity should decrease more after the crisis than before the crisis following a credit rating downgrade, ceteris paribus.
The decrease on the investment-to-price sensitivity is expected to be higher following an information shock for the crisis period, by the managerial learning hypothesis.
7
3. DATA AND METHODOLOGY
3.1 Sample description
The impact of a sovereign credit rating downgrade on investment-to-price sensitivity will be examined for 18 countries: Austria, Croatia, Czech Republic, Germany, Greece, Ireland, Netherlands, Portugal, Spain and United Kingdom (Region 1 – “Europe”); Canada and Mexico (Region 2 – “North and Central America”); Argentina, Brazil and Colombia (Region 3 – “South America”); and Egypt, Indonesia and Russia (Region 4 – “Rest of the world”)
Data was collected from DataStream/WorldScope since January 1997 until December 2011, in an annual basis. From DataStream collect market value of equity (MV), while from Worldscope collect on each firm’s total assets (WC02999), capital expenditures (WC04601), property plant and equipment (WC02501), book value of equity (WC05476), common shares outstanding (WC05301), net income (WC01751), depreciation and amortization (WC01151), EBITDA (WC18198), R&D (WC01201) sales (WC01001). Accordingly to the literature, regulated industries (utilities and financial, 4-digit SIC codes (WC07024) firms’ between 4900-4949 and 6000-6999) have been excluded. Though, SIC code 2-digit (WC07022) has higher number of observations on the sample data than 4-digit SIC code, so I use WC07022 that allows a higher number of observations, which affects the estimation accuracy. However, from WC07022 I just use the two first digits to control for industry. Missing firm-year values on total assets, sales and capital expenditure were excluded. Firms with total assets lower than 10000 and with negative sales and with less than three years of information are dropped. To minimize the impact of outliers on variables, it is winsorized at the top and bottom 1% level.
8
Table 1: Sample Description
Sample Deterioration
#firms %firms #firmyears #firmyears
Argentina 70 2.12 791 195 Austria 56 1.86 694 0 Brazil 267 7.05 2626 283 Canada 617 15.27 5687 0 Colombia 36 0.77 288 118 Croatia 84 1.52 565 0 Czech Republic 12 0.33 123 33 Egypt 150 2.82 1050 1002 Germany 765 21.63 8058 0 Greece 202 4.32 1609 1418 Indonesia 374 10.2 3801 807 Ireland 48 1.42 529 135 Mexico 104 3.15 1173 269 Netherlands 112 3.69 1374 0 Portugal 45 1.4 523 85 Russia 506 8.64 3218 1409 Spain 107 3.25 1212 204 United Kingdom 428 10.56 3933 0 Total 3983 100 37254 5958
This table describes the number of firm-year observations (“#firm-years”) that occurred a deterioration of the macroeconomic fundamentals until its’ recovery and the number of firm-year observations that enter in the control group by country. The sample period is from 1997 to 2011.
The variable “deterioration” is a dummy variable that assumes the value 1 for the periods after a sovereign credit rating downgrade until its’ rating improves. After a rating improvement it will assume the value 0. Another alternative sovereign credit rating downgrade measures will be used to test the robustness of the results. Those, alternative measures are: “bigdown1” is a dummy variable that assumes the value 1 if in a period of one year the downgrade was at least equivalent to 3 notches, and assumes the value 0 otherwise; “bigdown2” is a dummy variable that assumes the value 1 if in a period of two years the downgrade was at least equivalent to 3 notches, and assumes the value 0 otherwise; and “downgrade” is a dummy that assumes the value 1 if in year t the rating is lower than the year t-1 rating.
9
Sovereign credit ratings data comes from Fitch rating agency and are converted as the following table:
Table 2: Ratings – numerical scale
AAA 24 A 19 BB+ 14 B- 9 C 4 AA+ 23 A- 18 BB 13 CCC+ 8 RD 3 AA 22 BBB+ 17 BB- 12 CCC 7 DDD 2 AA- 21 BBB 16 B+ 11 CCC- 6 DD 1 A+ 20 BBB- 15 B 10 CC 5 D 0
Sovereign credit ratings from AAA (24) rating to BBB- (15) rating are considered to be investment grades. Below BBB- rating it is considered to be non-investment grades.
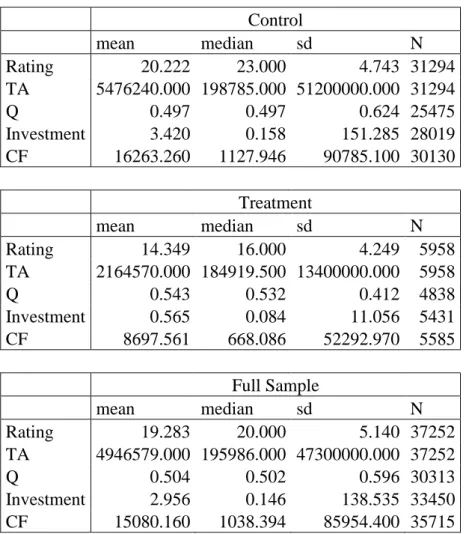
Table 3: Descriptive statistics
Control mean median sd N Rating 20.222 23.000 4.743 31294 TA 5476240.000 198785.000 51200000.000 31294 Q 0.497 0.497 0.624 25475 Investment 3.420 0.158 151.285 28019 CF 16263.260 1127.946 90785.100 30130 Treatment mean median sd N Rating 14.349 16.000 4.249 5958 TA 2164570.000 184919.500 13400000.000 5958 Q 0.543 0.532 0.412 4838 Investment 0.565 0.084 11.056 5431 CF 8697.561 668.086 52292.970 5585 Full Sample mean median sd N Rating 19.283 20.000 5.140 37252 TA 4946579.000 195986.000 47300000.000 37252 Q 0.504 0.502 0.596 30313 Investment 2.956 0.146 138.535 33450 CF 15080.160 1038.394 85954.400 35715
This table reports the mean, median and standard deviation of the main variables used in the analysis, provided separately for treatment group firms (Downgrade) and control
10
group firms, which are the ones that didn’t registered a downgrade in that year. The sample period is from 1997 to 2011.
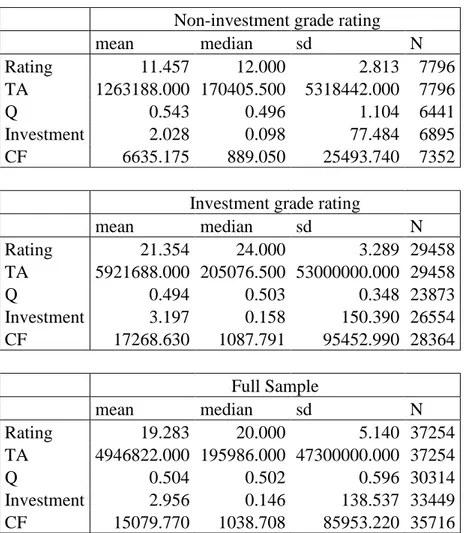
Table 4: Descriptive statistics for investment grades and non-investment grades
Non-investment grade rating
mean median sd N Rating 11.457 12.000 2.813 7796 TA 1263188.000 170405.500 5318442.000 7796 Q 0.543 0.496 1.104 6441 Investment 2.028 0.098 77.484 6895 CF 6635.175 889.050 25493.740 7352
Investment grade rating
mean median sd N Rating 21.354 24.000 3.289 29458 TA 5921688.000 205076.500 53000000.000 29458 Q 0.494 0.503 0.348 23873 Investment 3.197 0.158 150.390 26554 CF 17268.630 1087.791 95452.990 28364 Full Sample mean median sd N Rating 19.283 20.000 5.140 37254 TA 4946822.000 195986.000 47300000.000 37254 Q 0.504 0.502 0.596 30314 Investment 2.956 0.146 138.537 33449 CF 15079.770 1038.708 85953.220 35716
This table reports the mean, median and standard deviation of the main variables used in the analysis, provided separately for investment grades and non-investment grades. The sample period is from 1997 to 2011.
The National Bureau of Economic Research (NBER) says that the crisis started at December 2007 and lasted till June 2009. However some countries faced the crisis for a higher period, so “after” dummy variable will be used as a time reference for the latest crisis, allowing evidences between the period before and the period after 2007.
11
3.2 Methodology to measure the investment-to-price sensitivity
The main goal of this work is to measure the investment-to-price sensitivity of a sovereign credit rating downgrade, so I will employ the difference-in-differences methodology.
The baseline regression model is given by:
Where, firm and year are represented by i and t, respectively. The dependent variable Ii,t
is the corporate investment measure, given by capital expenditures over lagged plant, property and equipment. Deterioration is the dummy variable of interest. Tobins’ Q, represented by Qi,t-1, is the normalized stock price in year t-1 of the firm i and is
measured as the market value of equity plus the total assets minus the book value of equity, scaled by book assets.
The baseline model includes some control variables as log (TAi,t-1), proxy for firm size,
which reflects 2011 prices, and cash flow (CF i,t-1), given by net income plus
depreciation and amortization – that has a relationship with investment well documented – since are known variables to affect investment decisions. Notice that cash flow must be divided by total assets, as baseline model equation shows.
The marginal effect of a sovereign credit rating downgrade (Deteriorationi,t-1) on the
investment of firm i is given by:
Is expected that investment-to-price sensitivity to have an ambiguous prediction after a downgrade, expecting to decrease when the set of investors that collect new private information is negatively affected. Higher effects are expected in investment-grades and in bear markets.
12
4. EMPIRICALRESULTS
In this section, I will examine whether the hypothesis formulated before about the relationship between sovereign credit rating downgrades and the investment-to-price sensibility.
4.1 Hypothesis 1: Investment-to-price sensitivity should decrease, or at least
maintain equal, following a credit rating downgrade, ceteris paribus.
Table 5 displays, from various specifications of the baseline model, the relationship between investment-to-price sensitivity and sovereign credit rating downgrades. After a sovereign credit rating downgrade, most of the investors require a higher interest rate in order to compensate the higher risk. However, it might lead to a decrease in the pool of investors. If it happens the capital markets may become less competitive, therefore the price may not be the equilibrium price for the relevant available information, reducing the price informativeness. Concluding, investment-to-price sensibility should decrease, or at least be equal, after a sovereign credit rating as stock prices.
As expected investment is positively related to stock price (Q), because market’s feedback is useful for managers’ investment decision. The coefficient on Qi,t-1 is
statistically significant at 1% level in all model specifications.
Control group firms aren’t expected to have such decrease in investment-to-price sensibility, because their home government didn’t suffer an exogenous shock on the informational environment.
The coefficient of the variable of interest β3 (Qt-1 x Deteriorationt-1) is expected to be
negative and captures the investment-to-price sensibility variation for a period of worsening perspectives, after a sovereign credit rating downgrade, for the treatment group relatively to the control group.
The results in Table 5 show that the main coefficient is negative and statistically significant as expected, suggesting a decrease in investment-to-price sensitivity
following a deterioration of the macroeconomic fundamental until a recovery (upgrade) for the treatment group. If I take the coefficients in the baseline model as an example, an increase of one standard deviation in Q (0.596 – from Table 2) is associated with a
13
0.008 increase (0.013 x 0.596) in investment, which represents, for the average firm, a 0,271% increase ((2.956+0.008)/2.956) in investment prior to the worsening period. After it, an increase of one standard deviation in Q is associated a -0.044 decrease ((0.013 + -0.086) x 0.596), for the average treatment firm, which represents 98,512% of the previous value (0.044)/ 2.956). So, it means a 1.488% decrease ( 1- (2.956-0.044)/ 2.956) in investment.
Total assets logarithm (firm size’ proxy), have the expected sign documented in prior studies, which is negative. While cash flows over firm size’ proxy is zero. Both control variables are statistically significant in all of the three specifications.
Robustness tests of the above results were checked in several ways. In column (2), baseline model was re-estimated using just year and firm fixed effects. The coefficient on the interaction between Q and deterioration (main result) stills negative and statistically significant. As the inclusion of firm fixed effects doesn’t statistically significant change the magnitude of coefficient β3, pooled Ordinary Least Squares
(OLS) regressions in the rest of this work will be used, preserving the efficiency of the estimates, as Foucault and Frésard (2011) do. In column (3), baseline model was re-estimated with random country effects. Once again, the main result remains similar to the baseline specification.
14
Table 5 - Sovereign credit rating downgrade and firms’ investment-to-price sensitivity
This table presents the estimation of baseline model with various estimation techniques. The dependent variable is investment, defined as capital expenditures divided by lagged
Investment (capex over lagged PPE)
baseline Firm FE Country RE
(1) (2) (3) Qt-1 0.01293*** 0.01366*** 0.01274*** (5.5677) (5.5652) (5.9851) Deteriorationt-1 -0.04797 -0.06765** -0.06453* (-1.2978) (-2.4298) (-1.9830) Qt-1 x Deteriorationt-1 -0.08549* -0.07743** -0.07974* (-1.8128) (-2.3331) (-1.7495) CF / log(TA) t-1 0.00000*** 0.00000*** 0.00000*** (3.5919) (6.7568) (3.8078) log (TA) t-1 -0.04365*** -0.05083*** -0.04364*** (-6.3577) (-12.4550) (-5.9556) Constant 0.86201*** 0.92946*** 0.82975*** (8.2208) (17.6152) (7.7645)
Region Fixed Effects Yes No No
Industry Fixed Effects Yes No Yes
Year Fixed Effects Yes Yes Yes
Firm Fixed Effects No Yes No
Observations 19,764 26,046 19,764
15
property, plant and equipment (PPE). Deterioration is a dummy variable that is equal to one after sovereign downgrades until the rating increase again, assuming then the value zero. In column (1), estimate baseline model with pooled OLS regressions with region, year and industry fixed effects. In column (2), re-estimate baseline model with firm fixed effects and without region and industry fixed effects. In column (3), estimate baseline model by including region random effects. The sample period is from 1997 to 2011. The standard errors used to compute the t-statistics (in brackets) are adjusted for heteroskedasticity and within-firm clustering. Symbols ***, ** and * indicate statistical significance at the 1%, 5% and 10% levels, respectively.
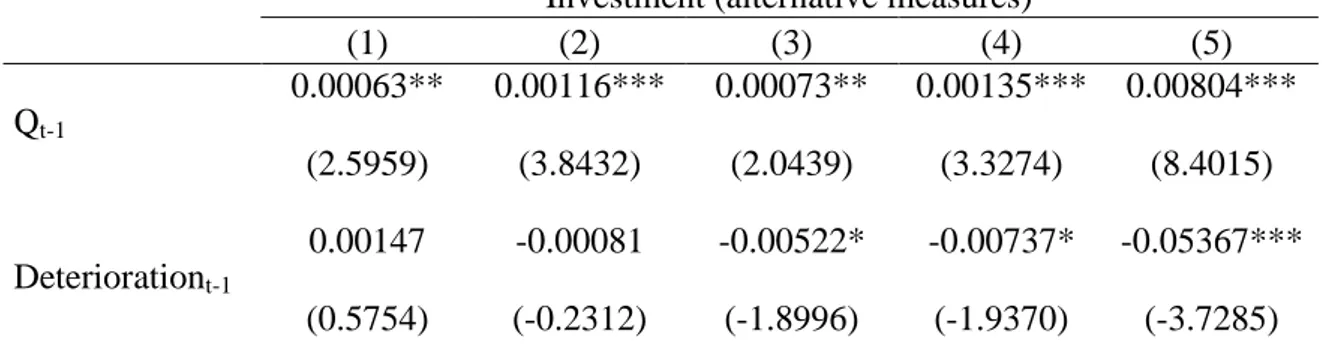
In Table 6, the robustness of the previous findings with alternative investment measures was checked. Investment was defined as the ratio of capital expenditures (Capex) to lagged fixed assets, in the baseline equation. The five alternatives to measure the investment are: Capex over contemporaneous (1) and lagged assets (2); the sum of Capex and R&D expenses over contemporaneous assets (3) and lagged assets (4); and the annual change of total assets, scaled by lagged assets.
The interaction between Q and Deterioration, observe negative coefficients in the five alternative measures. However, at fifth alternative measure it isn’t statistically significant.
The coefficient Qt-1 and the cash flow control variable are positive and zero,
respectively, and statistically significant in all alternatives. Firm size control variable is negative in four measures, but statistically significant just in three.
Table 6: Alternative investment measures – robustness tests
Investment (alternative measures)
(1) (2) (3) (4) (5) Qt-1 0.00063** 0.00116*** 0.00073** 0.00135*** 0.00804*** (2.5959) (3.8432) (2.0439) (3.3274) (8.4015) Deteriorationt-1 0.00147 -0.00081 -0.00522* -0.00737* -0.05367*** (0.5754) (-0.2312) (-1.8996) (-1.9370) (-3.7285)
16 Qt-1 x Deteriorationt-1 -0.01826*** -0.01851*** -0.01563*** -0.01546*** -0.02481 (-8.1069) (-6.0995) (-5.9149) (-4.2169) (-0.9766) CF / log (TA) t-1 0.00000*** 0.00000*** 0.00000*** 0.00000*** 0.00000*** (4.0065) (4.9161) (6.9312) (6.7109) (5.8729) log (TA) t-1 0.00086 -0.00092 -0.00261** -0.00520*** -0.02922*** (1.0554) (-0.8216) (-2.4118) (-3.4095) (-7.0564) Constant 0.03701*** 0.05907*** 0.09210*** 0.12318*** 0.34452*** (3.4972) (4.0983) (6.4866) (6.3022) (6.5475) Region Fixed
Effects Yes Yes Yes Yes Yes
Industry Fixed
Effects Yes Yes Yes Yes Yes
Year Fixed
Effects Yes Yes Yes Yes Yes
Firm Fixed Effects No No No No No Observations 19,943 19,943 19,943 19,943 19,943 R-squared 0.034 0.034 0.046 0.055 0.164
In this table baseline model was estimated using various measures of investment with pooled OLS regressions. In columns (1) and (2) investment is defined as capital expenditures divided by lagged and contemporaneous total assets, respectively. In columns (3) and (4) investment is defined as capital expenditures plus R&D expenses divided by lagged and contemporaneous total assets, respectively. Finally, in column (5) investment is defined as the annual change in total assets divided by lagged total assets. Across all specifications, Deterioration is a dummy variable that is equal to one after sovereign downgrades until the rating increase again, assuming then the value zero. The sample period is from 1997 to 2011. All estimations include region, year and industry fixed effects. The standard errors used to compute the t-statistics (in brackets) are adjusted for heteroskedasticity and within-firm clustering. Symbols ***, ** and * indicate statistical significance at the 1%, 5% and 10% levels, respectively.
17
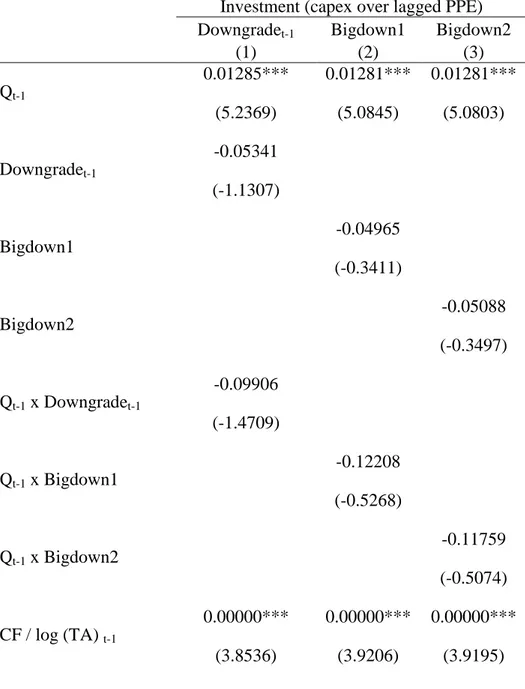
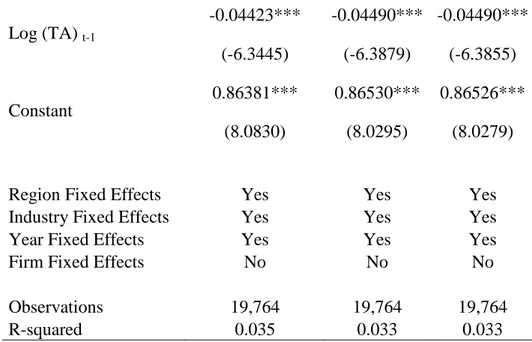
In Table 7, the findings were checked about the robustness with different proxies for the sovereign credit rating downgrades, already explained previously in section “Data and Methodology”. Irrespective of the downgrade measure – “downgradet-1” (column 1),
“bigdown1” (column 2) and “bigdown2” (column 3) – the interactions between Q and the variables of interest have negative but not statistically significant results.
Table 7: Alternative sovereign credit rating downgrade measures
Investment (capex over lagged PPE) Downgradet-1 Bigdown1 Bigdown2
(1) (2) (3) Qt-1 0.01285*** 0.01281*** 0.01281*** (5.2369) (5.0845) (5.0803) Downgradet-1 -0.05341 (-1.1307) Bigdown1 -0.04965 (-0.3411) Bigdown2 -0.05088 (-0.3497) Qt-1 x Downgradet-1 -0.09906 (-1.4709) Qt-1 x Bigdown1 -0.12208 (-0.5268) Qt-1 x Bigdown2 -0.11759 (-0.5074) CF / log (TA) t-1 0.00000*** 0.00000*** 0.00000*** (3.8536) (3.9206) (3.9195)
18 Log (TA) t-1 -0.04423*** -0.04490*** -0.04490*** (-6.3445) (-6.3879) (-6.3855) Constant 0.86381*** 0.86530*** 0.86526*** (8.0830) (8.0295) (8.0279)
Region Fixed Effects Yes Yes Yes Industry Fixed Effects Yes Yes Yes Year Fixed Effects Yes Yes Yes Firm Fixed Effects No No No
Observations 19,764 19,764 19,764
R-squared 0.035 0.033 0.033
In this table baseline model was estimated using various measures of investment with pooled OLS regressions. In columns (1), the variable downgrade assumes value one if in the period before sovereign credit rating suffered a downgrade, and zero otherwise. In columns (2) and (3) the variable is defined by a downgrade of three notches in the previous year before and two previous years before, respectively. The sample period is from 1997 to 2011. All estimations include region, year and industry fixed effects. The standard errors used to compute the t-statistics (in brackets) are adjusted for heteroskedasticity and within-firm clustering. Symbols ***, ** and * indicate statistical significance at the 1%, 5% and 10% levels, respectively.
4.2. Hypothesis 2: Investment-to-price sensitivity should decrease less in
non-investment grades following a credit rating downgrade, ceteris paribus.
Table 8 displays the relationship between investment-to-price sensitivity and sovereign credit rating downgrades, according to the category of the rating. Ratings are divided into two groups: first group is the home government investment grade rating – from AAA (24) rating to BBB- (15) rating; second group is the home government non-investment grade rating – under BBB- (15) rating.
19
When an investment opportunity is identified, the manager assesses whether the project worth more than the capital needed to undertake, using methods as NPV, where the cost of capital has a relevant role. Through external financing is possible to reduce the cost of capital of a company, which means that the possibility of using the capital markets will influence investment decisions. As firms of low home government rating countries (second group) could find themselves deprived of access to the capital market and also may face more difficulties to survive, it is expected to have a positive sensitive to the prices informativeness. First group firms are also expected to have positive but lower sensitive to the prices informativeness. After a sovereign credit rating downgrade is expected that investment grade ratings to suffer a more relevant decrease in investment-to-prices sensitivity, because non investment grades already faced before some of the new issues that investment grades didn’t.
As expected investment is positively related to stock price (Q), because market’s feedback that is useful for managers when they have an investment decision. The coefficient on Qi,t-1 is statistically significant at 1% level in all model specifications.
However, for first group firms the effects of stock price on investment is -0.1012 (0.0141 + (-0.1153)), which wasn’t expected. Table 4 shows that investment grade sensitivity is negative and statistically significant before the exogenous shock. It might happen because the average size for the first groups is higher, which might reflect some empire building decisions, for example. However, it should be deeply explored in another work.
After a worsening in the macroeconomic fundamentals, given by a sovereign credit rating downgrade, first group [(0.0141 + -0.0147 + -0.1153 + -0.1110) = -0.227] and second group [(0.0141 + -0.0147) = -0.006], both evidence a negative relationship between stock price (Q) and investment. As expected investment grade ratings have higher negative effects on this relationship.
The results in Table 8 show that the coefficient is negative but it isn’t statistically significant for the investment-to-price sensitivity after the informational environment shock (Qt-1 x Deteriorationt-1). It also show that investment grade ratings have negative
and statistically significant coefficients on investment-to-price sensitivity before (Qt-1 x
Invratt-1) and after (Qt-1 x Deteriorationt-1 x Invratt-1) the informational environment
20
prior studies, which is negative. While cash flows over firm size’ proxy is zero. Both control variables are statistically significant.
Table 8: Effects in investment grade and in non-investment grade
Investment (capex over lagged PPE) “Invrat” (1) Qt-1 0.01410*** (10.0685) Deteriorationt-1 -0.04422 (-1.2142) Qt-1 x deteriorationt-1 -0.01470 (-0.3837) Invratt-1 0.14424*** (5.7249) Qt-1 x Invratt-1 -0.11526*** (-3.5482) Qt-1 x deteriorationt-1 x invratt-1 -0.11104*** (-2.8095) CF / log (TA) t-1 0.00000*** (3.4210) Log (TA) t-1 -0.04014*** (-6.5624) Constant 0.73609*** (7.6650)
Region Fixed Effects Yes Industry Fixed Effects Yes
21
Firm Fixed Effects No
Observations
19,764
R-squared
0.040
Table 8 shows the estimated effects of a downgrade in investment grade and in non-investment grade. Deterioration is a dummy variable that is equal to one after sovereign downgrades until the rating increase again, assuming then the value zero. Invrat is a dummy variable that takes value one if there it’s an investment-grade sovereign rating, and zero otherwise. The sample period is from 1997 to 2011. All estimations include region, year and industry fixed effects. The standard errors used to compute the t-statistics (in brackets) are adjusted for heteroskedasticity and within-firm clustering. Symbols ***, ** and * indicate statistical significance at the 1%, 5% and 10% levels, respectively.
4.3. H3: Investment-to-price sensitivity should decrease more after the crisis than
before the crisis following a credit rating downgrade, ceteris paribus.
Table 9 displays the relationship between investment-to-price sensitivity and sovereign credit rating downgrades before and after the late 2000’s crisis. “After” is a dummy variable that assumes the value one if it’s after the year 2007, and zero otherwise. It isn’t possible to affirm that there aren’t other unobservable factors that influence the coefficients.
Most of the literature suggests that capital markets are efficient in the weak and semistrong form, so prices reflect all the relevant available information. So prices should be positively related with investment. Though, in a bull market it’s possible that managers pay less attention to market prices informativeness than in a bear market, due to the marginal effects. This idea is similar to the idea that the risk aversion has an ambiguous pattern, where the marginal effect of losses may be higher than the marginal effects of gains for the same unity variation. So it is expected that after the crisis prices informativeness become more relevant in managers’ investment decision.
22
The influence of omitted factors cannot be ruled out, because there may be other events that improve the price informativeness. One event that improves the price informativeness is for example IFRS adoption. Loureiro and Taboada (2014) evidence that IFRS adoption, which is an exogenous informational shock that contributes to higher transparency. The expected trend is that prices will improve its’ informativeness, through several channels as legislation improvements, higher transparency, among others.
Investment-to-price sensitivity, as it was expected, isn’t statistically significant because – despite market’s feedback be useful for managers when they have an investment decision – during a bull market it might not be that relevant as it should in managers’ investment decision. After the crisis, investment is positively related to stock price (Q) consistent with my expectations.
An exogenous shock on the informational environment, such as a sovereign credit rating downgrade, is expected to decrease the price informativeness for managers. Though, the investment-to-price sensibility is negative and not statistically significant, before (Qt-1 x
Deteriorationt-1) and after (Qt-1 x Deteriorationt-1 x After), against what was expected.
Total assets logarithm (firm size’ proxy), have the expected sign documented in prior studies, which is negative. While cash flows over firm size’ proxy is zero. Both control variables are statistically significant.
Table 9: Effects in investment-to-price sensitivity after the late 2000’s crisis
Investment (capex over lagged PPE) After (1) Qt-1 -0.01962 (-1.1782) Deteriorationt-1 -0.05486 (-1.6431) After - Deteriorationt-1 x After 0.00274
23 (0.0524) Qt-1 x Deteriorationt-1 -0.04702 (-1.4592) Qt-1 x After 0.03443** (2.0644) Qt-1 x Deteriorationt-1 x After -0.05043 (-0.5743) CF / log (TA) t-1 0.00000*** (3.6075) Log (TA) t-1 -0.04281*** (-6.3870) Constant 0.86091*** (8.2950)
Region Fixed Effects Yes
Industry Fixed Effects Yes
Year Fixed Effects Yes
Firm Fixed Effects No
Observations 19,764
R-squared 0.037
Table 9 presents the estimated effects of a downgrade during the late 2000’s crisis.
Deterioration is a dummy variable that is equal to one after sovereign downgrades until
the rating increase again, assuming then the value zero. After is a dummy variable that takes value one if it is later than 2007, and zero otherwise. The sample period is from 1997 to 2011. All estimations include country, year and industry fixed effects. The standard errors used to compute the t-statistics (in brackets) are adjusted for heteroskedasticity and within-firm clustering. Symbols ***, ** and * indicate statistical significance at the 1%, 5% and 10% levels, respectively.
24
5. CONCLUSIONS
This work contributes to the effects of macroeconomic factors’ literature, such as sovereign credit rating downgrades, on the informational role of market prices, showing that prices are a relevant system of signals for managers’ investment decisions, allowing optimal allocation of the resources. Though, despite most of the literature shows that prices reflect all the relevant information available results suggest that in a bull market it isn’t relevant for managers’ investment decisions.
Results about the positive relationship between stock prices (Q) and investment are robust for several alternative investment measures and for several alternative variables that change how downgrades are measured.
The five alternative investment measures evidence that stock prices are positively (and statistically significant) related to investment, while a worsening in informational environment affects negatively this relationship, but just in four of the five specifications it’s statistically significant.
The three alternative proxies for downgrades show that investment-to-price sensitivity is in all of them positive and statistically significant. Following a worsening in the informational environment, if a three notches downgrade is measured, in the previous year or in the two previous years, then it isn’t statistically significant. If a downgrade is just measured accordingly to the year before rating variation then it also won’t be statistically significant.
Home government investment grade rating’ firms evidence a negative relationship between stock price (Q) and investment, while non-investment grade home government rating’ evidence a positive relationship. It might be explained by empire building issues, since the average firm of the first type has a higher firm size relative to the second type average firm. After a worsening in the informational environment both present negative relationship, but first type firms present a higher negative effect.
Results document an increase on the investment-to-price sensitivity during the late 2000’s crisis relative (bear market) to the period before (bull market), but a higher decrease following a worsening in the macroeconomic fundamentals.
25
6. Bibliographic References
Afonso, A., 2003. Understanding the determinants of sovereign debt ratings : evidence for the two leading agencies, Journal of Economics and Finance, 27 (1) : 56-74.
Afonso, A., Furceri, D., Gomes, P., 2012. Sovereign credit ratings and financial markets linkages: Application to European data. Journal of International Money and Finance 31, 606-638.
Afonso, A., Gomes, P., Rother, P., 2011. Short and Long-run Determinants of Sovereign Debt Credit Ratings, International Journal of Finance and Economics, 16 (1) : 1-15.
Almeida, Heitor, Igor Cunha, Miguel A. Ferreira, and Filipe Restrepo. 2014. The real effects of sovereign credit rating downgrades. Working paper
Bissoondoyal-Bheenick., E., 2005. An Analysis of the Determinants of Sovereign Ratings’’, Global Finance Journal 15, pp. 251-280
Bond, P., A. Edmans, and I. Goldstein, 2012. The real effects of financial markets.
Annual Review of Financial Economics 4: 339-360.
Cantor, Richard and Frank Packer, 1996. Determinants and impact of sovereign credit ratings, Federal Reserve Bank of New York Economic Policy Review 2, 37-53.
Durbin, Erik and David Ng, 2005. The sovereign ceiling and emerging market corporate bond spreads, Journal of International Money and Finance 24, 631-649.
Ferri, G., Liu, G., and Stiglitz, J., 1999. The Procyclical Role of Rating Agencies: Evidence from the East Asian Crisis, Economic Notes, 3:335-355.
Fama, E.F., and M. Miller, 1972. The Theory of Finance. New York: Holt, Rinehart & Winston.
Foucault, Thierry, and Laurent Frésard, 2012. Cross listing, investment sensitivity to stock price and the learning hypothesis, Review of Financial Studies 25, 3305-3350.
Goh Jeremy and Louis Ederington, 1999. Cross-sectional variation in the stock market reaction to bond rating changes, Quarterly Review of Economics and Finance, Vol. 26, pp. 101-112.
26
Griffin, P A. and Sanvicente, A Z., (1982). Common stock returns and rating changes: a methodological comparison, Journal of Finance 37, pp. 103–119.
Grossman, S., 1976. On the efficiency of competitive stock markets where trades have diverse information. The Journal of Finance 31: 573-585.
Grossman, S.J., and J.E. Stiglitz, 1980. On the impossibility of informationally efficient markets. American Economic Review 70: 393-408.
Hellwig, M.F., 1980. On the aggregation of information in competitive markets. Journal
of economic theory 22: 477-498.
Holthausen, R W. and Leftwich, R W., (1986). The effect of bond rating changes on common stock prices, Journal of Financial Economics 17, pp. 57–89.
Kaminsky, Graciela, and Sergio Schmukler, 2002. Emerging Market Instability: Do Sovereign Ratings Affect Country Risk and Stock Returns? World Bank Economic
Review 16, 171–195.
Sy, Amadou, 2003. Rating the Rating Agencies: Anticipating Currency Crises or Debt Crises, IMF working paper No. 03/122.