Repositório ISCTE-IUL
Deposited in Repositório ISCTE-IUL: 2019-03-13
Deposited version: Post-print
Peer-review status of attached file: Peer-reviewed
Citation for published item:
Prada, M., Godinho, C., Rodrigues, D. L., Lopes, C. & Garrido, M. V. (2019). The impact of gluten-free claim on the perceived healthfulness, calories, level of processing and expected taste of food
products. Food Quality and Preference. 73, 284-287 Further information on publisher's website: 10.1016/j.foodqual.2018.10.013
Publisher's copyright statement:
This is the peer reviewed version of the following article: Prada, M., Godinho, C., Rodrigues, D. L., Lopes, C. & Garrido, M. V. (2019). The impact of gluten-free claim on the perceived healthfulness, calories, level of processing and expected taste of food products. Food Quality and Preference. 73, 284-287, which has been published in final form at
https://dx.doi.org/10.1016/j.foodqual.2018.10.013. This article may be used for non-commercial purposes in accordance with the Publisher's Terms and Conditions for self-archiving.
Use policy
Creative Commons CC BY 4.0
The full-text may be used and/or reproduced, and given to third parties in any format or medium, without prior permission or charge, for personal research or study, educational, or not-for-profit purposes provided that:
• a full bibliographic reference is made to the original source • a link is made to the metadata record in the Repository • the full-text is not changed in any way
NOTICE: This is the author’s version of a work that was accepted for publication in
Food Quality and Preference. Changes resulting from the publishing process, such as
peer review, editing, corrections, structural formatting, and other quality control mechanisms may not be reflected in this document. Changes may have been made to this work since it was submitted for publication. A definitive version was
subsequently published as:
Prada, M., Godinho, C., Rodrigues, D., Lopes, C., & Garrido, M. V. (2018). The impact of gluten-free claim on the perceived healthfulness, calories, level of processing and expected taste of food products. Food Quality and Preference. Advance online publication. doi:10.1016/j.foodqual.2018.10.013
The Impact of a Gluten-Free Claim on the Perceived Healthfulness, Calories, Level of Processing and Expected Taste of Food Products
Marília Prada, Cristina Godinho, David L. Rodrigues, Carla Lopes, and Margarida V. Garrido
Instituto Universitário de Lisboa (ISCTE-IUL), CIS-IUL, Lisboa, Portugal
Note: Marília Prada, Cristina Godinho, David L. Rodrigues, Carla Lopes and
Margarida V. Garrido, Department of Social and Organizational Psychology, ISCTE-IUL, CIS-ISCTE-IUL, Lisboa.
Part of this research was funded by Fundação para a Ciência e Tecnologia with grants awarded to MP (LISBOA-01-0145-FEDER-028008), DLR (SFRH/BPD/73528/2010), and MVG (SFRH/BD/101804/2014) and by a Marie Curie fellowship (FP7-PEOPLE-2013-CIG/631673) awarded to the MVG.
Correspondence concerning this article should be addressed to M. Prada, ISCTE-IUL, Av. das Forças Armadas, Office AA110, 1649-026, Lisboa, Portugal.
Abstract
In recent years, gluten-free (GF) diet has become quite popular among non-celiac individuals and GF versions are now available for an array of processed foods. In this study, we examined how including a GF label in packaging impacts the evaluation of food products in several evaluative dimensions. Participants (N = 202; 63.2% female, Mage = 27.87, SD = 10.72) were presented with images of four food
products and asked to evaluate the healthfulness, caloric content, expected taste and level of processing of each product. Overall, results showed that GF (vs. control) products were perceived as more healthful, as having fewer calories and as less processed. No main effect of the GF label was observed for expected taste. In some cases, the impact of the GF label was moderated by the type of product. These findings were independent of participants’ positive beliefs toward GF diet, and of their low self-reported knowledge about GF products. Our findings clarify a potential source of bias for the consumer and may inform evidence-based strategies or policies aiming to promote healthy eating habits.
Keywords: gluten-free; processed food; food perception; healthfulness; taste; calories; food level of processing.
1. Introduction
Nowadays, in addition to objective nutritional data, food packages often include a myriad of information such as claims regarding how and where that food was
produced (e.g., “organic”; “local”) as well as claims about the presence or absence of specific substances (e.g., “with vitamin C” or “gluten free”).
People tend to perceive food either as “healthy” or “unhealthy” (Oakes & Slotterback, 2001); hence, inferring the healthfulness of a product based on a single attribute is potentially problematic, in particular because seeking nutritional
information becomes less likely (Williams, 2005). For example, a consumer who chooses a product with a front-of-package “low fat” claim may ingest more sugar than intended (Wansink & Chandon, 2006), because lower fat versions of foods often contain more sugar (Nguyen, Lin, & Heidenreich, 2016). Therefore, it is highly relevant to understand how the presence of such claims can shape the way consumers perceive and behave toward food. To illustrate, research has shown that based on an “organic” claim, individuals infer proprieties unrelated to the food production method. Specifically, in comparison to conventional food, organic food is generally perceived as more healthful, safer to consume, tastier, as well as less caloric and less processed (for a review, see Prada, Garrido, & Rodrigues, 2017). In the current study, we experimentally examine how a claim related to product composition – gluten-free (GF) – influences the perception of food exemplars.
There has been a substantial increase in the availability of “free-from” products, particularly GF food. The GF diet combines foods that naturally do not include gluten (i.e., a protein that is present in cereals such as wheat, rye or barley) with GF
substitutes of cereal-based foods (e.g., products manufactured with ingredients specially processed to remove gluten, Pellegrini & Agostoni, 2015). Although this
diet is essential for individuals with gluten sensitivity or allergy, the sales trend of GF products is not solely accounted by a higher prevalence of celiac disease (Kim et al., 2016). For example, 25% of Americans reported to consume GF food in 2015 (a 67% increase compared to 2013), while less than 1% have been diagnosed with celiac disease (Bulka, Davis, Karagas, Ahsan, & Argos, 2017). Such discrepancy is even more noticeable for specific groups. For instance, 41% of a sample of 910 non-celiac athletes reported following a GF diet at least half of the time (Lis et al., 2015).
The popularity of GF products among individuals without celiac disease seems to be related to a widespread belief that GF diet is healthier and adequate to manage weight (Christoph, Larson, Hootman, Miller, & Neumark-Sztainer, 2018; Gaesser & Angadi, 2012). However, these alleged benefits of the GF diet have not been supported by systematic comparisons of the nutritional quality between GF and conventional products (e.g., Miranda, Lasa, Bustamante, Churruca, & Simon, 2014; Wu et al., 2015). In fact, research has shown several negative outcomes associated to a GF diet, such as increased fat and calorie intake, overweight prevalence and
deficiencies in minerals and vitamins (for a review, see Reilly, 2016). In light of this evidence, simply adhering to a GF diet (or regularly consuming GF products) is unlikely to confer health benefits to the general population.
In contrast to research on other food claims, experimental research examining the impact of GF claims on food perception is still scarce. The available studies focused on the perception of “free-from” foods indicate that consumers perceive this type of products as more healthful than conventional ones. For example, Priven, Baum, Vieira, Fung and Herbold (2015) presented two identical packages of crackers, with the exception that only one contained a GF claim. Participants’ task simply consisted in selecting the healthier option and, as expected, the GF option was chosen
more frequently than the control package. Another recent study examining the influence of different “free-from” labels showed that GF bread, pasta and cookies were perceived as healthier than their conventional counterparts (Hartmann, Hieke, Taper, & Siegrist, 2018).
The current study aims to replicate these findings (i.e., impact of the GF claim on perceived healthfulness) and further examine if the impact of the GF claim also extends to other evaluative dimensions. Indeed, previous research has shown that food claims may also influence ratings of perceived caloric content, expected taste and level of processing (i.e., the amount of transformation a given food product underwent until its current stage; Prada, Garrido et al., 2017).
In contrast with previous studies (Hartmann et al., 2018; Priven et al., 2015), we manipulated the type of claim (i.e., GF vs. control) using a between-participants design to reduce the likelihood of task demands. We expected foods with the GF claim to be perceived as more healthful than products without such claims. Likewise, we also expected GF products to be evaluated as having fewer calories. Predictions for the other two dimensions were not as straightforward. Following past evidence, we expected participants to perceive GF products as tastier and less processed than control ones, showing a halo effect (see, Chandon & Wansink, 2007; Prada, Rodrigues, & Garrido, 2016). However, the GF label could also negatively impact these evaluations. For instance, it was recently suggested the existence of lay beliefs regarding the inferior taste of some GF products (Shin & Mattila, 2018) and these products could be perceived as more processed because some need to undergo particular transformations to remove gluten.
2. Method
The sample included 208 Portuguese speaking individuals who volunteered to collaborate in an online study. Six of the participants were excluded because they reported to follow a GF diet due to medical recommendation (e.g., diagnosed with celiac disease). The final sample included 202 participants (63.2% female, Mage =
27.87, SD = 10.72; 55.0% were students and 40.1% were employed; 54.5% completed at least a college degree). Sample size was determined based on previous research (e.g., Prada, Garrido, et al., 2017; Priven et al., 2015).
The design included two factors: 2 (claim: GF vs. control) x 4 (product: flour, bread, rice, rice crackers). The second factor was manipulated within-participants.
2.2 Procedure and Measures
All procedures were conducted in accordance with The Code of Ethics of the World Medical Association (Declaration of Helsinki). Individuals were invited through social network websites to collaborate in a consumer behavior web survey (hosted in Qualtrics) about the perception and evaluation of food images. After reading the informed consent information and agreeing to participate, participants provided sociodemographic information (i.e., age, gender, occupation and education). The main task consisted of evaluating four packaged food products (flour, bread loaf, rice and rice crackers, presented in a random order)1. Participants were randomly
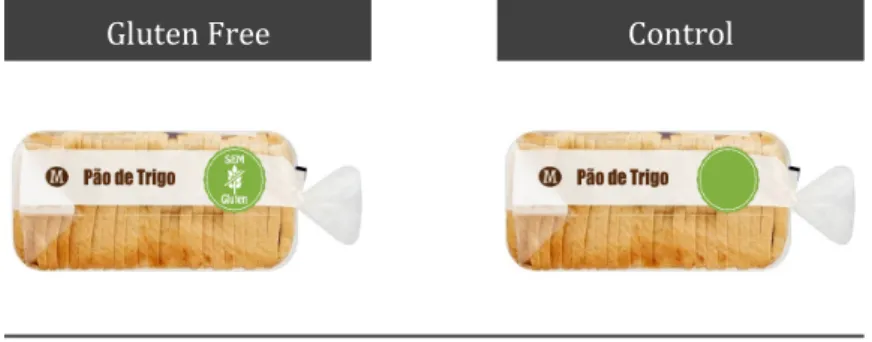
assigned by the software to one of the conditions. In the experimental condition (n = 107), we included a GF label (green circle with the crossed grain symbol and “gluten free” information) in the packages, whereas in the control condition (n = 95) a similar label (green circle without verbal information) was placed in the same position (see example in Figure 1). Participants were asked to indicate their subjective evaluation
1 These images were retrieved from the webpage of an international grocery retailer and edited to
of each product in four evaluative dimensions using 9-point rating scales (“In my opinion, this product is…” 1 = Not at all healthful/tasty/caloric/processed to 9 = Very
healthful/tasty/caloric/processed, Prada, Rodrigues, Garrido, & Lopes, 2017),
presented in random order. Next, participants reported their dietary habits regarding gluten consumption (e.g., “I follow a GF diet because I was diagnosed with celiac disease by a healthcare practitioner”). This was followed by the assessment of their beliefs about the GF diet using 9-point rating scales (five items, “In your opinion, when compared to a conventional diet, the GF diet is…”, 1 = Less
caloric/healthful/adequate to weight loss/processed/natural to 9 = More
caloric/healthful/adequate to weight loss/processed/natural). Lastly, we assessed
participants’ knowledge about GF products using 9-point rating scales. Specifically, they were asked to subjectively rate their knowledge ("How do you rate your
knowledge about GF products?", 1 = Very low to 9 = Very high) and then asked to indicate whether a group of 14 food products2 typically contain gluten or not (1= Certainly does not contain gluten to 9 = Certainly contains gluten).
Figure 1. Example of materials (bread) used in the GF and control conditions.
2.3 Data Analysis
2 The products included the food exemplars used in the current study and 10 others selected on the
basis of previous studies (e.g., Silvester, Weiten, Graff, Walker, & Duerksen, 2016). Some of the foods typically include gluten (i.e., wheat flour, wheat bread, sausages, seafood sticks, crispbread), and other foods typically do not (i.e., rice, rice crackers, milk, balsamic vinegar, cocoa, flavored yogurt, beans, corn).
Control Gluten Free
To characterize our sample, we examined participants’ beliefs about a GF diet by considering each belief separately, as well as by computing a general index
comprising the five items (α = .78; items regarding caloric content and weight loss adequacy were reverse-coded). We also analyzed participants´ self-reported
knowledge about GF products and certainty about the gluten content of products. In these analyses, we compared mean scores against the scale midpoint (i.e., one-sample
t tests, test value: 5). Moreover, we checked if the GF and the control groups differed
regarding the beliefs about GF and self-reported knowledge (independent samples t test). To test our main hypotheses regarding the impact of the GF claim on food evaluation we conducted a 2 (claim) x 4 (product) mixed repeated-measures ANOVA for each of the four evaluative dimensions.
3. Results
3.1 Beliefs about GF diet and Knowledge about GF products
Overall, participants evaluated the GF diet more positively (M = 5.57, SD = 1.33) than a conventional one, p < .001. No differences between the GF and control groups were found in the general beliefs index about these diets, t(200) = 0.23, p = .818. Specifically, the GF diet was perceived as more healthful (M = 5.98, SD = 1.77), less caloric (M = 5.97, SD = 1.56) and as more adequate to weight loss (M = 5.70, SD = 1.79), all ps < .001, being equally rated, on average, as natural (M = 5.00, SD = 1.91), p = 1.000, and processed (M = 5.20, SD = 2.06), p = .173. Nonetheless, participants´ self-reported knowledge about GF products was low (M = 3.30, SD = 2.06), t(201) = 11.74, p < .001. Again, no differences between the GF and control groups were found in relation to knowledge about GF products, t(200) = 0.15, p = .880.
Additionally, we also asked participants to indicate how certain they were about the gluten content of food products (see Table 1).
Table 1
Judgments about the Gluten Content of 14 Food Products
M SD Typically GF Milk 4.76 2.98 Vinegar 3.06*** 2.13 Rice 5.64*** 2.75 Cocoa 4.49** 2.48 Oats 5.34 2.80 Rice Crackers 5.18 2.79 Yogurt (flavored) 4.71 2.81 Beans 3.70*** 2.44 Corn 5.27 2.74 Total 4.68** 1.55
Typically with Gluten
Flour (wheat) 7.56*** 2.01 Sausages 5.00 2.66 Bread (wheat) 7.85*** 1.81 Seafood sticks 4.04*** 2.72 Crispbread 7.33*** 1.93 Total 6.35*** 1.30
Note. Response scale: 1= Certainly does not contain gluten; 9 = Certainly contains gluten. No
differences between the GF and control groups were found for judgments about the gluten content of each food product, all t < 1.
Asterisks represent significant differences against the scale midpoint. *** p £ .001, ** p £ .010.
As shown in Table 1, judgments about gluten content varied according to the product. For products that are typically GF, participants were quite certain about the absence of gluten in certain cases (e.g., vinegar, beans), but unsure in other cases (e.g., milk, oats). For products that typically contain gluten, participants were certain about bread, flour and crispbread, and unsure about sausages. Notably, participants were quite certain that rice contains gluten (which is actually not the case) and that seafood sticks do not (even if they actually do).
As expected, we found a main effect of the GF claim on perceived
healthfulness, F(1, 200) = 4.93, p = .028, ηp2 =.024, caloric content, F(1, 200) = 8.85, p = .003, ηp2 =.042, and level of processing, F(1, 200) = 4.15, p = .043, ηp2 =.020. As
shown in Table 2, products with a GF claim were perceived as more healthful, less caloric and as less processed than the same products without such claim (i.e., control condition). However, no effects were detected for expected taste, F(1, 200) = 0.73, p = .396, ηp2 =.004.3
There was also a main effect of type of product on healthfulness, F(3, 600) = 96.86, p < .001, ηp2 =.326, caloric content, F(3, 600) = 114.77, p < .001, ηp2 =.365,
taste, F(3, 600) = 68.80, p < .001, ηp2 =.256, and level of processing, F(3, 600) =
44.23, p < .001, ηp2 =.181. For example, post-hoc comparisons showed that bread was
rated as the least healthful, all ps < .019, the most caloric, all ps < .004, and the most processed product, all ps < .001 (see Table 2).
Results showed that claim did not interact with product for healthfulness, F(3, 600) = 0.95, p = .417, ηp2 =.005, neither for level of processing, F(3, 600) = 1.78, p =
.151, ηp2 =.009. Instead, there was a significant interaction for caloric content, F(3,
600) = 5.05, p = .002, ηp2 =.025 , and for taste, F(3, 600) = 7.75, p < .001, ηp2 =.037.
Planned contrasts showed that GF (vs. control) bread, t(200) = 3.83, p < .001, d = 0.54, and rice, t(200) = 3.33, p = .001, d = 0.47, were perceived as less caloric. Furthermore, GF (vs. control) rice crackers were rated as tastier, t(200) = 2.13, p = .035, d = 0.30, whereas GF rice was rated as less tasty, t(201) = -4.63, p < .001, d = 0.65.
Table 2
Means and Standard Deviations for Each Dimension According to Claim and Food Product
Flour Bread Rice Rice Crackers Total
M SD M SD M SD M SD M SD Healthfulness Control 4.77 (1.57) 4.19 (1.98) 6.12 (1.47) 6.54 (1.69) 5.401 (1.08) Gluten Free 5.12 (1.55) 4.79 (1.92) 6.42 (1.57) 6.65 (1.63) 5.75 2 (1.13) Total 4.96b (1.56) 4.52a (1.97) 6.28c (1.53) 6.60c (1.66) Calories Control 5.42 (1.81) 6.17 (1.58) 5.55 (1.54) 3.18 (1.44) 5.082 (1.04) Gluten Free 5.11 (1.80) 5.29 (1.67) 4.80 (1.62) 3.32 (1.70) 4.63 1 (1.09) Total 5.26b (1.81) 5.70c (1.68) 5.15b (1.62) 3.25a (1.58) Taste Control 4.11 (2.02) 5.23 (2.08) 7.03 (1.51) 4.04 (2.28) 5.101 (1.18) Gluten Free 3.91 (2.03) 5.26 (2.04) 5.94 (1.82) 4.73 (2.30) 4.96 1 (1.23) Total 4.00a (2.02) 5.25b (2.05) 6.45c (1.77) 4.41a (2.31) Processing Control 5.57 (1.89) 6.84 (1.88) 4.71 (1.81) 5.53 (1.82) 5.662 (1.08) Gluten Free 5.16 (2.02) 6.13 (1.78) 4.51 (1.63) 5.54 (1.77) 5.331 (1.18) Total 5.35b (1.97) 6.47c (1.86) 4.60a (1.71) 5.53b (1.79)
Note. Means in the same line – a,b,c,d – refer to the main effect of food product (Bonferroni adjustment
for multiple comparisons). Means in the same column – 1,2 – refer to the main effect of claim. In both
cases, means with identical superscripts did not differ significantly.
4. Discussion
Free-from products are a widespread trend, particularly GF options of an array of processed foods (from flour and bread, to desserts and candy). In this study, we examined how the inclusion of a GF label shapes the way consumers perceive food products. Overall, our results suggest that participants inferred positive attributes based on this label and are consistent with a halo effect (see Prada et al., 2016). Indeed, not only GF products (vs. control) were perceived as more healthful (e.g., Priven et al., 2015), but also as less caloric and less processed. In some cases,
however, the impact of the claim was moderated by the type of product. For instance, the advantage of including a GF label on caloric content was only observed for bread
and rice. For expected taste, there was also an advantage of the GF label for rice crackers. In contrast, participants reported a negative expectation regarding the taste of GF rice.
Results also showed that, although participants report having low knowledge about GF products, they view GF diet more positively than a conventional one (e.g., more healthful and adequate to lose weight). Arguably, these positive beliefs are likely to be associated with the acceptance of GF products among non-celiac individuals. To further understand this matter, a comprehensive assessment of shopping patterns and consumption habits of GF products should be included in future studies. Moreover, our study does not allow to conclude if our findings were due to the impact of the specific GF label or reflect a general positivity to “free-from” products. For example, Priven et al. (2015) found that a factitious claim (i.e., “MUI-free”) produced a pattern of results (i.e., increased perceived healthfulness) similar to the GF claim. This hypothesis should also be tested in future studies.
We assessed the impact of the GF claim in the evaluation of four products, which contrasts with the single product approach in previous research (e.g., Priven et al., 2015; Shin & Mattila, 2018). Still, in order to test the generality of the effect, it is also relevant to further extend the number of food exemplars under evaluation. Moreover, it would be important to compare the impact of the GF claim in the evaluation of different types of foods (e.g., less vs. more processed; hedonic vs. utilitarian). For example, the level of processing of food has shown to moderate the impact of an organic claim (e.g., Prada, Garrido, et al., 2017).
5. Conclusion
The current findings indicated that, overall, participants reported a low level of knowledge about GF products and were unsure about the gluten content of several
food items. Nonetheless, they reported having positive beliefs about the GF diet (e.g., more healthful and more adequate to weight loss than a conventional diet). These positive expectations about GF products were also observed in the evaluation of food exemplars.
Importantly, we showed that the impact of a GF claim is not restricted to the healthfulness dimension, but also extends to the perception of how caloric and processed a food product is. Our findings are therefore relevant for the development of evidence-based interventions and policies aimed to promote awareness about the impact of GF claims on food perception. Specifically, it is important to help
consumers assess the nutritional quality of GF products in order to prevent potential bias, and ultimately facilitate healthier food choices.
6. References
Bulka, C. M., Davis, M. A., Karagas, M. R., Ahsan, H., & Argos, M. (2017). The unintended consequences of a gluten-free Diet. Epidemiology, 28, e24–e25. doi:10.1097/EDE.0000000000000640
Chandon, P., & Wansink, B. (2007). The biasing health halos of fast-food restaurant health claims: Lower calorie estimates and higher side-dish consumption intentions. Journal of Consumer Research, 34, 301–314. doi:10.1086/519499 Christoph, M. J., Larson, N., Hootman, K. C., Miller, J. M., & Neumark-Sztainer, D.
(2018). Who values gluten-free? Dietary intake, behaviors, and
sociodemographic characteristics of young adults who value gluten-free food.
Journal of the Academy of Nutrition and Dietetics, 118, 1389–1398.
Gaesser, G. A., & Angadi, S. S. (2012). Gluten-free diet: Imprudent dietary advice for the general population? Journal of the Academy of Nutrition and Dietetics,
112, 1330–1333. doi:10.1016/j.jand.2012.06.009
Hartmann, C., Hieke, S., Taper, C., & Siegrist, M. (2018). European consumer healthiness evaluation of ‘Free-from’ labelled food products. Food Quality
and Preference, 68, 377–388. doi:10.1016/j.foodqual.2017.12.009
Kim, H.-S., Patel, K. G., Orosz, E., Kothari, N., Demyen, M. F., Pyrsopoulos, N., & Ahlawat, S. K. (2016). Time trends in the prevalence of celiac disease and gluten-free diet in the US population: Results from the National Health and Nutrition Examination Surveys 2009-2014. JAMA Internal Medicine, 176, 1716–1717. doi:10.1001/jamainternmed.2016.5254
Lis, D. M., Stellingwerff, T., Shing, C. M., Ahuja, K. D. K., & Fell, J. W. (2015). Exploring the popularity, experiences, and beliefs surrounding gluten-free diets in nonceliac athletes. International Journal of Sport Nutrition and
Exercise Metabolism, 25, 37–45. doi:10.1123/ijsnem.2013-0247
Miranda, J., Lasa, A., Bustamante, M. A., Churruca, I., & Simon, E. (2014). Nutritional differences between a gluten-free diet and a diet containing equivalent products with gluten. Plant Foods for Human Nutrition, 69, 182– 187. doi:10.1007/s11130-014-0410-4
Nguyen, P. K., Lin, S., & Heidenreich, P. (2016). A systematic comparison of sugar content in low-fat vs regular versions of food. Nutrition & Diabetes, 6, e193. doi:10.1038/nutd.2015.43
Oakes, M. E., & Slotterback, C. S. (2001). Judgements of food healthfulness: Food name stereotypes in adults over age 25. Appetite, 37, 1–8.
Pellegrini, N., & Agostoni, C. (2015). Nutritional aspects of gluten-free products.
Journal of the Science of Food and Agriculture, 95, 2380–2385.
doi:10.1002/jsfa.7101
Prada, M., Garrido, M. V., & Rodrigues, D. (2017). Lost in processing? Perceived healthfulness, taste and caloric content of whole and processed organic food.
Appetite, 114, 175–186. doi:10.1016/j.appet.2017.03.031
Prada, M., Rodrigues, D., & Garrido, M. V. (2016). Deliberate choices or strong motives: Exploring the mechanisms underlying the bias of organic claims on leniency judgments. Appetite, 103, 8–16. doi:10.1016/j.appet.2016.03.012 Prada, M., Rodrigues, D., Garrido, M. V., & Lopes, J. (2017). Food-pics-PT:
Portuguese validation of food images in 10 subjective evaluative dimensions.
Food Quality and Preference, 61, 15–25. doi:10.1016/j.foodqual.2017.04.015
Priven, M., Baum, J., Vieira, E., Fung, T., & Herbold, N. (2015). The influence of a factitious free-from food product label on consumer perceptions of
healthfulness. Journal of the Academy of Nutrition and Dietetics, 115, 1808– 1814. doi:10.1016/j.jand.2015.03.013
Reilly, N. R. (2016). The gluten-free diet: Recognizing fact, fiction, and fad. The
Journal of Pediatrics, 175, 206–210. doi:10.1016/j.jpeds.2016.04.014
Shin, J., & Mattila, A. S. (2018). When pizza doesn’t sound as good as usual: Restrained versus unrestrained eaters’ responses to gluten-free menu items.
Cornell Hospitality Quarterly, 1–14. doi:10.1177/1938965518762842
Silvester, J. A., Weiten, D., Graff, L. A., Walker, J. R., & Duerksen, D. R. (2016). Living gluten-free: Adherence, knowledge, lifestyle adaptations and feelings towards a gluten-free diet. Journal of Human Nutrition and Dietetics, 29, 374– 382. doi:10.1111/jhn.12316
Wansink, B., & Chandon, P. (2006). Can “low-fat” nutrition labels lead to obesity?
Journal of Marketing Research, 43, 605–617. doi:10.1509/jmkr.43.4.605
Williams, P. (2005). Consumer understanding and use of health claims for foods.
Nutrition Reviews, 63, 256–264.
Wu, J. H. Y., Neal, B., Trevena, H., Crino, M., Stuart-Smith, W., Faulkner-Hogg, K., … Dunford, E. (2015). Are gluten-free foods healthier than non-gluten-free foods? An evaluation of supermarket products in Australia. The British