Forest Governance without Transparency? Evaluating
state efforts to reduce deforestation in the Brazilian
Amazon
Eduardo Bizzo
1and Gregory Michener
2*
1
Banco Nacional de Desenvolvimento Economico e Social (BNDES), Rio de Janeiro, Brazil
2Brazilian School of Public and Business Administration, Getulio Vargas Foundation (FGV-EBAPE), Praia de
Botafogo, Rio de Janeiro, Brazil
ABSTRACT
Over 60% of the Amazon basin is contained within nine federal Brazilian states. How
transpar-ent are state-level governmtranspar-ents about implemtranspar-enting and enforcing deforestation reduction
policies? Advocates and of
ficials can only influence forest conservation outcomes to the extent
that they have information about the actions
– the inputs and outputs – of front-line local
actors. Leveraging a recently adopted freedom of information (FOI) law, this paper evaluates
how well governments comply with website-based disclosure requirements (active transparency),
and how effectively they respond to FOI requests (passive transparency) on the implementation
and enforcement of deforestation reduction policies. By focusing on how
subnational
administra-tions disclose accountings of forest governance
– the inputs and outputs of governance – the
current study complements an already extensive body of scholarship on
central government
monitoring of forest cover
– the transparency of outcomes. Comparing our results with an
original database of transparency evaluations from Brazil, we
find extremely low levels of
compliance with FOI obligations. We do
find, however, that government agencies possessing
electronic FOI platforms, which help applicants send requests and appeals and accompany
responses, fare better than those without. This and other
findings have implications for the
design of transparency systems, while global results speak to the policy challenges of federalism,
especially dilemmas of subnational policy enforcement. Copyright © 2017 John Wiley & Sons, Ltd
and ERP Environment
Received 22 October 2016; revised 22 April 2017; accepted 9 June 2017
Keywords: transparency; forest governance; freedom of information; Brazil; federalism
*Correspondence to: Gregory Michener, Brazilian School of Public and Business Administration, Getulio Vargas Foundation (FGV-EBAPE), Praia de Botafogo, Rio de Janeiro, Brazil.
E-mail: [email protected]
Published online 25 August 2017 in Wiley Online Library (wileyonlinelibrary.com)DOI: 10.1002/eet.1776
Introduction
H
OW TRANSPARENT ARE STATE-LEVEL GOVERNMENTS ABOUT THEIR ACTIONS TO REDUCE DEFORESTATION IN THE LEGAL AMAZON?Nine of Brazil’s 27 states contain some 60% of the Amazon, a habitat that constitutes half of all remaining1 tropical rainforests and that spans nine countries.Forest governance involves a‘complex, multi-actor, multi-level process’ (Paavola et al., 2009, p. 150) and ‘multiple locations of power, authority, and control’ (Börzel and Fagan, 2015, p. 3).
The above notion of forest governance, one that is characterized by complexity and multiple loci of authority, aptly describes Brazil's situation. Apart from Venezuela, Brazil is the only federal country encompassing part of the Amazon rainforest, and complexity therefore characterizes not only the scale and scope of forest governance, but also the political makeup of the country. In unitary political systems, such as those of Bolivia, Colombia,
Ecuador, Guyana, French Guyana, Peru and Suriname– all of which share the Amazon basin – regional
govern-ments are at the behest of a central authority. By contrast, federal systems consecrate constitutionally autonomous realms of responsibility and, in the case of Brazil, all three tiers of government– federal, state and municipal – pos-sess sovereign powers. The result is that policy coordination dilemmas are perennial (Peters, 1998) and central authorities have weaker powers in forcing subnational entities to comply with cross-jurisdictional directives (for a discussion on Brazil, see Arretche, 2004; Fenwick, 2015).
Given the challenges of coordinating environmental policy, much less forest protection, it should be no surprise that few policy domains have spurred as much activism for transparency as these. Campaigns for greater environmen-tal freedom of information (FOI) found support in the 1998 Aarhus Convention. Some nations, such as Argentina, included guarantees for environmental FOI in their constitutions, even before enacting general FOI measures. Today, activist networks continue to dedicate themselves to extracting formal commitments to the Rio Declaration’s Principle 10 on access to environmental information. These initiatives signal the importance of transparency– defined as the visibility and inferability of information (Michener and Bersch, 2013)– as an essential tool for inter and intra-governmental policy coordination and a foundational dimension of successful governance (Islam, 2006, p. 156).
Fortunately, Brazil possesses an FOI law (12.527/2011) that has been in effect forfive years and, on paper, ranks among the 25 strongest in the world.2Using an original evaluation, we leverage this law to analyze two dimensions of transparency in the nine Brazilian state governments that share responsibility for the country’s Amazon forest. First, we gauge how state-level agencies responsible for deforestation reduction policies respond to FOI requests re-garding the implementation and enforcement of these policies. Second, we assess how agencies are complying with active (website) transparency obligations, such as disclosing expenditures and contracts, as required by Article 8 of the country’s FOI law.
The results show low levels of compliance, much lower than the combined average of all transparency evaluations undertaken in Brazil to date. These results lead to the conclusion that states illustrate resistance to disclosure, par-ticularly in terms of disclosing information on forest governance activities. Although all scores were low, states that scored higher on our evaluation tended to do better on well-known indexes on governance and deforestation. Most encouragingly, states and agencies scored better when they possessed online FOI platforms for requesting, appeal-ing and accompanyappeal-ing responses. These results suggest that, while commitments to FOI in forest governance are lagging, the implementation of simple online mechanisms may motivate greater compliance.
This article is organized as follows. In order to situate the study within its policy context, the following section reviews the literature on transparency and subnational forest governance, as well as the scope and obligations imposed by Brazil’s FOI law. The next two sections present the transparency evaluation’s research design, describ-ing detailed processes of data collection and data analysis. Thefifth section presents results pertaining to evaluations of passive and active transparency, as well as a transparency index that aggregates all results. Thefinal section discusses results in light of major transparency evaluations in Brazil, and outlines avenues for further research.
1The Legal Amazon is a political-administrative division encompassing the totality of the states of Acre, Amapá, Amazonas, Mato Grosso, Pará,
Rondônia, Roraima and Tocantins and part of Maranhão (west of meridian 44°W). A full definition and a map of the Legal Amazon are available at http://www.ibge.gov.br/english/geociencias/geografia/amazonialegal.shtm?c=2
The Challenge of Transparency in Subnational Forest Governance
Little case need be made for the centrality of transparency in forest governance or, indeed, any other form of demo-cratic governance. As defined by Michener and Bersch (2013), transparency implies the visibility of information, in
the sense of it being complete andfindable, as well as the inferability of information, meaning that conclusions
can easily be drawn from the information by relevant audiences. Transparency is a precondition for accountability and public participation, which are core democratic governance processes (Davis et al., 2013, p. 4; Joss, 2010). As the axiomatic phrase‘regulation by disclosure’ communicates, transparency can effectively serve as a baseline form
of governance (Florini, 1998; Gupta and Mason, 2014), which can have‘substantial outcomes in terms of
environ-mental improvement’ (Mol, 2015, p. 154).
In terms of forest governance, transparency fuels processes of inclusiveness, policy coordination, participation, accountability, and measurement and evaluation (Georgiadou et al., 2014; Mol, 2010, pp. 133, 141). Leaders of the Earth System Governance Project, Biermann and his coauthors (2012, p. 56), see mandatory disclosure as‘a central component of a revitalized institutional framework for sustainable development’, and view accountability and legitimacy as two of thefive analytical challenges for research (along with architecture, agency and adaptiveness). As scholars have demonstrated, legitimacy is bolstered when actions are rendered transparent (de Fine Licht et al., 2013).
Broaching forest governance from a more instrumental perspective, transparency is a first-order means of
confronting uncertainty over tenure rights and legal frameworks, as well as exposing inadequate enforcement of forest laws (Blaser, 2010, p. 8). May and his co-authors (2016, pp. 25–28), place emphasis on transparency’s role in generating effective participation. The absence of transparency gives way to opacity in ‘participative’ decision-making processes, facilitating elite dominance of governance institutions, low capacity among environmental
agencies, corruption, a lack of synergy between public policies, and‘severe information gaps and a high degree
of uncertainty’ in relation to land tenure. In terms of strategies to reduce greenhouse emissions, Gebara and Thuault (2013) also stress participation and transparency to better monitor policy implementation, adjust strategies, and improve policy coordination and harmonization.
Within extant studies on forest governance transparency, the focus of most empirical analyses has dwelled upon efforts to monitor forest use (Contreras-Hermosilla, 2011; Fuller, 2006; Ochieng et al., 2016; Rajão and Georgiadou, 2014). Transparency evaluations that assess how governments account for the inputs and outputs of forest governance have received less attention. Awareness of outcomes is critical for governance, but knowledge about inputs and outputs is vital in influencing outcomes.
Brazil
The monitoring of deforestation, particularly by Brazil’s central government, has received considerable scholarly attention. Authors have lauded Brazil’s sophisticated remote sensing (Fuller, 2006; Ochieng et al., 2016) and have
commended the third sector for innovative forest monitoring initiatives such as the Instituto Centro de Vida’s
Forest Monitoring System and Imazon’s Deforestation Alert System. Most prominently, Brazil has been praised
for the 2004 development of its DETER program, a Real-Time System for Detection of Deforestation, which enables enforcement agencies to closely monitor and quickly act within areas of illegal deforestation activity (Assunção et al., 2012, p. 10).
DETER3, abetted by a host of other efforts– such as the expansion of protected areas, restricting access to credit for environmental lawbreakers, and soy and beef supply chain interventions– has contributed to reducing rates of deforestation in the Amazon by approximately 80% since 2004 (Assunção et al., 2012; Cunha et al., 2016; Gibbs et al., 2016; Nepstad et al., 2014).
Yet in 2015, precipitous declines in the country’s finances and a spike in unemployment coincided with sharp
rises in deforestation rates, marking the end of a decade of incremental reductions. The post-2015 context– one
of declining federal budgets, shifting policy priorities, uncertainty about upcoming internationalfinancial support
3Even Brazil’s sophisticated remote sensing system has its limitations, which require improvements. One example is that deforestation has
and unpredictable rates of deforestation (Fearnside, 2015)– signals the imperative to improve governance through examining inputs and outputs of policy action.
The Challenge of Brazilian Federalism
This imperative is particularly critical in a federal system such as Brazil’s, where coordination and collective action dilemmas threaten the conservation of common pool resources, such as forests (Hudson, 2014). Federalism complicates environmental governance in at least three ways: different levels of government complicate policy coordination, the problems of‘fiscal federalism’ constrain local investment in conservation (Balme and Ye, 2014, p. 150) and central governments have limited means of punishing policy defections that might result due to private sector lobbying or cooptation, among other reasons.
Fortunately, some attention has been devoted to addressing coordination challenges in Brazil. This is particularly
the case with regards to the REDD+ (Fatorelli et al., 2015), a set of strategies ‘to reduce carbon emissions by
preventing deforestation and forest degradation, and the enhancement of carbon stocks’ (Duchelle et al., 2014, p.
54). However, the challenges are daunting. Writing about Brazil’s three autonomous levels of government,
Contreras-Hermosilla (2011, p. 187) affirms that ‘in some cases they can wield conflicting authority over the same environmental matter’. Neves (2012, p. 141) notes that Brazil has ‘a history of intergovernmental relations [that exhibit] little cooperation’. In evaluating Brazil’s ‘Plan for the Prevention and Control of Deforestation in Amazon’ (PPCDAm), Maia et al. (2011, p. 51) write.
The PPCDAm, which was constructed according to the logic of coordinating initiatives in different ministries and levels of government, did not demonstrate the necessary level of coordination and integration. There was, in the second phase of the project, low participation of the states in the implementation of actions, as well as lack of vertical integration of formal governance structures.
National policies, such as the PPCDAm, are a critical means of generating‘transparency and stakeholder
engage-ment’ among state and municipal governments (García-Sánchez et al., 2013, p. 337). Yet beyond monitoring, the
most important legal mechanism to promote transparency has been Brazil’s sweeping FOI law (12.527/2011).
Brazil’s Freedom of Information Law
Brazil’s FOI law defines ‘publicity as the general precept, and secrecy as the exception’ (Article 3:I) – a forceful statement of the public interest in accessing government information. It regiments multiple constitutional provisions for FOI and encompasses all three branches and levels of government, state-owned enterprises, and non-profits that receive public money.
As strong as FOI laws might be on paper, they are notoriously difficult to enforce in practice. Variation in adher-ence to Brazil’s law is striking (Balbino Ferreira et al., 2014). As evaluations by Michener et al. (2014, pp. 38–46; Michener, 2016) show, while the federal government responds to FOI requests as well as or better than many developed countries, Brazilian cities and states demonstrate no clear patterns of adherence. A well-established explanation for federal compliance is effective oversight by the Ministry of Transparency (Comptroller General), which engages in training and regulation. Of the states evaluated in the pages to come, only the state FOI regulations of Acre and Rondônia assign oversight responsibilities, but the results detailed in the coming pages put this oversight into question.
Evaluations of Amazonian States
Three active transparency indexes suggest that Brazil’s nine Amazonian states – Acre, Amapá, Amazonas,
Maranhão, Mato Grosso, Pará, Rondônia, Roraima and Tocantins– vary considerably in their performance, but tend
to score below the mean. Transparency evaluations disagree on the‘ranking’ of states. These evaluations include the Escala Brasil Transparente (EBT) an index on active transparency (government websites) created by the Ministry of
Transparency (Comptroller General of the Nation),4 the Federal Public Prosecutor’s Ranking Nacional da
Transparência active transparency evaluation5 and a 2016 active evaluation (Michener, 2016). Three Amazonian
4Available at http://www.cgu.gov.br/assuntos/transparencia-publica/escala-brasil-transparente/escala-brasil-transparente [1 September 2016]. 5Available at http://combateacorrupcao.mpf.mp.br/ranking/itens-avaliados/ranking/resultados [1 September 2016].
states consistently rank within the top 10 of 26 states, with the other six behind. The only state to appear in the top 10 in all three of the above indexes is Tocantins, with Maranhão appearing in two.
Environmental transparency evaluations have produced similar results. The Federal Public Prosecutor analyzed 10 federal and 16 state agencies responsible for aspects of Amazonian environmental governance (Ministério Público Federal, 2015). The report assessed responses to requests for information and web-based information regarding land tenure, environmental regularization and economic activities with high environmental impact. The study found significant levels of non-compliance in all agencies, but better performance at the federal level. Despite the merit of this initiative, which provides corrective recommendations on behalf of the Public Prosecutor, the report examined a small number of agencies and did not justify the validity or reliability of the methodology.
Amazonian states do not fare much better on measures of governance. According to the Governance Indicator
developed by de Oliveira and Pisa (2015) and applied to the Brazilian states in 2010, five of the seven poorest
performing states are those encompassing parts of the Amazon basin. The best performing among the nine states
in question appears only in the 11th position (Mato Grosso). Weak capacity is also reflected in the middling
economic contributions of these states. In 2010, the Amazon states represented 15% of the Brazilian population, but only 9% of the country’s GDP.6
The above studies furnish diffuse evidence on generally poor results for Brazil’s Amazonian state-level
governments, but the light they shed on the transparency of forest governance is limited. The contribution of this work is that it focuses on agencies and themes related to deforestation reduction policies in all of Brazil’s states containing Amazon biome. As the next section will detail, perhaps most important is the rigor of the current evaluation, which employs multiple coders and methods that are both sound and transparent.
Data Collection
To restate our objectives, this study aims to gauge the transparency of Brazilian state agencies involved directly and indirectly in deforestation reduction in the Amazon. As a unit of analysis, we chose state agencies for several reasons. States are less studied than the federal government and tend to have higher bureaucratic capacities and more resources than most municipalities, making it more probable that they uphold their transparency obligations. Furthermore, because our evaluative goals involved examining multiple dimensions of conservation initiatives, we felt that Amazon states provided a more comprehensive sample than evaluating disparate municipalities.
Selection of the assessed agencies in the nine Amazonian states was based on the PPCDAm and the state-level ‘Plans for Prevention and Control of Deforestation’ (PPCDs), which were established to consolidate state-level strategies to combat deforestation in 2008.
Dimensions of Forest Conservation Governance and Agencies Analyzed
The state-level PPCDs and the PPCDAm treat deforestation as a complex problem that must involve agencies at different levels of government. By closely examining these plans, it is possible to classify several distinct policy issues related to deforestation reduction.7
(a) Land-use and territorial management, involving state-led planning and reorganization of land-use in order to reduce deforestation, regularize land tenure, and delimit protected areas.
• Zoning.
• Land tenure regularization.
• Creation and management of protected areas.
6The population, GDP andfiscal data were consulted at http://www.ipeadata.gov.br/ [1 September 2016].
7The activity of preventing and combating illegal forestfires and burn-offs is fundamentally a responsibility of the states. The federal government
(b) Monitoring and control improvement, preventing illegal deforestation and forest harvesting and engaging in enforcement.
• Environmental licensing, monitoring, enforcement and regularization. • Combating illicit environmental activities.
• Preventing and combating illegal forest fires and burn-offs.
(c) Fostering sustainable production activities, emphasizing the primacy of ‘standing forest’ while generating
employment.
• Sustainable rural development. • Forest management.
• Technical and scientific development.
Considering the complete policy cycle, multiple agencies are involved in formulating, implementing, coordinat-ing and enforccoordinat-ing the three directives8and nine overlapping policies described above. To reiterate, the focus of the
current study is deliberately bound by a narrow but significant objective, and therefore does not address other
important Amazonian challenges – from policies on indigenous peoples to the rights of local communities,
participation, use rights, ownership and biological diversity, among others.
The evaluation assessed a total of 105 different agencies identified as responsible for distinct aspects of defores-tation reduction policies. Of these, 28 possess multiple policy responsibilities. These agencies may be perused in the online appendix.9
Passive Transparency
The passive transparency analysis evaluated how well agencies responded to freedom of information (FOI) requests. Three metrics were measured: (i) whether agencies responded to requests,10(ii) the accuracy of the response11and (iii) the time in days required to respond.
Each of the 105 state-level agencies selected received two FOI requests. In line with ethical standards, all requests identified the requester as a researcher. Each request was composed of three ‘sub-requests’, which together make up six unique requests in total. These requests were based on the following themes: (i) the formulation, execution and oversight of deforestation reduction policies and (ii) transparency and participation mechanisms in forest governance.
In order to respect the unique expertise of each agency, the requests varied only in terms of the specific issues on which officials were required to respond and all requests were roughly similar in the degree to which they imposed political and bureaucratic burdens. These‘control’ features increase the comparability of results. Only two institu-tions received requests different from those sent to state executive agencies: the Auditing Courts (Tribunais de Contas) and the Public Prosecutor (Ministério Público). The templates for the requests are available in the online appendix.
A total of 210 requests were prepared, two for each of the 105 agencies analyzed. All requests were sent between 18 and 20 August 2015. As established by Brazil’s FOI law, requests can be sent by ‘any legitimate means’ (Article 10, Law 12.527/2011). When available, we used Brazil’s Electronic Citizen Information Service (E-SIC), an FOI plat-form for sending requests, appeals and for accompanying responses. The E-SIC represents an FOI gold standard (Fumega, 2015). The CGU freely provides the E-SIC to interested jurisdictions. If no E-SIC was available, we sent requests via contact forms or emails. In the end, 12% of emails were returned, even though agencies had confirmed email addresses by telephone.
8The fourth phase of the PPCDAm launched in December 2016 and includes a fourth directive related to Normative and Economic Instruments.
This directive is primarily a mechanism to achieve the third directive,‘fostering sustainable production activities’ (Ministério do Meio Ambiente, 2016).
9https://transparencyappendixblog.files.wordpress.com/2017/06/online-appendix.pdf
10A‘response’ is considered any answer to a request, excluding the following: a receipt or protocol number, an update on the status of a request, a
query or clarification regarding the identity or motivation of the requester, a suggestion or request to redirect to a request to another agency. In the case of a redirect, we submit the request again and begin to assess‘responsiveness’ anew.
Active Transparency
The active transparency evaluation consisted of verifying how well agency websites complied with basic statutory obligations set out in the law 12.527/2011. The presence or absence of the following items provided a baseline measure of agency-level transparency:
(1) registry of organizational structure, addresses, telephones of relevant agencies, and hours of operation; (2) registry offinancial agreements and transfers;
(3) registry of expenditures;
(4) information regarding procurement processes, including tenders, their respective results, and procurement contracts;
(5) general information on agency-level programs, actions, projects, or other works; (6) responses to‘frequently asked questions’.
We evaluated compliance with thefirst five of the six items outlined above. Two trained coders independently
scored the websites of 105 agencies between 16 and 25 September 2015.12
Scoring was based on a set of protocols and benchmarks derived from five of the Eight Principles of Open
Government Data. These principles include the following.
• Completeness – the degree to which information meets benchmarks of completeness, as detailed in the methodology.
• Accessibility – the degree of ease in finding information, measured by the placement of links to the desired information.
• Machine-processability – Measured on the basis of document formats and the degree to which these formats can facilitate processing and reuse of data.
• Granularity – the degree to which data is ‘primary’ as opposed to aggregated. This attribute is subsumed by the
benchmarks for‘completeness’.
• Timeliness – how recent the information is, measured in days.
To simplify our assessment, we did not evaluate three of the Eight Principles: open access intellectual property rights, non-discrimination and non-proprietary software formats.
The methodology employed is available in the Online Appendix.
Data Analysis
Passive Transparency
Two coders independently evaluated responses, determining the response rate, coded as either a zero or a one; the accuracy rate, coded on a three-point scale (0, 1, 2); and request-to-response time in days. As per Brazil’s FOI law,
the government has 20 days plus a notified 10 day extension to respond.
The accuracy rate was determined based on the following logic, as specified by Michener et al. (2014): two
points if the response substantially addressed the demands of the query, one point if it minimally addressed demands and zero for responses that were unrelated to what was requested or that provided no substantial
response.13 Two coders independently evaluated all responses for (a) the fact of response or non-response and
(b) the degree of accuracy. Cohen’s kappa served to verify inter-coder agreement. Accuracy scores were averaged, while for responses we used the maximum rather than the mean. According to Table 2 of the online appendix, levels of interrater agreement were high: over 80% for both the accuracy of responses and scoring of active transparency obligations.
12The item‘III – Registry of expenditures’ was considered subsumed by the item ‘II – Registry of financial agreements and transfers’. 13No‘substantial response’ typically means a ‘declaratory’ response: one that denied the request, or informed us that the information did not exist.
Finally, we constructed an index to aggregate all three metrics – responsiveness, timeliness and accuracy. At the agency level, the passive transparency index is the simple average of the two requests: thefirst on deforesta-tion reducdeforesta-tion acdeforesta-tions, the second on transparency and participadeforesta-tion mechanisms. In the passive transparency
index’s formula, when a request elicits a response, accuracy weighs three points, whereas request-to-response
time weighs one. The logic is that an accurate response is valued above all else. Finally, in order to evaluate
differences between requests sent by E-SIC systems and those sent through ‘other means’, we conducted
chi-square tests. Active Transparency
The online appendix illustrates interrater agreement based on Cohen’s kappa, showing almost perfect agreement. In
order to consolidate results, we constructed active transparency indexes based on each agency’s performance. As
‘completeness’ is critical, it was scored out of three points, followed by timeliness (2 points), and accessibility and machine processability (1 point each). Granularity was subsumed by measures of completeness. Timeliness and machine processability were applied only for‘expenditures’ and ‘procurement contracts’.
Aggregate Transparency Indicator
In order to aggregate the results of passive and active transparency evaluations, we constructed a‘transparency indicator’ based on the simple average of the two normalized indexes, weighting each equally. Without normaliza-tion, the eventual disproportionalities between the two indexes would have skewed the overall indicator’s results. Indicators were calculated by state and theme.
We then graphically observed the relationship between transparency and two indicators.
(i) Deforestation reduction – the sum of annual rates of deforestation for two periods of five years from the
PRODES database.14
(ii) Governance– we employed the indicator developed by de Oliveira and Pisa (2015) because it is relatively up to date and complete, and because of a lack of other forest governance indicators for Amazon states. The indicator considers measures of effectiveness, participation, equity, legality, ethics, accountability and transparency. We
are cognizant of some endogeneity– transparency is one of the seven dimensions – but we believe the benefit
of conducting this comparison outweighs relatively small endogeneity effects.
Results
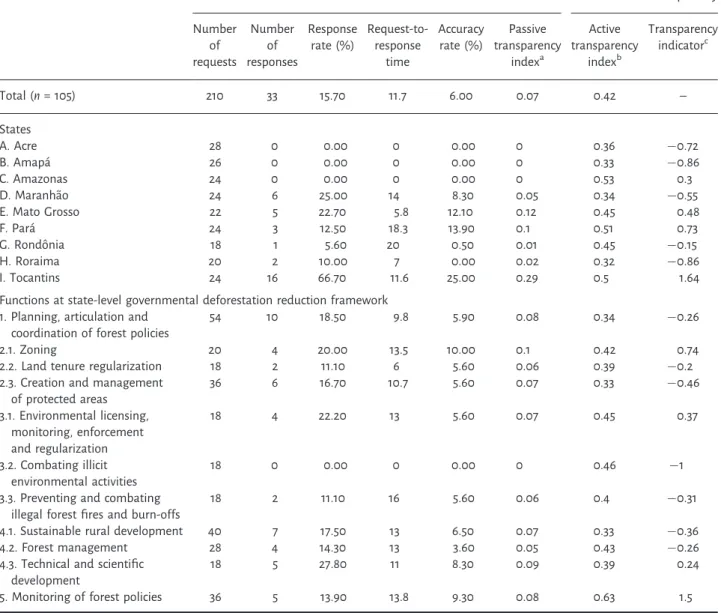
Tables 1 and 2 illustrate the results of our transparency evaluations.
General Results
Regarding passive transparency, results show low compliance. Of 210 requests, only 33 were answered, equivalent to
a 16% response rate. The accuracy rate– which measures minimally relevant responses or better – was only 6%.
Average request-to-response times clocked 12 days. The passive transparency index (105 agencies) averaged 0.07 out of 1. Requests that focused on deforestation scored three times higher (0.09) than those that queried agencies on transparency and participation mechanisms (0.03).
The average of the active transparency index was higher but still low, at 0.42 out of 1. This has much to do
with the fact that 20% or 21 of the 105 agencies either did not have a website or it was offline during the
evaluation period. Of the five items evaluated, the highest scores went to the transparency of ‘expenditures’,
and ‘contracts and procurement’ garnered the lowest results. This ordering accords with other studies (e.g.
Michener, 2016).
Results by State
Comparing results by state, the exception to a generally poor performance was the state of Tocantins, which boasted a 67% response rate on the passive transparency assessment with an accuracy rate of 25%, higher than all other
Organizational structure Expenditures Procurements and contracts Programs and actions FAQs
0.50 0.69 0.15 0.50 0.27
Table 2. Active Transparency index by kind of information
Passive Active Transparency
Number of requests Number of responses Response rate (%) Request-to-response time Accuracy rate (%) Passive transparency indexa Active transparency indexb Transparency indicatorc Total (n = 105) 210 33 15.70 11.7 6.00 0.07 0.42 – States A. Acre 28 0 0.00 0 0.00 0 0.36 0.72 B. Amapá 26 0 0.00 0 0.00 0 0.33 0.86 C. Amazonas 24 0 0.00 0 0.00 0 0.53 0.3 D. Maranhão 24 6 25.00 14 8.30 0.05 0.34 0.55 E. Mato Grosso 22 5 22.70 5.8 12.10 0.12 0.45 0.48 F. Pará 24 3 12.50 18.3 13.90 0.1 0.51 0.73 G. Rondônia 18 1 5.60 20 0.50 0.01 0.45 0.15 H. Roraima 20 2 10.00 7 0.00 0.02 0.32 0.86 I. Tocantins 24 16 66.70 11.6 25.00 0.29 0.5 1.64
Functions at state-level governmental deforestation reduction framework 1. Planning, articulation and
coordination of forest policies
54 10 18.50 9.8 5.90 0.08 0.34 0.26
2.1. Zoning 20 4 20.00 13.5 10.00 0.1 0.42 0.74
2.2. Land tenure regularization 18 2 11.10 6 5.60 0.06 0.39 0.2
2.3. Creation and management of protected areas 36 6 16.70 10.7 5.60 0.07 0.33 0.46 3.1. Environmental licensing, monitoring, enforcement and regularization 18 4 22.20 13 5.60 0.07 0.45 0.37 3.2. Combating illicit environmental activities 18 0 0.00 0 0.00 0 0.46 1
3.3. Preventing and combating illegal forestfires and burn-offs
18 2 11.10 16 5.60 0.06 0.4 0.31
4.1. Sustainable rural development 40 7 17.50 13 6.50 0.07 0.33 0.36
4.2. Forest management 28 4 14.30 13 3.60 0.05 0.43 0.26
4.3. Technical and scientific development
18 5 27.80 11 8.30 0.09 0.39 0.24
5. Monitoring of forest policies 36 5 13.90 13.8 9.30 0.08 0.63 1.5
Table 1. Main results of active and passive transparency evaluations17 a
Considers accuracy rate (weight 3) and request-to-response time (weight 1).
b
Considers‘completeness’ (weight 3), ‘timeliness’, if applicable (weight 2), ‘accessibility’ and ‘machine processability’, if applicable (weight 1).
c
Average of normalizedIpassiveandIactive. 17
states evaluated. In the remaining states, the response rate varied between 6% and 25%, with Acre, Amapá and Amazonas chalking up the lowest performances (0%).
Figures 1 and 2 compare transparency scores with levels of deforestation, and with the Governance Indicator of de Oliveira and Pisa (2015), respectively. It is suggestive that the states with higher transparency scores have also had greater success in reducing deforestation over the pastfive years (as compared to the five years previous to this period), with higher levels of transparency and more effective governance.
Figure 2. Relationship between transparency and governance. [Colour figure can be viewed at wileyonlinelibrary.com] Figure 1. Relationship between transparency and deforestation. [Colour figure can be viewed at wileyonlinelibrary.com]
Results by Policy Theme or Function
In examining policy themes, we observe that 29 of the 105 agencies queried were responsible for more than one thematic policy area. Considering that each agency received a request with several different sub-requests, we can disaggregate requests to calculate a total of 304 unique requests. In this way we obtain better analytical leverage
on how agencies performed by policy theme or‘function’.
Response rates to requests varied between 11% and 24%. Yet agencies responsible for‘technical and scientific
development’, ‘environmental licensing, monitoring, enforcement and regularization’, and ‘zoning’ garnered a
response rate above 20%. Almost all of these agencies employed electronic requesting platforms. For queries on ‘combating illicit environmental activities’ it was highly suggestive to note that we received no responses whatsoever. As for active transparency compliance, the agencies responsible for‘monitoring forest policies’ notably evinced the best performance, scoring highest on the overall transparency indicator. This result seems to reflect the higher bureaucratic capacity of these agencies and the presence of electronic requesting systems. Agencies responsible for ‘combating illicit environmental activities’ scored second on active transparency, while they scored lowest on the passive transparency index. One possible reason for this discrepant result is that these are public agencies responsible for the public security agenda, where cultures of information disclosure and sharing tend to be limited by vertical authority structures and the abundance of information held as‘sensitive’.
FOI Requesting Platforms
It is important to note the dramatic variation of passive transparency results depending upon the means of submitting requests. The highest scoring state, Tocantins, is the only state where all requests to executive agencies were sent using an E-SIC platform. Some of the agencies in the states of Mato Grosso, Maranhão and Pará, which scored highest after Tocantins, also had E-SIC platforms or similar request-and-response platforms on their state transparency portals. Table 3 shows that, while agencies answered 50% of 64 requests submitted via E-SIC or similar systems (30% of total), only 1% of requests garnered responses when they were submitted via other means.15
Discussion
The results point to low levels of transparency for states and state-level agencies responsible for deforestation
reduction policies. Notably, poor results characterize both responses to specific requests concerning forest
governance (passive transparency) and compliance with website active transparency obligations, such as details regarding the organization, policies, expenditures and procurement practices of agencies.
Although results were generally low, variation in performance can provide us with a few key inferences and directions for future research. The superior performance of states with E-SIC systems is clearly an important finding. It is not clear whether platforms are a cause or a result of commitments, but the association is clear either
way. This conclusion is consonant with results found by Michener et al. (2014, pp. 69–75), among other studies.
More research is needed to understand the degree to which E-SIC systems impact performance.
Response to request Requests submitted via E-SIC or similar systems Requests submitted without E-SIC or similar systems Total
Not responded 32 50% 145 99% 177
Responded 32 50% 1 1% 33
Total 64 30% 146 70% 210
Table 3. E-SIC responsiveness Chi square– P-value 7.444 × 10 24.
When the results of the evaluation are analyzed by policy function, the highest performing agencies were those responsible for monitoring: the Auditing Courts (Tribunais de Contas) and the Public Prosecutor (Ministério Público). These institutions tend to have higher institutional capacities; moreover, monitoring activities might be considered less sensitive. By contrast, agencies responsible for policing illicit activities scored lowest. This falls in line with other assessments of public order institutions (Artigo 19, 2017).
Overall, the results point to the need for qualitative research into the causes of poor disclosure. In-depth interviews, process-tracing within institutions and case studies that focus on how particular requests were handled can cast greater light on the‘why?’ and ‘how?’ behind low compliance with transparency.
Results in Comparative Perspective
To put the results of this study into perspective, researchers across Brazil have conducted 13 major transparency
evaluations of different levels and branches of government since the country’s freedom of information (FOI) law
took effect.16 These include 1670 requests sent to 391 agencies and 316 institutions evaluated for active transpar-ency. Of these evaluations, response rates averaged 68% and institutional compliance with active transparency obligations averaged 54%. For all requests sent to executive branches of government (284 agencies), the response rate is 70%. Looking more specifically at subnational transparency, a 2016 evaluation by the FGV involving 401 re-quests and targeting all states and Brazil’s capitals garnered a global response rate of 60.8% and an accuracy rate of
45.9% (Michener, 2016, pp. 176–179). While the above numbers are not excellent, they certainly demonstrate much
higher levels of adherence to Brazil’s FOI law than the current study has encountered – a 16% response rate and 6% accuracy rate, and a 42% compliance rate for active transparency.
Alternative Explanations for Poor State-Level Forest Governance Transparency What explanations might account for this study’s extremely low results? Newness of the FOI Law, Context or the Evaluation’s Design
Afirst set of hypotheses might point to the FOI law itself, or the design or timing of the current evaluation. Some might argue thatfive years is not enough to show results. However, as the above comparative results show, general levels of compliance are much higher than those of the current study. We also believe that it is unlikely that the political impeachment crisis of 2015 threw the bureaucratic apparatus off kilter or might provide an excuse for a temporary lapse in disclosure practices. Furthermore, Michener (2016) undertook evaluations in 2015, and obtained much better results. As for the current evaluation, one might argue that the requests were complex or difficult to
answer. However, requests were customized to refer only to the activities within each agency’s competence in a
demonstrably clear manner. Agencies were also free to provide as many or as few details as they chose; they could have at least responded in some way.
Bureaucratic Capacity
If not the newness of the law or its design, what about the most obvious candidate explanations– political resistance
or bureaucratic capacity? As for bureaucratic capacities, interviews with a prosecutor and an official from the
Ministry of the Environment (MoE),17among others, confirm perceptions that state governments are to various
degrees cash strapped, disorganized and under-capacitated. The official from the MoE affirmed that even the
ministry itself has difficulty obtaining data from the states.
Yet other indexes and evaluations show considerably higher levels of transparency than the current study. Moreover, FOI research shows that training and political will are more important than the intellectual and physical resources of a government (see, for example, Florini, 2007). In this vein of thinking, perhaps the lack of awareness is responsible for low rates of compliance. The FGV’s 2016 report, cited above, found that the states that claimed to have a dedicated administrative unit handling FOI requests included Maranhão, Mato Grosso, Roraima and
16Data from the Transparency Evaluation Network, available at http://transparencyevaluation.net/content/overview [30 March 2017]. 17These officials requested anonymity.
Tocantins (p. 41). Yet, besides Tocantins, none of these states demonstrated minimal compliance in the current evaluation (Michener, 2016, p. 177).
Political or Bureaucratic Resistance
As for evidence of political or bureaucratic resistance, indicators of implementation represent one possible set of signals. The study does show higher performance among states that have made efforts to implement (freely available) E-SIC platforms, which is consonant with the hypothesis that political will matters. However, comparatively higher results still do not account for what, in comparative perspective, are generally low results.
A key consideration here is the role of incentives. The benefits of not providing information – which may be
deficient or inexistent – may be greater for governments than the reputational costs of compliance and corresponding exposure. That the more transparency one provides the more one becomes vulnerable to criticism is among the most powerful paradoxes of transparency obligations. And reputational vulnerability on a policy issue of symbolic and practical import to Brazilians and the international community is sufficient reason to presume incentives for shirking disclosure obligations. The way to mitigate this dilemma is through exogenous enforcement, such as an information
commissioner. However, research indicates that one of Brazil’s most pressing subnational FOI dilemmas seems to
be the scarcity of dedicated, much less effective, oversight institutions. A prosecutor for the state of Pará’s Federal Public Prosecutor (Ministério Público Federal) explained that‘today there are no incentives for state governments to become more transparent’.
In effect, there could be. According to the official from the MoE cited above, prerequisite conditions for obtaining finances from the federal government’s Amazon Fund (Fundo Amazonia) originally included the obligation of state governments to elaborate state forest plans (PPCDs) and to keep these up to date and revised. The fund was to serve partly as a means of capacitating states to attend to the needs of forest conservation. The fund might have made disbursements conditional on minimal levels of transparency.
Conclusion
In light of the comparative evidence and alternative explanations outlined above, poor compliance with transparency obligations encountered in this study appears to be the result of resistance to disclosure. Resistance makes all the more sense given the politically sensitive and complex nature of information on forest conservation. Resistance to disclosure is typically driven by blame avoidance (Hood, 2010), and whether the will to avoid blame stems from under-capacity, FOI training, disorganization or underwhelming policy performance is a question for future research. The importance of the current study is to show that it is exactly where we most need information to evaluate commitments to forest conservation that government commitments to disclosure seem to be among the weakest. Without information, it becomes impossible to assess forest governance. Ensuring compliant inputs and outputs is essential to sustainable, longer-term advances in conserving and governing forests.
A large part of the problem appears to be the lack of enforcement and oversight mechanisms for ensuring compliance with transparency obligations, much less for ensuring adherence to deforestation reduction policies. By giving Brazil’s federal units significant independence in managing their own affairs, oversight and enforcement often go lacking.
In this sense, Mexico– also a federation – provides a model that Brazil might consider emulating. In 2014–15,
Mexico adopted a‘general law’ on FOI in which the National Institute for Access to Information (INAI) oversees
the entire federation, resolving appeals and governing all aspects of information management. Given that NGOs
and Brazil’s Public Prosecutor have successfully intervened in soy and beef supply chains to punish and prevent
deforestation (Gibbs et al., 2016), perhaps these actors might be willing supporters of a Brazilian INAI.
Acknowledgements
The authors would like to thank the research assistance of Jonas Coelho. The views and opinions expressed in this article are those of the authors and do not necessarily reflect the official policy or position of the BNDES.
References
Arretche M. 2004. Federalismo e políticas sociais no Brasil: problemas de coordenação e autonomia. São Paulo Em Perspectiva18: 17–26. https:// doi.org/10.1590/S0102-88392004000200003.
Artigo 19. 2017. Repressão às Escuras: Uma Análise sobre Transparência em Assuntos de Segurança Pública e Protestos. São Paulo. Assunção J, Gandour C, Rocha R. 2012. Deforestation Slowdown in the Legal Amazon: Prices or Policies? CPI Working Paper. Balbino Ferreira F, Marchezini J, Paes B. 2014. Monitoramento da Lei de Acesso à Informação Pública em 2013. Artigo 19: Brasil.
Balme R, Ye Q. 2014. Multi-level governance and the environment: intergovernmental relations and innovation in environmental policy. Environmental Policy and Governance24: 147–154. https://doi.org/10.1002/eet.1635.
Biermann F, Abbott K, Andresen S, Bäckstrand K, Bernstein S, Betsill MM, Bulkeley H, Cashore B, Clapp J, Folke C, Gupta A, Gupta J, Haas PM, Jordan A, Kanie N, Kluvánková-Oravská T, Lebel L, Liverman D, Meadowcroft J, Mitchell RB, Newell P, Oberthür S, Olsson L, Pattberg P, Sánchez-Rodríguez R, Schroeder H, Underdal A, Vieira SC, Vogel C, Young OR, Brock A, Zondervan R. 2012. Transforming governance and institutions for global sustainability: key insights from the Earth System Governance Project. Current Opinion in Environmental Sustainability Open Issue4: 51–60. https://doi.org/10.1016/j.cosust.2012.01.014.
Blaser J. 2010. In Forest Law Compliance and Governance in Tropical Countries: a Region-by-Region Assessment of the Status of Forest Law Compliance and Governance in the Tropics, and Recommendations for Improvement, Sarre A (ed.). FAO–ITTO: Rome, Italy.
Börzel T, Fagan A. 2015. Environmental governance in South East Europe/Western Balkans: reassessing the transformative power of Europe. Environment and Planning C: Government and Policy33: 885–900. https://doi.org/10.1177/0263774X15608985.
Contreras-Hermosilla A. 2011. People, governance and forests– the stumbling blocks in forest governance reform in Latin America. Forests 2: 168–199. https://doi.org/10.3390/f2010168.
Cunha FAF de S, Börner J, Wunder S, Cosenza CAN, Lucena AFP. 2016. The implementation costs of forest conservation policies in Brazil. Ecological Economics130: 209–220. https://doi.org/10.1016/j.ecolecon.2016.07.007.
Davis C, Williams LG, Lupberger S, Daviet F. 2013. Assessing Forest Governance: the Governance of Forests Initiative Indicator Framework. World Resources Institute: Washington, DC, USA.
de Fine Licht J, Naurin D, Esaiasson P, Gilljam M. 2013. When does transparency generate legitimacy? Experimenting on a context-bound relationship. Governance27(1): 111–134.
de Oliveira AG, Pisa BJ. 2015. IGovP: índice de avaliação da governança pública– instrumento de planejamento do Estado e de controle social pelo cidadão. Revista de Administraçao Pública49: 1263–1290.
Duchelle AE, Cromberg M, Gebara MF, Guerra R, Melo T, Larson A, Cronkleton P, Börner J, Sills E, Wunder S, Bauch S, May P, Selaya G, Sunderlin WD. 2014. Linking forest tenure reform, environmental compliance, and incentives: lessons from REDD+ initiatives in the Brazilian Amazon. World Development55: 53–67. https://doi.org/10.1016/j.worlddev.2013.01.014.
Fatorelli L, Gebara MF, May P, Zhang S, Di Gregorio M. 2015. The REDD+ Governance Landscape and the Challenge of Coordination in Brazil. Center for International Forestry Research (CIFOR): Bogor, Indonesia.
Fearnside PM. 2015. Environment: deforestation soars in the Amazon. Nature521: 423–423. https://doi.org/10.1038/521423b.
Fenwick TB. 2015. Avoiding Governors: Federalism, Democracy, and Poverty Alleviation in Brazil. University of Notre Dame Press: Notre Dame, IN.
Florini A. 1998. The end of secrecy. Foreign Policy111: 50–63. https://doi.org/10.2307/1149378.
Florini A (ed.). 2007. The Right to Know: Transparency for an Open World. Columbia University Press: New York.
Fuller DO. 2006. Tropical forest monitoring and remote sensing: a new era of transparency in forest governance? Singapore Journal of Tropical Geography27: 15–29. https://doi.org/10.1111/j.1467-9493.2006.00237.x.
Fumega S. 2015. Information & Communication Technologies and Access to Public Information Laws. World Bank, Consejo para la Transparencia, Red de Transparencia y Acceso a la Información: Washington, DC, USA.
García-Sánchez I-M, Rodríguez-Domínguez L, Frias-Aceituno J-V. 2013. Evolutions in e-governance: evidence from Spanish local governments. Environmental Policy and Governance23: 323–340. https://doi.org/10.1002/eet.1622.
Gebara MF, Thuault A. 2013. GHG Mitigation in Brazil’s Land Use Sector. An Introduction to the Current National Policy Landscape, Working Paper. World Resources Institute: Washington, DC.
Georgiadou Y, Lungo JH, Richter C. 2014. Citizen sensors or extreme publics? Transparency and accountability interventions on the mobile geoweb. International Journal of Digital Earth7: 516–533. https://doi.org/10.1080/17538947.2013.782073.
Gibbs HK, Munger J, L’Roe J, Barreto P, Pereira R, Christie M, Amaral T, Walker NF. 2016. Did ranchers and slaughterhouses respond to zero-deforestation agreements in the Brazilian Amazon? Conservation Letters9: 32–42. https://doi.org/10.1111/conl.12175.
Gupta A, Mason M (eds). 2014. Transparency in Global Environmental Governance: Critical Perspectives. MIT Press: Cambridge, MA. Hood C. 2010. The Blame Game: Spin, Bureaucracy, and Self-Preservation in Government. Princeton University Press: Princeton, NJ. Hudson B. 2014. Dynamic forest federalism. Washington and Lee Law Review71: 1643–1714.
Islam R. 2006. Does more transparency go along with better governance? Economics and Politics18: 121–167.
Joss S. 2010. Accountable governance, accountable sustainability? A case study of accountability in the governance for sustainability. Environmental Policy and Governance20: 408–421. https://doi.org/10.1002/eet.559.
Maia H, Hargrave J, Gómez JJ, Röper M. 2011. Avaliação do Plano de Ação para Prevenção e Controle do Desmatamento na Amazônia Legal: PPCDAm 2007–2010. CEPAL: Brasília, Brazil.
May P, Gebara MF, de Barcellos LM, Rizek MB, Millikan B. 2016. The Context of REDD+ in Brazil: Drivers, Actors and Institutions– 3rd Edition (No. 160), Occasional Paper. CIFOR: Bogor, Indonesia.
Michener G (ed.). 2016. Local Transparency in Brazil: Evaluating Compliance with the Access to Information Law in the States and Largest Cities. FGV–Open Society Foundations: Rio de Janeiro.
Michener G, Bersch K. 2013. Identifying transparency. Information Polity18: 233–242. https://doi.org/10.3233/IP-130299.
Michener G, Moncau LF, Velasco R. 2014. The Brazilian State and Transparency: Evaluating the Application of the Access to Information Law. Fundação Getúlio Vargas–Open Society Foundations: Rio de Janeiro.
Ministério do Meio Ambiente. 2016. Plano de Ação para Prevenção e Controle do Desmatamento na Amazônia Legal (PPCDAm): 4a Fase (2016–2020). MMA: Brasília.
Ministério Público Federal. 2015. Reports and Recommendations of Transparência das Informações Ambientais Project– Grupo de Trabalho Amazônia Legal, Câmara de Meio Ambiente e Patrimônio Cultural do Ministério Público Federal, WWW Document.
Mol APJ. 2010. The future of transparency: power, pitfalls and promises. Global Environmental Politics10: 132–143.
Mol APJ. 2015. Transparency and value chain sustainability. Journal of Cleaner Production 107: 154–161. https://doi.org/10.1016/j. jclepro.2013.11.012.
Nepstad D, McGrath D, Stickler C, Alencar A, Azevedo A, Swette B, Bezerra T, DiGiano M, Shimada J, da Motta RS, Armijo E, Castello L, Brando P, Hansen MC, McGrath-Horn M, Carvalho O, Hess L. 2014. Slowing Amazon deforestation through public policy and interventions in beef and soy supply chains. Science344: 1118–1123. https://doi.org/10.1126/science.1248525.
Neves EMSC. 2012. Política ambiental, municípios e cooperação intergovernamental no Brasil. Estudios Avançados26: 137–150. https://doi.org/ 10.1590/S0103-40142012000100010.
Ochieng RM, Visseren-Hamakers IJ, Arts B, Brockhaus M, Herold M. 2016. Institutional effectiveness of REDD+ MRV: countries progress in implementing technical guidelines and good governance requirements. Environmental Science and Policy 61: 42–52. https://doi.org/ 10.1016/j.envsci.2016.03.018.
Paavola J, Gouldson A, Kluvánková‐Oravská T. 2009. Interplay of actors, scales, frameworks and regimes in the governance of biodiversity. En-vironmental Policy Governance19: 148–158. https://doi.org/10.1002/eet.505.
Peters BG. 1998. Managing horizontal government: the politics of co-ordination. Public Administration76: 295–311. https://doi.org/10.1111/1467-9299.00102.
Rajão R, Georgiadou Y. 2014. Blame games in the Amazon: environmental crises and the emergence of a transparency regime in Brazil. Global Environmental Politics14: 97–115. https://doi.org/10.1162/GLEP_a_00259.
Richards P, Arima E, VanWey L, Cohn A, Bhattarai N. 2017. Are Brazil’s deforesters avoiding detection? Conservation Letters. https://doi.org/ 10.1111/conl.12310.
Supporting information
Additional Supporting Information may be found online in the supporting information tab for this article. Data S1. Online Appendix 1 Agencies’ classification by policy function
![Figure 2. Relationship between transparency and governance. [Colour fi gure can be viewed at wileyonlinelibrary.com]](https://thumb-eu.123doks.com/thumbv2/123dok_br/17912832.849736/10.850.179.616.248.496/figure-relationship-transparency-governance-colour-gure-viewed-wileyonlinelibrary.webp)

