Evolução dos Gastos Públicos no Brasil com base na demografia Public Spending in Brazil: Projections based on the demographic Transition
Resumo
Este artigo faz uma simulação acerca da evolução dos gastos públicos no Brasil com base nas mudanças demográficas. O fim do bônus demográfico, com o envelhecimento da população brasileira e o aumento do peso relativo dos idosos em relação a população em idade ativa, afetará gastos fundamentais como em saúde, educação, programas sócias e previdência. Desta forma, levando-se em consideração somente o componente demográfico analisamos a evolução dos gastos por entes federativos no Brasil. Os gastos com saúde aumentarão em valores absolutos de forma significativa mas devem manter a sua parcela como proporção do PIB. Os gastos com educação irão se reduzir. Como os gastos com educação no Brasil são divididos de acordo com o grau educacional, a redução dos gastos não será linear, mas atingirá todos os níveis governamentais O maior desafio será no pagamento dos benefícios de previdência social. O envelhecimento populacional elevará de forma substancial os gastos com a previdência no Brasil, inviabilizando os diferentes níveis de governo. Desta forma, o maior desafio de curto prazo para governos federal, estadual e municipal é a realização de uma ampla reforma previdenciária que permita a operação das funções básicas de governo nos próximos anos.
Abstract
This paper presents projections of public spending for Brazil in the light of the foreseeable demographic transition the country faces for the next decades. Population aging will affect spending on education, health, social programs and social security. We take into account the demographic projections in order to forecast public spending at local, state and federal levels. Health spending will increase in absolute terms but may maintain its relative weight in GDP. Public expenditures on education will be affected differently at municipal (fundamental), state (high school) and federal (superior) levels, and will be significantly reduced at all levels. Social security system spending will be the biggest challenge at all levels of Government and will require a profound reform of the current rules to limit the absoption of public resources by the old generations.
1 – Introduction
Since the 40´s, Brazil is facing a fast demographic transition, with fertility and mortality rate drops that affects size, growth and age profile (Carvalho e Wong 2008) of the population. United Nations forecasts indicate that in a hundred years time Brazilian population will grow 4.3 while population growth rates decline from 2.96% to -0.10%. (UN 2017). In the same period, while the number of under 19 years-old will increase by 20 million, those over 60 will increase by 65 millions. (UN 2017). As a result Brazilian dependency ratio will change significantly. In 2050, despite the one hundred million people between 20 and 59 years old, elderly people will represent 30% of the total population, compared to only 5% in 1950. The economy as a whole will have to adapt to the demographic tendencies. The markets will respond to the changes in demands of the aging population. The public sector will face some strains in demand for services and transfers.
One importante component of public expenditures are the transfers of the public pension system. Pension system pressures due to demographic transitions are commonly reported in the academy and on the press. However, demographic transition also presents important challenges for educational and public health services, as well as other public transfer programs. Financing of those public expenditures may be hampered still by the effects of the demographic transition on the Gross Domestic Product growth rate, which is affected by labor market impacts and taxation capacity as shown in Barbosa Filho, Turra, Wajnman and Guimarães (2014)1.
Population aging directly influences pay-as-you-go pension systems’ sustainability through the rise of the dependency ratio. An increase in population over 64 years old will demand higher contributions by the labor Market participants. In 1950, for every 100 active workers, Brazil had 5.4 retirees. In 2015, this ratio doubled to 11.4 and by 2050, this ratio will triple by UN forecasts (UN 2017). As labor productivity will probably not increase by these proportions, imbalances will require reforms in order to maintain solvency.
During the period while active age fraction of population was increasing (the demographic dividends period), the opportunities derived from the demographic transition transformed into higher expenses with all generations, children, young people and the elderly. Compared to other richer and middle-income countries though, there was a relative neglect of children and youngs in Brazilian public investments on education, health and nutrition, while the share of the elderly in the population was still small. Brazil simultaneously expanded its expenditure on the young and elderly people, loosing the opportunity to foster human capital
accumulation, especially over the last 20 years when aging of the Brazilian population
accelerated. (Turra, Queiroz and Rios-Neto, 2011). Moreover, government expenditure on the elderly is increasing over time due to population aging. Rising coverage and expansion of the Brazilian pension system reduces public sector investment capability and increases fiscal risks. The Brazilian public policies bias favoring the elderly is well documented by demographists since the 90´s with the help of intergenerational accountability (see, Turra, 2000; Turra and Queiroz, 2006; Turra, Queiroz and Rios-Neto, 2011). Recently, Turra, Queiroz and Mason (2016) showed that per capita net transfers to people over 65 years old in Brazil amounted to seven times the value of the transfers to the group of the population
1 Demographic changes affect capital demand and supply, interest rates, long term care health supply, insurance and housing markets, just to mention some extra demographic transition effects.
younger than 15 years old in 1996. Since then, the value of net transfers to the elderly remained constant as a share of GDP, despite the increasing expenses on education and with transfer policies aimed at the younger population. As a result, the ratio of net transfers between the elderly and the young population reduced by a half, from 7 to 3.5, but is still high according to international standards.
The fierce fiscal crisis the Brazilian economy faces will require adjustments on public expenses to reduce the structural fiscal deficits that are at its roots. Population aging will make this task even harder. Population aging putst immediate pressure on the Brazilian pension system, that generates large and increasing deficits for many years already. Population aging will also increase demands for public provision of health services. At the same time, working age population will drop, bringing along limits to labor contributions to GDP, to potential output (Barbosa Filho, Turra, Wajnman and Guimarães (2014)) and therefore to taxation, tightening public budget constraints.
In the current scenario, it is mandatory to estimate the impacts of the demographic transition on public spending in order to allow planning of public budgets over time. This work forecasts the evolution of demandas for public expenditures until 2060 based on the foreseeable demographic transition of the Brazilian population. The paper presents the effects of population age distribution on public expenditures on the pension system (for general and public servants), public health and education and social transfers in real terms and as percentage of GDP by federal, state and local levels.
This paper is organized into nine sections beyond this introduction. Section 2 approaches the impacts of the demographic transition over the Brazilian GDP. Section 3 deals with the consequences of the population age distribution shifts over health spending, while the fourth section estimates its impacts on education expenses. Sections 3 and 4 breaks down health and education expenses by federal, state and local government levels. The fifth section presents forecasts for pension system expenses for the general system (RGPS) and the public servant system by government level. Section 6 develops forecasts of the impact of the demographic transition over public transfer programs. Section 7 provides health spending forecasts related to long term care programs. Section 8 summarizes the results, while section 9 concludes the paper.
2 – Demographic Transition and potential GDP Growth
This section estimates Brazilian potential GDP growth rates taking into account the demographic tendencies that will probably follow in the next decades, using the methodology described in Barbosa Filho et alli (2014). In the cited work the authors match economic and demographic dynamics in a single model to forecast GDP growth trajectory restricted to long term labor supply forecasts. Estimates show that the working age population group growth rate will drop below 1% per year after 2022 and will decrease over time.
This decline in working age population growth will limit the expansion of Brazil’s potential output to a rate below 2% until 2050. Important to notice that the negative effects of the decline in working age population on potential output will be attenuated, albeit not outweighted, by a rise in women’s labor market participation rates. Therefore, the demographic pressures will probably determinate the GDP growth dynamics. To put that tendency in
perpective, in order to maintain the current potential working age population growth rates, against the demographic pressures, Brazil would need an immigrant inflow of around 2 million people per year, a number that is a hundred times higher than the current actual rates of immigrant inflows.
2.1 –GDP Potential Forecast Methodology
Following Barbosa Filho et alli (2014), we estimate GDP growth rates based on the evolution of working age population (WAP) and labor force participation (LFP), under the hypothesis that the occupied population growth rate reflects the variation of LFP, i.e., unemployment is supposed constant. We present potential GDP growth estimates by two methods. The first method uses the aggregate production function employing capital and labor, while the second method assumes constant labor productivity.
The first method follows Barbosa Filho et alli (2014), based on a Cobb-Douglas production function and simplified assumptions to depreciation and total factor productivity. According to a Cobb-Douglas technology, the potential GDP growth
Y Y is given by (1): L L K K A A Y Y ) 1 (
(1) where A A is TFP growth, K Kis capital stock growth (that depends on investment rate,
considered to be equal to 16% ( 0,16 Y I )); L L
is labor employment growth and
is labor income participation rate, admitted equal to 40% (0,4), consistently to Brazilian data.The second method follows Dang, Antolín and Oxley (2001), adopting a methodology that decomposes potential GDP growth rate in two components: labor productivity growth and labor growth. Accordingly, potential GDP growth
Y Y follows equation (2): L L P P Y Y T T (2) where L L
represents labor growth rate and
T T P P
labor productivity growth rate.
Empirical evidence shows that labor productivity growth in Brazil was running around 1% per year between 1982 and 2016. Therefore, for the purposes of the simulations we adopt a labor productivity growth rate equal to 1% per year.
2.2 – Results
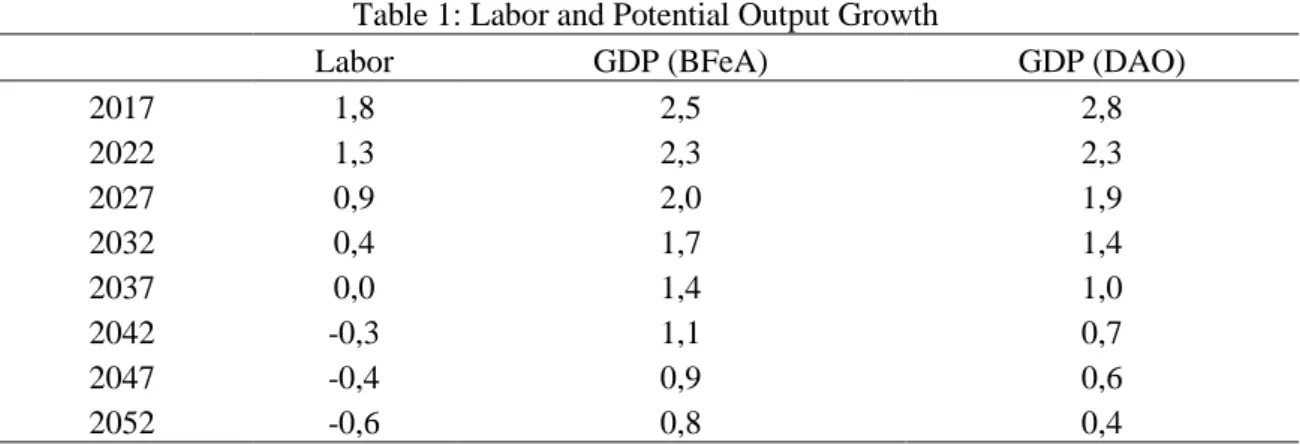
Table 1 presents Brazilian potential output growth estimates based on the two methodologies presented above. The demographic transition will reduce labor growth and this
will have an important impact on potential output growth. Both projections show a monotonic decrease on potential output over time until 2050.
Table 1: Labor and Potential Output Growth
Labor GDP (BFeA) GDP (DAO)
2017 1,8 2,5 2,8 2022 1,3 2,3 2,3 2027 0,9 2,0 1,9 2032 0,4 1,7 1,4 2037 0,0 1,4 1,0 2042 -0,3 1,1 0,7 2047 -0,4 0,9 0,6 2052 -0,6 0,8 0,4
Source: By the authors..
Table 1 shows that labor output growth will decline and become negative after 2037. The declining labor supply will reduce GDP growth in both scenarios
3 – Public Health Expenditure Forecast
For many societies, empirical evidence suggests a non-monotonic relation between health spending and age. Health expenditure is tipically higher among children (especially toddlers) and the elderly. However, the level and the ratios of spending along different ages vary across societies, depending on population health standards, mortality profile, health systems, technology availability, habits, culture and other national characteristics (Noronha and Turra, 2013). Estimates of the National Transfer Accounts project (http://www.ntaccounts.org/), comparing cross generation transfers along the life cycle for more than 40 countries, suggests that public health spending profile has a “j” shape on age. In that way, health expenditure age profile tipically shows more spending on health in the initial and final years of the life cycle thanfor the middle years, consistently with the pattern of Brazilian data (Reis, Noronha and Wajnman 2016). It´s worth mentioning that an increase in health spending at the end of adult life does not have to be monotonic, depending on the medical technology available (Berestein and Wajnman 2008). Also, a variety of studies show that health expenditure at each age depends on several observable and non observable variables that affect health expenditure in indirect ways, so that age can therefore be used as a proxy (Evans 1985; Zweifel et al. 1999; Werblow et al. 2007). Higher hospitalization costs and disease prevalence could be cited as examples, as well as a shortening in the time until death (Brockmann e Gampe 2005). Estimations suggest that age loses statistical importance in explaining health expenditure profile when replaced by a variable representing “time to death” in the analysis. (Raitano 2006). Using Medicare data, Miller (2001) shows that health expenditure on the year of death is seven times larger than ten years prior to death. As elderly people are closer to death than young adults, health costs are higher for the elderly. Moreover, increases in health spending by age are higher for richer countries, what suggests the possibility of age profile of expenditures shifts with GDP growth (Mason e Miller, 2017).
In this study, we will work with health expenditure projections based on Dang, Antolín and Oxley (2001), combining their estimated spending profile per age with the Brazilian population distribution. Therefore, in this paper we will consider only the demographic effect on the health spending profile. This approach will be improved in the next revisions of the study, by incorporating health spending profile impacts of other variables as pointed out above. 3.1 – Methodology
Total health spending projections depends on population size per cohort j in year t
)
(
Pop
j,t and per capita expenditure per cohort j(
s
j)
. Thus, total health expenditure (S
t) isestimated by equation (3):
J j j t j t Pop s S 1 , (3)Equation (3) represents the total health spending estimation under the hypothesis of a fixed per capita spending, per cohort
(
s
j)
, over time. In this way, health costs changes areentirely dependent on demographic shifts. Population aging increases total spending because per capita spending per cohort
(
s
j)
is higher for the elderly. In order to compute total health spending, we use the health spending profiles estimated by Turra, Queiroz and Mason (2016). The authors combined 2003 Brazilian household data (PNAD), with public health spending data on hospitalization (SUS) to compute age spending profiles for Brazil. We adjust per capita spending estimated by the authors in order to reflect the Brazilian 2014 spending profile. Health spending profile adopted here is presented in Figure 2 and shows the tipical “J” shape, as expected. Health spending profile first declines with age and reaches a minimum for the 10-14 years old cohort, an expenditure level that is three times lower than the cohort costs for one-year olds. Subsequent expenditures grow at a slow pace until the 35-39 cohort, to accelerate afterwards. At the 50-54 cohort, expenditures attain the same value of the first cohort of 0-4 year olds, growing faster over time until it dobles that value at the end of the life cycle.Source: By the authors using Turra, Queiroz and Mason (2016).
3.2 – Results
Table 2 shows that health spending is projected to increase substantially over time due to demographic changes in Brazil. Estimates show a 40% increase until 2050, keeping per capita expenditures per cohort fixed at current levels.
Table 2: Health Spending Evolution (2016 million Reais)
Total 2014 262.777 2015 256.123 2020 276.112 2025 295.517 2030 313.843 2035 330.977 2040 346.309 2045 358.996 2050 368.428 2055 374.257 2060 376.281 Variation 2014-2016 43,2
Source: By the authors. 500,00 1.000,00 1.500,00 2.000,00 2.500,00 3.000,00 3.500,00 0- 4 5- 9 10-1 4 15 -19 20-2 4 25-2 9 30-3 4 35-3 9 40-4 4 45-4 9 50-5 4 55-5 9 60-6 4 65-6 9 70-7 4 75-7 9 80 +
Table 3: Health expenditure (2016 million Reais)
Federal State Municipal Total
2014 112.136.226 70.254.021 80.386.812 262.777.059 2015 109.859.700 66.955.912 79.307.003 256.122.615 2020 118.433.818 72.181.557 85.496.602 276.111.977 2025 126.757.318 77.254.460 91.505.283 295.517.061 2030 134.617.756 82.045.141 97.179.682 313.842.578 2035 141.967.422 86.524.524 102.485.358 330.977.304 2040 148.543.531 90.532.448 107.232.608 346.308.587 2045 153.985.451 93.849.121 111.161.095 358.995.668 2050 158.031.343 96.314.961 114.081.798 368.428.102 2055 160.531.563 97.838.763 115.886.690 374.257.016 2060 161.399.880 98.367.974 116.513.523 376.281.376
Source: SIOPS and by the authors.
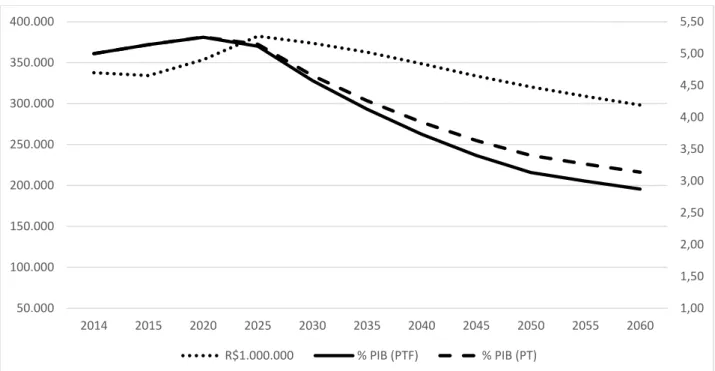
Figure 3 shows the estimates for the temporal evolution of health spending in million Reais and as percentage of GDP. Estimates show that health expenditure as share of GDP will peak in 2020 and later decline, due to higher potential GDP growth. It is interesting to notice that these projections are lower than the ones presented in Miller and Castanheira (2013). The cited authors consider health expenditures of 4.7% of GDP, so tha possible explanations for the divergence are differences in projected GDP, besides disconsideration of demographic changes.
Is it also important to notice that the age spending profile may change overtime as a function of GDP growth, as mentioned above. Dang, Antolín and Oxley (2001) show that OCDE health dynamics is already different from the Brazilian one. The present Brazilian simulation keeps age profile spending constant over time and does not include long term care (LTC) spending. In contrast, the projections for the OCDE include LTC and consider a 3.3% GDP growth rate.
Source: By the authors.
It is worth mentioning that the Brazilian Public Health spending is relatively low when compared to other countries, as shown in table 3. Brazil spends only 3.8% of GDP on Public Health and, even taking into account population aging, its health expenditure will remain low as compared to other OCDE countries. This result might reflect the use of more advanced (and expensive) technology adopted in OCDE countries of higher income or the different allocation of resources between the public and private health systems.
Table 4: Public Health Spending for different Countries (% GDP) Brasil 3,8 Australia 6,2 Chile 4,7 France 8,6 Germany 9,4 Italy 6,8 Japan 9,5 Mexico 3,0 Spain 6,3 USA 8,4 Source: OCDE.
4 – Public Education Projection Spending
In order to project education spending over time, we will separate three different components: public spending per student per educational level, demographic projections and
1,00 1,50 2,00 2,50 3,00 3,50 4,00 4,50 5,00 150.000 200.000 250.000 300.000 350.000 400.000 2014 2015 2020 2025 2030 2035 2040 2045 2050 2055 2060 R$1.000.000 % PIB (PTF) % PIB (PT)
enrollment rates. Additionally, we will use the Educational National Plan (Plano Nacional de Educação (PNE)) in order to forecast future enrollment rates.
4.1 – Spending per Student
INEP publishes periodically direct public spending per student as shown in Table 5. Table 5 presents direct public spending per student in real terms from 2006 to 2014 and shows that spending on basic and high school education more than doubled over the period. However, those numbers represents only a fraction of the expenditure per student in superior education.
Table 5: Direct Spending per Student (R$)
Early Chldhood Elementary High School Superior
2006 2.391 2.985 2.123 18.023 2007 2.899 3.452 2.576 19.044 2008 3.097 3.999 2.980 17.602 2009 3.101 4.466 3.142 19.769 2010 3.808 5.005 3.958 21.013 2011 4.507 5.181 4.906 22.389 2012 5.313 5.466 5.582 20.335 2013 5.783 5.842 5.902 22.753 2014 5.878 5.918 6.021 21.875 Source: INPE/MEC.
4. 2 –Enrollment Rates and Excluded Students
In order to project education spending we need to know the proportion of individuals per cohort that are enrolled in each school cycle as well as the government enrollment targets set out in the PNE. A possible estimate is the gross enrollment rate for each level, that correspond to the number of students enrolled in that educational level divided by the total population that should be enrolled in that specific level given their age. However, the number of students enrolled in a particular educational level includes late students of older ages too. An alternative estimate is the net enrollment rate for each level, that is the number of students in the correct (expected) educational level given their age. Therefore, the net enrollment rate indicates the fraction of the students that are enrolled in the correct grade level, which is a better fit to proxy the enrollment demand by each level.
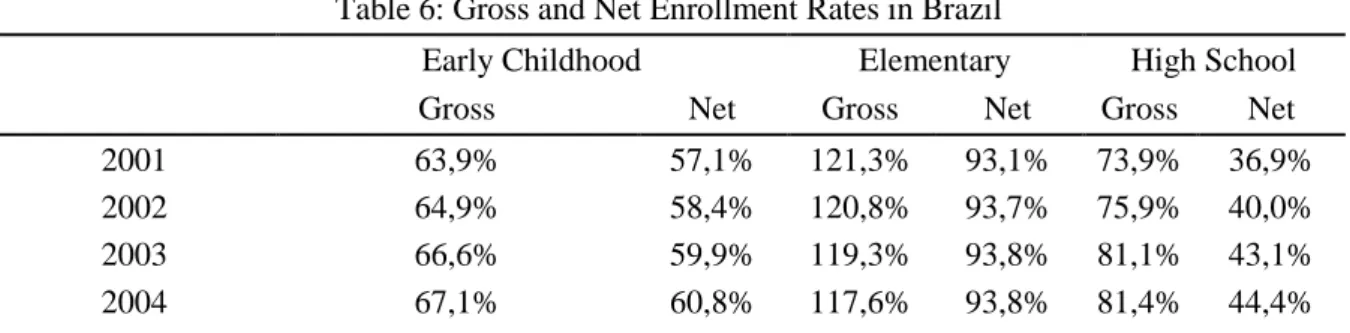
In order to have a broader perspective for the educational demands we computed gross and net enrollment rate. Table 6 shows that the elementary level is the only one actually universalized in Brazil, with a net enrollment rate of 93%, early childhood and high school have a net enrollment rate of only 56% and 57%.
Table 6: Gross and Net Enrollment Rates in Brazil
Early Childhood Elementary High School
Gross Net Gross Net Gross Net
2001 63,9% 57,1% 121,3% 93,1% 73,9% 36,9%
2002 64,9% 58,4% 120,8% 93,7% 75,9% 40,0%
2003 66,6% 59,9% 119,3% 93,8% 81,1% 43,1%
2005 68,6% 62,9% 117,1% 94,4% 80,7% 45,3% 2006 70,2% 64,8% 116,2% 94,8% 82,2% 47,1% 2007 49,3% 47,2% 116,0% 94,6% 82,6% 48,0% 2008 73,4% 59,6% 104,5% 90,1% 85,5% 50,4% 2009 62,2% 50,6% 105,7% 91,1% 83,0% 50,9% 2011 69,7% 54,2% 106,9% 91,9% 82,2% 51,6% 2012 62,8% 46,2% 105,5% 92,5% 83,2% 54,0% 2013 63,4% 46,2% 105,7% 92,5% 83,5% 55,1% 2014 62,4% 46,6% 105,2% 93,0% 84,5% 56,4% 2015 72,0% 55,9% 105,8% 93,3% 83,3% 56,9%
Source: By the authors using INEP and PNAD.
The difference between gross and net enrollment rates represents the high number of late students in Brazil. This means that we cannot project the number of students demanding each educational level directly from enrollment rates applied on the cohort numbers. However, the similar costs per student for the different educational levels allows to estimate education expenditure without much loss of precision due to the presence of “late” students.
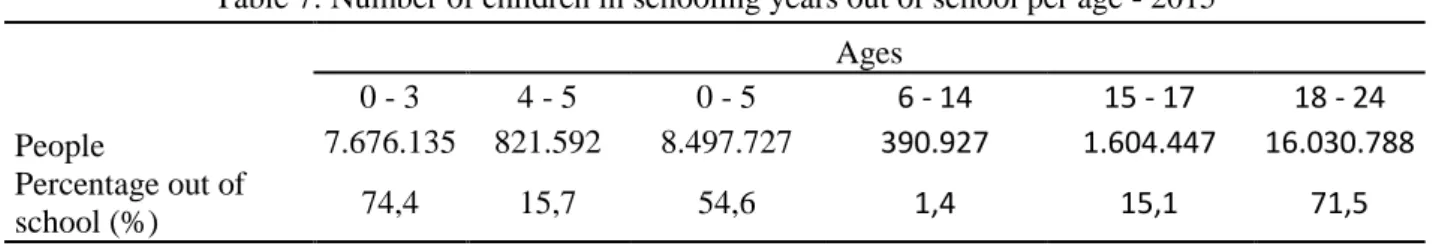
However, we need to incorporate future increases in the number of students demanding each cycle, because there are many students who are currently outside of the educational system. Table 10 shows the number of children that should be enrolled in school given their respective ages, but are not. The data shows that the biggest demand challenge will be to incorporate the 7.7 million children between the ages of 0 and 3 that are currently out of school.
Table 7: Number of children in schooling years out of school per age - 2015
Ages
0 - 3 4 - 5 0 - 5 6 - 14 15 - 17 18 - 24
People 7.676.135 821.592 8.497.727 390.927 1.604.447 16.030.788 Percentage out of
school (%) 74,4 15,7 54,6 1,4 15,1 71,5
Source: By the authors using PNAD.
Despite not discriminated in the table, only 42% of the children between 2 and 3 years old are enrolled in school. This indicates that the enrollment rate for children with ages below 2 years is even lower than the number for the age group 0 - 3. Children with ages between 4 and 5 have a high enrollment rate, and only 16% are out of school, representing 820 thousand children. For children between the ages of 6 and 14, only 390 thousand are out of school. However, we have an enormous challenge, incorporating 1.6 million teenagers between 15 and 17 years old, and in order to increase terciary enrollment.
4.3 - Methodology
The number of students projected for each educational cycle i in year t
(
A
i,t)
is obtained by multiplying the net enrollment rate in 2015 (table 6) by the cohort population growth factor,represented by the ratio 1 , , t i t i D D
(where
D
i,t is population of cohort i in date t). Therefore, with nofurther correction, the projection for the number of students demanding each cycle is given by:1 , , 1 , , t i t i t i t i D D A A (4)
However, given a foreseeable increase in enrollment rates, we also consider the enrollment targets of the PNE Plan, represented in the equation by the target number of students for each education cycle i in the period t
(
M
i,t)
. In this case, equation (4) becomes:1 , , 1 , , 1 , , t i t i t i t i t i t i M M D D A A (5)
The PNE (Plano Nacional de Educação) envisions universalization of education for every child between ages 4 and 14. It also plans to increase enrollment rates to 85% for teenagers between the ages of 15 and 17. We assume that the PNE Plan refers to public education. Therefore, we chose a targe of 10% in the tertiary cycle in the public education for people between the ages of 18 and 24. Therefore, we obtain total spending in education by multiplying the number of students demandind each cycle as derived above, by the respective cost per student in each cycle, as follows:
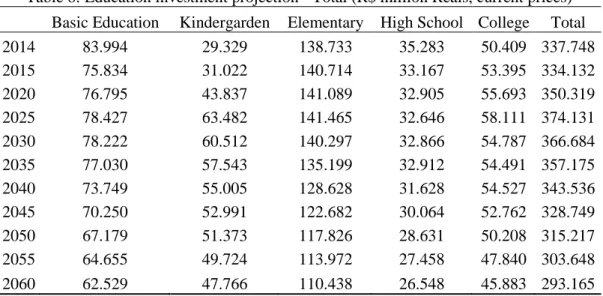
I i i t i t A C E 1 , (6) 4.4 - ResultsTable 8 shows the evolution of education costs in real terms until 2060. Total education spending will decrease in the next decades due to demographics dynamics, which will bring a sharp reduction to the share of the population that is of schooling age. However, the education spending trends differs among educational levels.
Table 8: Education investment projection - Total (R$ million Reais, current prices) Basic Education Kindergarden Elementary High School College Total
2014 83.994 29.329 138.733 35.283 50.409 337.748 2015 75.834 31.022 140.714 33.167 53.395 334.132 2020 76.795 43.837 141.089 32.905 55.693 350.319 2025 78.427 63.482 141.465 32.646 58.111 374.131 2030 78.222 60.512 140.297 32.866 54.787 366.684 2035 77.030 57.543 135.199 32.912 54.491 357.175 2040 73.749 55.005 128.628 31.628 54.527 343.536 2045 70.250 52.991 122.682 30.064 52.762 328.749 2050 67.179 51.373 117.826 28.631 50.208 315.217 2055 64.655 49.724 113.972 27.458 47.840 303.648 2060 62.529 47.766 110.438 26.548 45.883 293.165
Source: FINBRA - SICONFI and by the authors.
Tables 9, 10 and 11 breaks down the numbers for public education expenditures evolution into the different government levels: federal, states and municipalities.
Table 9 shows the reduction in education spending driven by demographic changes will be very important for the federal government. The total reduction will be higher in the elementary level due to the existing universalization. Basic education will be reduced by only 17% because we stiil have to increase coverage. Therefore part of the young age population reduction will be compensated by enrollment increase.
Table 9: Education investment projection - Federal (R$ million Reais, current prices) Basic Education Kindergarden Elementary High School College Total
2014 23.863 186 360 15.171 37.135 76.716 2015 22.149 65 181 13.617 39.167 75.179 2020 23.403 92 180 13.509 40.852 78.036 2025 25.325 133 178 13.403 42.626 81.665 2030 24.948 127 180 13.493 40.188 78.936 2035 24.149 121 180 13.512 39.971 77.932 2040 23.047 116 173 12.985 39.997 76.317 2045 22.018 111 164 12.343 38.702 73.339 2050 21.158 108 156 11.755 36.829 70.006 2055 20.434 105 150 11.273 35.092 67.053 2060 19.751 100 145 10.899 33.656 64.552
Source: RREO -Tesouro Nacional (National Treasury) and by the authors.
Table 10 shows state level spendingon education. State spending will be reduced by 22% over the period analysed. High Shool and basic education covered is already high in state institutions, allowing a deep reduction due to demographic conditions. However, state kinder garden obligations will increase the total spendin by 65% in this group.
Table 10: Education investment projection - State level and FD (R$ million Reais, current prices) Basic Education Kindergarden Elementary High School College Total
2014 46.655 837 27.001 19.159 11.908 105.560 2015 41.280 899 27.660 18.455 12.910 101.204 2020 40.953 1.271 27.734 18.309 13.465 101.733 2025 40.630 1.840 27.809 18.165 14.050 102.494 2030 40.905 1.754 27.578 18.287 13.247 101.771 2035 40.962 1.668 26.575 18.313 13.175 100.693 2040 39.363 1.595 25.283 17.598 13.184 97.023 2045 37.417 1.536 24.114 16.728 12.757 92.552 2050 35.634 1.489 23.160 15.931 12.139 88.354 2055 34.174 1.441 22.403 15.278 11.567 84.863
2060 33.042 1.385 21.708 14.772 11.094 82.001
Source: FINBRA - SICONFI and by the authors.
Finally, table 11 shows municipalities spending. Municipalitis will have the smaller spending reduction in education acroos government levels. This is the result of the sharp and mandatory increase in kindergarden coverage that is still very small. This will cause a sharp increase in kindergarden spending by 65%. As it is an important part of municipalities educational mandatory spending, it pressures total educational spending by cities. Therefore, total spending will be reduced by only 5.7%.
Table 11: Education investment projection - Municipal level (R$ million Reais, current prices)
Basic Education Kindergarden Elementary High School College Total
2014 13.476 28.306 111.372 953 1.366 155.472 2015 12.405 30.057 112.873 1.096 1.318 157.750 2020 12.439 42.474 113.175 1.087 1.375 170.550 2025 12.472 61.508 113.478 1.078 1.435 189.972 2030 12.369 58.630 112.539 1.086 1.353 185.976 2035 11.919 55.754 108.445 1.087 1.345 178.550 2040 11.339 53.295 103.172 1.045 1.346 170.197 2045 10.815 51.343 98.404 993 1.303 162.858 2050 10.387 49.776 94.509 946 1.240 156.858 2055 10.047 48.178 91.419 907 1.181 151.732 2060 9.736 46.281 88.585 877 1.133 146.612
Source: FINBRA - SICONFI and by the authors.
Figure 4 shows that expenditures on education as shares of GDP will drop after 2020. Total spending on education as shares of GDP will drop even faster due to the contribution of GDP growth.Therefore, public education expenditures will probably not be an important factor of restrictions over the government budgets in the future.
Source: By the authors.
The projected reduction in total education expenditure for Brazil here is deeper than the tendencies provided by Dang, Antolín and Oxley (2001) for OCDE members. They project an education spending reduction of 1.3% for OCDE members. The reduction projected in our forecast is 255% of current education spending. Those differences are certainly the result of the much faster demographic transition path of the Brazilian economy, that will face a very fast transformation to a maturer population distribution over a few number of years.
Last but not least, it is important to notice that Brazil’s total expenditure on education as share of GDP is not very different from the OCDE average. Demographics trends tends to reduce education spending over the next decades, what will allow a shift in resources towards public services provided to elderly people.
Table 13: Education Public Spending (% PIB)
Brasil 5,0 Australia 4,7 Chile 3,7 France 4,8 Germany 4,2 Italy 3,7 Japan 3,5 Mexico 4,5 Spain 3,7 USA 4,8 OCDE AVERAGE 4,8 EU22 AVERAGE 4,7
Source: Education at Glance, OCDE.
1,00 1,50 2,00 2,50 3,00 3,50 4,00 4,50 5,00 5,50 50.000 100.000 150.000 200.000 250.000 300.000 350.000 400.000 2014 2015 2020 2025 2030 2035 2040 2045 2050 2055 2060 R$1.000.000 % PIB (PTF) % PIB (PT)
5 – Social Security Projections
The high share of total social security spending on the federal government budget and the Brazilian rapid demographic transtion motivated several studies on the effects of aging on social security spending. There are several papers on the topic, as for example Cechin and Cechin (2007), Caetano (2008, 2013 e 2014), Costanzi (2017), Giambiagi and Cechin (2011) and Tafner (2013, 2017). Social security projections developed in this paper are based mainly on demographic factors that determine age evolution and accounts only partially for other factors. This simplication does not impose a great loss of realism on the long run. We will separately project expenditures related to the general Social Securtity System (RGPS) and the Public Server Social Security System (RPPS). The methodology is similar for both and based exclusivelly on demographic projections, retirees age profiles and the distribution of pensions by age.
Accordingly, we assume for simplicity that the share of retirees per cohort
(
ap
j)
is fixed over time, projecting the number of beneficiaries in year t(
Ben
t)
by multiplying this share, obtained with 2015 PNAD data, to the number of individuals of cohort j in year t(
Pop
j,t)
: .
J j j t j t Pop ap Ben 1 , (7)Assuming that the average value of social benefits remains constant in time, the total social security expenditure in each period
(
GP
t)
is projected proportionally to the number of beneficiaries in each period, as given by:k t k t t Ben Ben GP GP (8)
General System of Social Security (RGPS)
Table 14 shows the results of projections for the expenditures on the Social Security General System transfers. Acording to them, there will be an increase in expenditures by 160% between 2014 and 2050. These results reflect the smaller rate of population growth in the future, even for the shares of women under 60 and men under 65 in the population who are entitled to the social security benefits.We also worked on a counterfactual exercise using the evolution of the population with ages 65 and above only.
The comparison reveals a smaller increase of expenditures when early retirees are taken into account (younger than 65) based on the share of retirees in each cohort. This happens because some of the population that will be older than 65 are already retired. This means that this rise in the share of elderly people may be already including those who are currently retired.
Table 14: General Social Security System Projection (in 2016 million Reais)
Share of retirees in total Population and demographic dynamics
Demographics Only
2014 460.794 460.794
2020 570.843 579.523 2025 677.220 713.231 2030 788.150 874.340 2035 897.134 1.026.770 2040 1.005.242 1.164.852 2045 1.110.686 1.312.133 2050 1.203.784 1.481.741 Variaton 2014-2050 161,2 221,6
Source: By the authors.
The projection for RGPS expenditures as share of the GDP, shown in Figure 5, shows an increase from 9% to 14% until 2050. Those are large numbers that reveals the pressure that population aging will impose on the government’s federal buget in the future.
Figure 5: Expenditure Projections for the RGPS
Source: By the authors.
Public Server Social Security System (RPPS)
The Public Server Social Security System expenditures projections are based on the same methodology used in the general system. The rise in the number of beneficiaries will increase the spending on the RPPS significantly both in real terms and as a share of the GDP. Population aging brings up increasing numbers of social security beneficiaries over time. Figure 6 shows that RPPS expenditures will increase more than 200% due to population aging. 0,0000 5,0000 10,0000 15,0000 20,0000 25,0000 500.000 1.000.000 1.500.000 2.000.000 2.500.000 2014 2015 2020 2025 2030 2035 2040 2045 2050 2055 2060 R$ 1.000.000 % PIB (PTF) % PIB (PT)
The total current expenditure of R$563 billion will expand to R$1.4 trillion reais until 2050. RPPS spending should increase from 3.6% of GDP to 7.2% of GDP. It is important to notice that in our estimates, we do not take into account the recent changes in the RPPS program, which will be incorporated in a future version of this work.
Table 15: Total Expenditure with RPPS (in 2016 million Reais)
Federal State Municipal Total
2014 96.106 133.538 40.209 269.853 2015 104.231 142.442 41.764 288.437 2020 139.035 191.483 50.797 381.315 2025 169.337 233.217 61.868 464.422 2030 203.401 280.130 74.313 557.844 2035 237.553 327.166 86.791 651.511 2040 269.661 371.387 98.522 739.571 2045 304.946 419.982 111.413 836.341 2050 340.234 468.582 124.306 933.122 2055 368.631 507.692 134.681 1.011.004 2060 388.659 535.275 141.998 1.065.933
Source: by the authors.
Figure 6: Public Server Social Security (RPPS) Projection
Source: By the authors.
The RPPS estimates presented above predict a 3.6% spending increase until 2050. Dang, Antolín and Oxley (2001) projections of social security spending for the OECD ranges
2,00 4,00 6,00 8,00 10,00 12,00 0 200.000 400.000 600.000 800.000 1.000.000 1.200.000 2014 2015 2020 2025 2030 2035 2040 2045 2050 2055 2060 R$ 1.000.000 % PIB (PTF) % PIB (PT)
from 3% to 4% from 2000 to 2050. Therefore, the present projections for Brasil predict a total social security expenditure increase (General and public social security) that amounts to twice the OCDE rates. Total social security expenditures would reach 23% of GDP in Brazil considering only demographic changes, a number that puts in perspective the urgent needs for reforms.
5 – Public Income Transfers Projections
This section measures the impact of demographic dynamics on two important public income transfers programs: Bolsa Família (BF) and Benefício de Prestação Continuada, also known as Lei Orgânica de Assistência Social (BPC-LOAS). The BF is an income transfer program that focuses on the poorest share of the population, and transfers resources to families with children and teenagers, conditional on obligatory school enrollment and basic health care. The BPC is an unconditional transfer program that guarantees basic income to Brazilians older than 65 that have no assets, receive a per capita income below ¼ of the minimum wage, and for people that are unable to work for reasons concerning health. The demographic changes will affect both programs in different ways, because they focus on different cohort groups.
As for the previous items of public expenditures, the projections developed here for these transfer programs take into account exclusively demographic changes, particularly concerning the trends for the population between 0 and 17 years old (for BF program) and for the population above 65 years old (for BPC program). For each transfer program
BF BPC LOAS
j , , total spending in year t
(
Tr
j,t)
is projected adjusting for the proportional growth of the respective population cohort that is targeted by the program(
Pop
j,t)
: ; 1 . . , , t j t j k t j t j Pop Pop Tr Tr (9) Bolsa FamíliaThe demographic transition reduces the number and the share of young people in the total population. Thus, we should observe a pronounced drop in the Bolsa Família spending program. Table 16 indicates the Bolsa Família transfer program expenditures will have its share of GDP reduced from 0.5% in 2015 to 0.25% in 2060.
Table 16: Bolsa Família Spending Program
R$ 1.000.000 % PIB (PTF) % PIB (PT) 2014 31.780 0,47 0,47 2015 32.321 0,50 0,50 2020 31.050 0,46 0,46 2025 30.425 0,41 0,41 2030 29.855 0,37 0,37 2035 28.844 0,33 0,34 2040 27.538 0,29 0,31 2045 26.340 0,27 0,29
2050 25.337 0,25 0,27
2055 24.472 0,24 0,26
2060 23.633 0,23 0,25
2014-2060 Variation -25,6
Source: by the authors
Benefício de Prestação Continuada (BPC-LOAS)
The spending on the BPC-LOAS program will follow a different path than that predicted for the Bolsa Família Program. BPC-LOAS is focused on the elderly population, which constitutes the larger beneficiary group. Therefore, the increase in the share of the elderly population should drive the BPC costs up. From 2014 to 2050 the share of the population with ages above 65 will triple and the total spending will presumably follow a similar path. Figure 7 shows that BPC spending will probably more than double in GDP terms, reaching 1.7% of GDP in 2050, which represents an increase to twice the current participation of 0.8% of GDP.
Figure 7: BPC Spending Projection
Source: By the authors.
6 – Long Term Care Projection
Population aging will increase the demand for health and social services related to special needs for the elderly population. In addition to that, the demand for health services provided to treat chronic diseases and for health treatments for those who are in the final years of life will also increase. These trends will drive up demand for qualified personnel to help in day-to-day activities for those who require personal support. Currently, Brazilian government spending with policies designed to provide special assistance for the population in need of long-term care (LTC) is close to nothing, relegating its provision mostly to family members.
0,00 0,50 1,00 1,50 2,00 2,50 0 20.000 40.000 60.000 80.000 100.000 120.000 140.000 160.000 180.000 200.000 2014 2015 2020 2025 2030 2035 2040 2045 2050 2055 2060 R$ 1.000.000 % PIB (PTF) % PIB (PT)
This kind of attention will grow more expensive over time as demographic transition reduces the the number of siblings per family. In this section we provide a preliminary estimate of the costs to comply with the demand for such services, which will require the development of a proper structure and institutions especially dedicated to its provision.
According to the existing literature on this subject, (see, for example, Maisonneuve and Martins 2014), Long Term Care is different from health services in general due to its very nature. Health care services are services that improve life quality, while the long term care services’ objective is to provide a comfortable environment for those who lost their autonomy due to a health condition. Long term care includes nursing care, social services and services related to the improvement of the patient’s domestic and social tasks.
The conditions that, in general, determine LTC eligibility are chronic diseases, which are health conditions that affect the patient mobility and autonomy.These conditions do not allow the patient to perform “normal” day-to-day activities. Day to day activities impaired may vary among common life activities, such as eating, dressing up, or taking a bath, to instrumental daily activities, such as cooking or cleaning the house. The former group of activities relate to health services while the latter to social services.
Therefore, the need for the LTC is determined by the occurrences of health conditions, which leaves the patient completely dependent on personal care, such as accidents or diseases. In general, we see a higher probability of life dependency among the elderly population (Rocha 2015), and this outlines the important effect that aging has on family costs. The costs of LTC programs depends on factors associated to the level of dependency of the patient attended, technology and inputs avaiable, as well as the average income of the country.
6.1 – Methodology
The present estimation is based on estimates for the services costs by age and the demographic dynamics to project expenditures over time. We assume that the service costs will remain constant over time. We do not consider the impact of other factor such as income and keep LTC age profile costs constant in our projections, in spite of estimations that show that other variables will impact the cohort profile costs (see, for example, Rocha 2000; Nepomuceno and Turra 2015). We use the Health supplement of the 2008 household survey (PNAD) data to measure the degree of dependence of the population. Specifically, we employ the answers to the question: “Do you face any problem, regarding health conditions, in order to eat, take a shower or go to the bathroom?” (“Normalmente, por problema de saúde, tem dificuldade para alimentar-se, tomar banho ou ir ao banheiro?”). We count the people that answer “can´t do” (“não conseguem”) or “have great difficulty” (“tem grande dificuldade”) as the people that supposedly are in need of special care. Figure 8, presents the population distribution of people that need special care in order to perform the activities mentioned in the question. It illustrates the fact that there is a sharp increase in the population share in need of some kind of special help in order to perform day-to-day activities for those with ages 65 and above. For those who are 40 years old or younger, the share of the population in need of special help is smaller than 2%, while it reaches 30% for the population older than 90. Therefore, it is clear that population aging will increase the demand for LTC.
Source: PNAD 2008.
The second component for the projection is the LTC costs per age. In this case, age is also an important variable to determine not only the demand for LTC but also the costs associated with LTC. As we do not have these cost estimates for Brazil, we resort to estimates for other coutries. Figure 9 exhibits the anual average costs of LTC per age for the individuals that need special care, as a function of per capita GDP, for the countries of the European Union.
Figure 9: LTC costs per patient and cohort (% per capita GDP)
Source: OCDE. 0,00 5,00 10,00 15,00 20,00 25,00 30,00 35,00 10 -14 15 -19 20 -24 25 -29 30 -34 35 -39 40 -44 45 -49 50 -54 55 -59 60 -64 65 -69 70 -74 75 -79 80-84 85-89 90+ 0,0% 20,0% 40,0% 60,0% 80,0% 100,0% 120,0% 140,0% 0 - 4 5 - 9 10 - 14 15 - 19 20 - 24 25 - 29 30 - 34 35 - 39 40 - 44 45 - 49 50 - 54 55 - 59 60 - 64 65 - 69 70 - 74 75 - 79 80-84 85-89 90+
The average LTC cost per patient younger than 20 years old in the EU is around 80% of GDP per capita. This number increases gradually until the 50-54 years old cohort, reaching 120% of per capita GDP. Population above 55 years old face a per patient LTC cost reduction until it reaches 60% of per capita GDP.This pattern of costs per capita is associated with the type of special care each cohort group tipically needs. The LTC costs for young adults are related to accidents and diseases thata have expensive treatments, while for the elderly, the need for special attention is related to “natural” aging restrictions, that have cheaper treatments.
Table 17 shows the same data presented in Figure 9 (patient spending as share of per capita GDP and cohort), as well as LTC costs measured in 2017 Reais, based on 2017 GDP per capita and IBGE projected population. Based on the value of R$32.324 for Brazilian GDP per capita, LTC costs would range from R$24.667 for the 0 to 4 years old cohort to R$38.858 for the 50 to 54 years old cohort if it would reproduce the relative values of EU age profile of costs. Elderly cohorts have lower LTC costs, which are closer to R$20.000.
Table 17: LTC costs in Per capita GDP share and Reais
% per capita GDP 2017 Reais
0 - 4 76,5% 24.667 5 - 9 79,9% 25.766 10 - 14 82,4% 26.564 15 - 19 81,3% 26.204 20 - 24 89,9% 28.989 25 - 29 96,5% 31.110 30 - 34 97,1% 31.314 35 - 39 103,4% 33.330 40 - 44 103,9% 33.484 45 - 49 111,9% 36.085 50 - 54 120,6% 38.858 55 - 59 114,4% 36.875 60 - 64 94,7% 30.536 65 - 69 81,3% 26.210 70 - 74 74,8% 24.118 75 - 79 70,7% 22.782 80-84 66,4% 21.411 85-89 63,1% 20.340 90+ 69,5% 22.404
Source: OCDE e IBGE
Using the notation i for the fractions of the population in need of special care per cohort, cldi for the LTC average cohort cost, and POPi,t for the projected population number
for each cohort, we compute the total LTC costs for year t by :
I i i i t i t POP cld CLD 1 , (10)It is is important to notice that, as before, we rely exclusively on the demographic dynamics to project LTC costs, not taking into account other factors that could affect average cohort LTC costs.
6.2 – Results
The methodology described above allows us to compute LTC costs in 2017 Reais or in per capita GDP costs per cohort. Table 18 shows the simulation using 2017 Reais, and the second column of Table 17 presents the measures of 𝜑𝑖 in equation (10). Table 20 shows the
same results using LTC costs per cohort in per capita GDP terms, replacing the first column for the variable 𝜑𝑖 in equation (10).
Table 18 shows that total LTC spending in 2014 would be of R$87 billions based on the 2014 cohort profile. The population age profile changes until 2060 raises LTC total costs to R$180 billion. Table 18 shows the LTC costs per cohort and year from 2014 to 2060.
Table 18: LTC Spending Projection (in Billion Reais)
2014 2015 2020 2025 2030 2035 2040 2045 2050 2055 2060 10 - 14 0,6 0,5 0,5 0,5 0,5 0,5 0,5 0,4 0,4 0,4 0,4 15 - 19 2,9 2,9 2,6 2,5 2,4 2,5 2,4 2,3 2,2 2,1 2,0 20 - 24 3,4 3,4 3,4 3,1 2,9 2,9 2,9 2,8 2,7 2,6 2,4 25 - 29 3,6 3,6 3,6 3,6 3,3 3,1 3,0 3,0 3,0 2,8 2,7 30 - 34 4,5 4,6 4,6 4,5 4,5 4,1 3,9 3,8 3,9 3,8 3,6 35 - 39 5,3 5,4 5,8 5,9 5,7 5,8 5,3 4,9 4,9 4,9 4,8 40 - 44 5,7 5,8 6,5 7,0 7,0 6,9 7,0 6,4 6,0 5,9 5,9 45 - 49 8,1 8,1 8,6 9,7 10,5 10,5 10,3 10,4 9,5 8,9 8,8 50 - 54 8,2 8,4 9,0 9,6 10,8 11,7 11,7 11,5 11,6 10,6 10,0 55 - 59 8,4 8,6 9,8 10,7 11,3 12,8 13,8 13,9 13,7 13,8 12,7 60 - 64 6,7 6,9 8,2 9,4 10,2 10,8 12,2 13,3 13,4 13,2 13,3 65 - 69 6,6 6,9 8,3 9,9 11,4 12,4 13,2 15,0 16,3 16,4 16,2 70 - 74 5,7 5,9 7,4 9,0 10,8 12,4 13,6 14,5 16,5 17,9 18,1 75 - 79 6,4 6,6 7,6 9,7 11,9 14,4 16,7 18,3 19,6 22,3 24,3 80+ 14,9 15,5 19,2 23,4 29,6 37,4 46,7 56,5 65,4 73,1 82,3 Total 90,9 93,2 105,2 118,3 132,8 148,1 163,2 177,2 189,0 198,8 207,6 Source: by the authors using IBGE and OCDE data.
Table 18 shows that LTC spending should reach R$207 billions in 2060 in order to supply the predicted demand. This would be an important demand for new public resources, given that Brazil spends almost zero today. The projections show that the LTC expenditure as share of GDP would grow to 3.1% of GDP in 2060, as shown in Table 19.
Table 19: LTC Spending as Share of GDP
2014 2015 2020 2025 2030 2035 2040 2045 2050 2055 2060 1,3 1,4 1,6 1,6 1,6 1,7 1,7 1,8 1,8 1,9 1,9
Source: By the authors
We may also project LTC expenditure based on the assumption that costs per cohort member can be evaluated by the same fixed proportions of GDP per capita observed in EU data. This measurement raises LTC per cohort as GDP grows, increasing total LTC costs. Table 20 shows that this projection increases the amount required provide LTC from 1.4% of GDP in 2014 to 3.2% of GDP in 2060, a larger rate of expansion than the one seen in Table 19 (3.1% in 2060). These projections are in fact larger than the ones presented in Rocha and Turra (2016) who evaluate the monthly expenditure to provide LTC per person at 1.5 minimum wage. Their methodology estimates total expenditures with LTC at 1.3% of GDP in 2033. The projections presented in Table 20 are in line with OCDE LTC projections for the EU.
Table 20: LTC Spending Projections Based on per capita GDP cohort costs (% GDP)
2014 2015 2020 2025 2030 2035 2040 2045 2050 2055 2060 10 - 14 0,0 0,0 0,0 0,0 0,0 0,0 0,0 0,0 0,0 0,0 0,0 15 - 19 0,0 0,0 0,0 0,0 0,0 0,0 0,0 0,0 0,0 0,0 0,0 20 - 24 0,1 0,1 0,1 0,0 0,0 0,0 0,0 0,0 0,0 0,0 0,0 25 - 29 0,1 0,1 0,1 0,1 0,0 0,0 0,0 0,0 0,0 0,0 0,0 30 - 34 0,1 0,1 0,1 0,1 0,1 0,1 0,1 0,1 0,1 0,1 0,1 35 - 39 0,1 0,1 0,1 0,1 0,1 0,1 0,1 0,1 0,1 0,1 0,1 40 - 44 0,1 0,1 0,1 0,1 0,1 0,1 0,1 0,1 0,1 0,1 0,1 45 - 49 0,1 0,1 0,1 0,1 0,2 0,2 0,2 0,2 0,1 0,1 0,1 50 - 54 0,1 0,1 0,1 0,1 0,2 0,2 0,2 0,2 0,2 0,2 0,2 55 - 59 0,1 0,1 0,1 0,2 0,2 0,2 0,2 0,2 0,2 0,2 0,2 60 - 64 0,1 0,1 0,1 0,1 0,2 0,2 0,2 0,2 0,2 0,2 0,2 65 - 69 0,1 0,1 0,1 0,2 0,2 0,2 0,2 0,2 0,2 0,2 0,2 70 - 74 0,1 0,1 0,1 0,1 0,2 0,2 0,2 0,2 0,3 0,3 0,3 75 - 79 0,1 0,1 0,1 0,1 0,2 0,2 0,3 0,3 0,3 0,4 0,4 80+ 0,2 0,2 0,3 0,4 0,5 0,6 0,7 0,9 1,0 1,3 1,3 Total 1,4 1,4 1,6 1,8 2,0 2,3 2,5 2,7 2,9 3,2 3,2
Source: by the authors.
Brazil does not have a formal LTC program yet. However, the BPC transfer program serves as a family support for the LTC expenditures, albeit not specifically designed for that end.
7 – Projection Summary
This section presents a summary of the results of projections of demographic transition’s impact on government expenditures to attend demands especially related to the age distribution of the populatio. We estimated the demographic impact on education, health, social security, social transfer programs and long term care needs. On the one hand, the projectons show that education and the larger social transfer program, Bolsa Família, will probably be a decreasing burden for the government budget over time if the real value of per capita transfers
do not increase. The tendency reflects the smaller participation of young people in the population.
On the other hand, social security (general and public servant systems) expenditures, BPC transfers and LTC expenditures will most probably increase over time. RGPS spending will rise from 8.3% of GDP in 2014 to 18.8% in 2060, a 10-percentage points increase. The RPPS spending will double its value in GDP terms increasing to 10.3% in 2060 from 4.0% in 2014. In the same period, the BPC-LOAS will increase from 0.8% to 1.8% of GDP. The introduction of Long Term Care (LTC) provision in Brazil would add new expenditure demands in a range between 2.0% (LTC measured in real terms) to 3.2% (LTC measured in per capita GDP terms) of GDP in 2060. Total health spending should increase until 2030 and will decrease gradually until 2060, reaching 3.6% of GDP. It is important to notice that the present health costs projections run below other health costs projections developed for other countries that also consider a long run tendency for service cost increases. We acknowledge that technological progress may in fact impose higher costs of service per patient at least for new treatments with better prospects.
Table 21: Government Spending Projection (% GDP)
2014 2015 2020 2025 2030 2035 2040 2045 2050 2055 2060 Education 5.0 5.1 5.3 5.1 4.7 4.3 3.9 3.6 3.4 3.3 3.1 Health 3.9 3.9 4.1 4.0 3.8 3.8 3.7 3.7 3.6 3.6 3.6 RGPS 8.3 8.8 10.2 10.9 11.6 12.3 12.9 13.6 14.1 15.7 16.4 RPPS 4.0 4.4 5.7 6.2 6.8 7.4 7.9 8.5 9.1 9.8 10.3 BPC 0.8 0.9 1.0 1.1 1.2 1.3 1.4 1.5 1.6 1.8 1.8 BF 0.5 0.5 0.5 0.4 0.4 0.3 0.3 0.3 0.2 0.2 0.2 Total 22.5 23.7 26.7 27.7 28.5 29.4 30.2 31.2 32.1 34.4 35.5 LTC 0.0 0.0 1.6 1.6 1.6 1.7 1.7 1.8 1.8 1.9 2.0 Total + LTC 22.5 23.7 28.3 29.3 30.1 31.0 32.0 33.0 34.0 36.3 37.5 Source: by the authors.
The total impact of population aging on the government budget projected in this work shows a trajectory of rising demands similar to the one described by Dang, Antolín and Oxley (2001) for OCDE countries. However, the composition of this demand is different. The OCDE estimates show a 0.9% of GDP reduction in education and child transfers, a 3.3% GDP increase in social security and a 3.3% of GDP increase in LTC.
The municipalities expenditure must be reduced by 2060, compared to 2014 by 0.4% of GDP. The main driver to this result is the reduction in the numer of students that will reduce the demand for education in 1% of GDP. Health spending will remain almost the same and public servants social secutiry will increase by 0.7% of GDP.
Table 22: Municipality Government Spending Projection (%GDP)
2014 2015 2020 2025 2030 2035 2040 2045 2050 2055 2060
Health 1.2 1.2 1.3 1.2 1.2 1.2 1.1 1.1 1.1 1.1 1.1
RPPS 0.6 0.6 0.8 0.8 0.9 1.0 1.1 1.1 1.2 1.3 1.3
Total 4.1 4.3 4.6 4.6 4.4 4.2 4.0 3.9 3.9 3.8 3.7
Source: by the authors
By the other hand, State (Table 23) and Federal (Table 24) expenditures will increase in a significant way. Education spending will be reduced in both. However, we will see and increase in public servers social secutiry in state level spending. Health spending will continue around 1% of GDP.
Table 23: State Government Spending Projection (%GDP)
2014 2015 2020 2025 2030 2035 2040 2045 2050 2055 2060
Education 1.6 1.6 1.5 1.4 1.2 1.1 1.0 0.9 0.9 0.8 0.7
Health 1.0 1.0 1.1 1.0 1.0 1.0 1.0 1.0 0.9 0.9 0.9
RPPS 2.0 2.2 2.8 3.1 3.4 3.7 4.0 4.3 4.6 4.8 4.9
Total 4.6 4.8 5.4 5.5 5.7 5.8 6.0 6.2 6.4 6.5 6.5
Source: by the authors
The federal level will have the most part of total spending increase caused by demographic shifts. First of all, social secutiry spending will increase 9.1% of GDP in the period. The reduction in health, education and Bolsa Família social benefit spending will not be enough to reduce the expenditure pressure. Finally, long term care will add another 2% of GDP in spending.
Table 24: Federal Government Spending Projection (%GDP)
2014 2015 2020 2025 2030 2035 2040 2045 2050 2055 2060 Education 1.1 1.2 1.2 1.1 1.0 0.9 0.8 0.7 0.7 0.6 0.6 Health 1.7 1.7 1.8 1.7 1.6 1.6 1.6 1.6 1.5 1.5 1.5 RGPS 8.3 8.8 10.2 10.9 11.6 12.3 12.9 13.6 14.1 15.3 15.5 RPPS 1.4 1.6 2.1 2.3 2.5 2.7 2.9 3.1 3.3 3.5 3.5 BPC 0.8 0.9 1.0 1.1 1.2 1.3 1.4 1.5 1.6 1.7 1.7 BF 0.5 0.5 0.5 0.4 0.4 0.3 0.3 0.3 0.2 0.2 0.2 Total 13.9 14.6 16.7 17.5 18.3 19.1 20.0 20.8 21.6 22.8 23.1 LTC 0.0 0.0 1.6 1.6 1.6 1.7 1.7 1.8 1.8 1.9 1.9 Total + LTC 13.9 14.6 18.2 19.1 19.9 20.8 21.7 22.6 23.4 24.7 25.0
Source: by the authors
8 – Conclusion
This paper shows that the impact of the demographic transition on government spending demands is very strong, considering not only their high limits of their summed contributions, but also the fast rate at which those limits shoul be reached. The estimates predict a rise of 13% of GDP in demands for all the considered ends from 2014 to 2060 (that may reach 15% of GDP
with the introduction of public LTC provision). This expenditures increase will mostly be allocated to social security or to services to the elderly.
The projections show that social security spending, services to the elderly and transfer programs focused on the elderly population will absorb 30.9% of GDP in 2060. This represents a very large amount by all standards, particularly when compared to the same predicted share of 12.6% of GDP for OCDE countries. This means that the extra 3% of GDP spent on social security in Brazil, compared with OCDE countries, will increase to 10% of GDP by 2050. This contrasts with the relative low level of expenditure with health services in Brazil in comparison with OCDE countries, that can not be justified by demographic differences.
Finally, the demand for better health and education services will drive up the pressure over the government for the allocation of more resourses in these areas, implying higher cohort profile costs than the ones adopted for the projections developed in the present work. Therefore, education and health spending projections as developed in this paper should be taken as a lower bound for public expenditure trends on these demands.
9 - References
Barbosa Filho, F., Turra, C., Wajnman, S. e Guimarães, R. (2014) Transição Demográfica, Oferta de Trabalho e Crescimento Econômico no Brasil. Mimeo.
Berestein, C.K., Wajnman, S. (2008). Efeitos da estrutura etária nos gastos com internação no Sistema Único de Saúde: uma análise de decomposição para duas áreas metropolitanas brasileiras. Caderno de Saúde Pública. 24(10):2301-2313.
Brockmann, H., Gampe, J. (2005) The cost of population aging: forecasting future hospital expenses in Germany. MPDIR Working Paper. Max Planck Institute for Demographic Research, Rostock.
Caetano, M (org.) (2008). Previdência Social no Brasil: debates e desafios. Ipea.
Caetano, M (2013) Reforma previdenciária, cedo ou tarde. In: Fabio Giambiagi; Claudio Porto. (Org.). Propostas para o Governo 2015/2018. 1ed.Rio de Janeiro: Elsevier, 2013, v. , p. 253-264.
Caetano, M. (2014) Dinâmica Fiscal da Previdência Social Brasileira. In: Ana Amélia Camarano. (Org.). Novo Regime Demográfico: uma nova relação entre população e desenvolvimento econômico?. 1ed.Rio de Janeiro: IPEA, 2014, v. 1, p. 571-585.
Carvalho, J. A. M.; Wong, L. L. R. (2008). A transição da estrutura etária da população brasileira na primeira metade do século XXI. Cad. Saúde Pública, Rio de Janeiro, v. 24, n. 3.
Cechin, J; Cechin, A. (2007) Desequilíbrios: Causas e Soluções. In Tafner, Paulo e Giambiagi, Fábio (orgs.). Previdência no Brasil – debates, dilemas e escolhas. Ipea, Rio de Janeiro. Costanzi, R. (2017) Reforma da Previdência: Análise da PEC287/2016. Apresentado no
Seminário Reforma da Previdência, Centro Cultural da FGV. Rio de Janeiro, 20 de fevereiro de 2017.
Dang, T., Antolín, P. e Oxley, H. (2001). “Fiscal Implications of Ageing: Projections Age-Related Spending”, OCDE Economics Department Working Papers, No. 305, OCDE Publishing, Paris.
Evans, R.G. (1985). Illusion of necessity: evading responsibility for choice in health care. Journal of Health Politics, Policy and Law. 10:439-467.
Giambiagi, F. e Cechin, J. (2011) Previdência: Em nome dos filhos. In Giambiagi, F e Porto, C. 2022 Propostas para um Brasil melhor no ano do bicentenário. Editora Campus, Rio de Janeiro.
Maisonneuve, C. e Martins, J.O. (2014). The Future of Health and Long-Term Care Spending, OECD Journal: Economic Studies.
Mason, C.N.; Miller, T. (2017) International projections of age specific health care consumption: 2015-2060. The Journal of Economics of Ageing.
Miller, T. (2001). Increasing longevity and Medicare expenditures. Demography. 38(2):215-226.
Miller, T.; Castanheira, H.C. (2013). The fiscal impact of population aging in Brazil: 2005-2050. Revista Brasileira de Estudos Populacionais. 30 Sup. P.S5-S23.
Nepomuceno, M.R., Turra, C.M. (2015). Tendências da expectativa de vida saudável de idosas brasileiras, 1998-2008. Revista de Saúde Pública, 49:1.
Noronha, K. V.; Turra, C.M. (2013). Estudo sobre o pacto intergeracional no setor privado de saúde em um cenário de envelhecimento da população. Relatório de pesquisa apresentado à Agência Nacional de Saúde e OPAS (Organização Pan-Americana de Saúde). Cedeplar, UFMG.
Raitano, M. (2006). The impact of death-related costs on health-care expenditure: a survey. ENEPRI Research Report, n.17.
Reis, C.S.; Noronha, K.V.; Wajnman, S. (2016). Envelhecimento populacional e gastos com internação do SUS: uma análise realizada para o Brasil entre 2000 e 2010. Revista Brasileira de Estudos de População. vol.22, n.2, pp.591-612.
Rocha, A.S. (2015). Custos com benefícios para o financiamento de cuidados de longa duração para idoso com dependência: estimativas e projeções para o Brasil. Tese de Doutorado. Departamento de Demografia, Cedeplar, UFMG.
Rocha, A.S., Turra, C.M. (2016) Idosos com dependência no Brasil: estimativa de custo com política pública para o financiamento de cuidador. Revista Brasileira de Economia Doméstica, Viçosa, v.27, n.2, p.5-28.
Tafner, P. Botelho, C e Erbisti, R. (2013). A previdência brasileira e mudanças demográficas (Convidado a publicar). Cadernos de Educação (Brasília), v. 25, p. 221-243.
Tafner, Paulo (2017). Algumas considerações sobre o sistema previdenciário brasileiro e reforma. Apresentado no Seminário Reforma da Previdência, Centro Cultural da FGV. Rio de Janeiro, 20 de fevereiro de 2017.
Turra, Cassio M. Contabilidade das Gerações: riqueza, sistema de transferências e consequências de mudanças no padrão demográfico. Master's thesis, CEDEPLAR/UFMG, 2000.
Turra, C.M., Queiroz, B.L. Las Transferencias intergeneracionales y la desigualdad
socioeconomica en el Brasil: un analasis inicial. Notas de Poblacion, Santiago, Chile, v.
80, p. 65-98, 2006
Turra, C, Queiroz, B. L. e Rios-Neto, E.L.G. (2011) Idiosyncrasies of intergenerational transfers in Brasil. In: Lee, Ronald, Mason, Andrew (Eds.) Population Aging and the generational Economy: A Global Perspective. Edward Elgar, Northampton, pp. 394-407. United Nations, Department of Economic and Social Affairs, Population Division (2017).
Werblow, A., Felder, S., Zweifel, P. (2007). Population ageing and health care expenditure: a school of “red herring”? Health Economics. 16:1109-1126.
Zweifel, P., Felder, S., Meiers, M. (1999). Ageing of population and health care expenditure: a red herring? Health Economics. 8(6):485-96