Universidade Federal de Santa Catarina www.producaoonline.inf.br
ISSN 1676 - 1901 / Vol. 4/ Num. 1/ Fevereiro de 2004
PRODUCT’S SAFETY INDEX
Widomar Pereira Carpes Junior, Dr. Eng.
Departamento de Metal-Mecânica, Centro Federal de Educação Tecnológica, Florianópolis, Santa Catarina, Brazil
Ingeborg Sell, Dr. rer.nat.
Engenharia de Produção, Universidade Regional de Blumenau, Blumenau, Santa Catarina, Brazil
PRODUCT’S SAFETY INDEX
Widomar Pereira Carpes Junior, Dr. Eng.
Departamento de Metal-Mecânica, Centro Federal de Educação Tecnológica, Florianópolis, Santa Catarina, Brazil
Ingeborg Sell, Dr. rer.nat.
Engenharia de Produção, Universidade Regional de Blumenau, Blumenau, Santa Catarina, Brazil
Depois de diferenciar entre segurança e confiabilidade e revisar formas de medí-las, este artigo apresenta um novo método para mensurar a segurança de produtos, utilizando-se da freqüência e das conseqüências dos acidentes havidos com eles. Ao final, é feita uma aplicação do método para a mensuração da segurança de
equipamentos utilizados na indústria moveleira.
Palavras-chave: Segurança de Produtos; Estimativa de Segurança; Análise da Segurança dos Produtos.
After differentiating between safety and reliability and reviewing ways of assessment, this paper presents a new method for assess the safety of products, utilizing the frequency and consequences of accidents occurring with products. At the end, an application of the method is made for the measurement of safety performance for equipment used in the furniture industry.
Keywords: Product Safety; Safety Assessment; Product Safety Analysis.
1 Introduction
Accidents that have already occurred are frequently used to estimate safety. Accidents mean a lack of safety in products, systems or a work situation. Other times, reliable parameters are used (failure rate, for example) in attempts to evaluate
product safety, although safety and reliability are not synonymous. For example, the sharper the knife, the more reliable it is, but that doesn’t mean it is safe. Reliability is the ability of an item to perform a required function under specified conditions for a given period of time (ABNT, 1994). There are four fundamental parameters for reliability: probability, adequate performance, period of use or life and conditions of use (Dias, 1996). Safety, for its part, is associated with protective measures against accidents, based on the elimination of hazards and control of risks. Related to this is the non-occurrence of damage, injuries or prejudices of any nature, while reliability is associated with fulfillment of a mission. Safety is a condition that is opposed to the occurrence of accidents, occasioned by the presence of hazards in a product (Carpes Jr., 2001). This concept of safety does the use of a “failure” event unviable as the only parameter of safety for products or systems.
Due to this lack of clarity and distinction between the concepts of reliability and safety, safety analysis techniques - failure modes and effects analysis (FMEA) and fault tree analysis (FTA), for example - have been used to evaluate product safety. As these are geared towards reliability, such analyses contribute little or nothing to the improvement of product safety, except when it depends of reliability, as in cases where component failure can result in accidents.
2 Review of Safety Assessment
The first attempt to estimate safety arose with the North American Military Standard MIL-STD 882, that classifys hazards in relation to the severity of the consequences should an accident occur (table 1) and in relation to the probability of an accident occurring (table 2), with a hierarchy between the various level sujectively established. The criticality matrix (table 3) results in a product of probability of occurrence based on severity. The use of this matrix depends on the company’s policy, which must establish a level of acceptable risk for each product, an occasion in which subjectivity dominates. Other qualitative methods for safety systems are variations of this Standard (Gruhn, 1991).
Potential Consequences Level Description Personal Injuries Environment Loss of
Production and/or Equipament
5 Catastrophic Death Exposure to
external
environment with damage
≥ M$1.5
4 Severe Accident with loss of time Severe Injuries Exposure to external environment without damage ≥$500.000 to M$1.5 3 Serious Medical treatment
and restrictions on work Local exposure contained immediately ≥$100.000 to $500.000 2 Minor First Aid Local exposure
contained immediately
>$2.500 to $100.000 1 Negligible No injuries No exposure ≤ $ 2.500
Table 2 – Hazard probability levels (Gruhn, 1991)
Frequency of Occurence
Level Description Frequency
5 Frequent Continually experimented 4 Probable Will occur frequently 3 Occasional Will occur sometimes
2 Remote Uncommon, but it is reasonable to expect occurrence
1 Improbable Uncommon, but possible Table 3 - Criticality matrix (Gruhn, 1991)
Hazard Probability 5 4 3 2 1 5 25 20 15 10 5 4 20 16 12 8 4 3 15 12 9 6 3 2 10 8 6 4 2 Hazard Severity 1 5 4 3 2 1
Wang et al.(1996) propose a technique using multiple criteria for improving safety systems that uses the transformation of linguistic expressions, such as
catastrophic or very low, into numerical values from 0 to 10. These values are distributed in groups of similar tables and matrixes and present the probability of occurrence, intensity of consequences and the probability of occurrence of the consequences of failures. Operating with the matrixes generates numerical values that can be converted into qualitative expressions of safety and appear in a table as: poor, medium, good and excellent. Wang’s technique (1991) may be characterized as subjective, as it tries to transform qualitative concepts or values into quantitative ones. Besides this, one may question if this technique is really for safety, as it used reliability data such as probability of occurrence and failures.
The quantitative methods found in the literature, such as FTA and FMEA, are related, principally, to the quantification of occurrence of systems failure events, which includes estimates of human error and human reliability, relating them to the safety of the system. These methods consider that human reliability, although an abstract assessment, is subject to assessments (Dougherty, 1997). But human error, and consequently human reliability, are dependent on the situation and various factors that are difficult to assess, such as access to memory and motor skills, raising questions about their use in the assessment of product safety.
According to Lederman et al.(1995), techniques of analysis that try to estimate safety in terms of probability are more reliable when these do not depend on the intervention of human beings. These utilize the following parameters: reliability R, median failure rateλ, mean time to first failure (MTTFF), mean time between failures (MTBF) and mean repair time (MRT).
Within this idea of estimating safety through reliability, Gruhn (1991) conceptualizes availability, a term used to quantify the safety performance of a system, expressed by equation 1.
operation of time Total operation safe of Time ty Availabili = (Eq. 1) For Gruhn (1991), availability (A) is the best way of quantifying the safety
(
)
∫
( )
⋅ − = 2 1 1 2 2 1 1 , t t At dt t t t t A (Eq. 2) Where:t1 = initial time of operation;
t2 = final time of operation.
The concept of availability also contains an association between failure and safety, i.e., between reliability and safety, as this uses one of the most common parameter of reliability, the time of operation.
As may be observed, the methods mentioned relate safety of the system or product with variables associated with failure incidents, characterizing themselves then, as methods of evaluating reliability. For evaluation, methods that utilize estimates of safety faults or accident occurrence are necessary.
The American Standards Association presents its accident statistics through numerical coefficients associated with two basic parameters: the frequency of accidents and the severity of accidents (Tiffin, et al., 1975), expressed in relation to the time lost through accidents and the total number of hours worked.
Khan & Abbasi (1997), analyzing accidents in the chemical industry, conclude that the severity of accidents must not only include the loss of human life, but also monetary loss and environmental degradation, besides contamination of the air, soil and water. They propose a method of multiple attributes for evaluating the existent hazard in industrial processes that results in an index, which indicates the severity of an accident on a scale of 1 to 10. The method starts with an attempt to describe the scenario of an accident, seeking to estimate the damage and the direct and indirect impacts resulting from it. They consider the three categories of direct impact to be: populational, monetary and eco-systemic. Indirect impacts include the air, soil and water. Use of these parameters makes it possible to estimate, with more accuracy, the severity, magnitude and consequences of accidents.
The parameters of direct impact correspond to the number of people possibly affected, the possible monetary loss and the prejudice to the eco-system if the accident occurs. Damage is estimated in relation to heat, pressure and toxic waste dissipated from an accident, corresponding to the strength or the energy of the typical
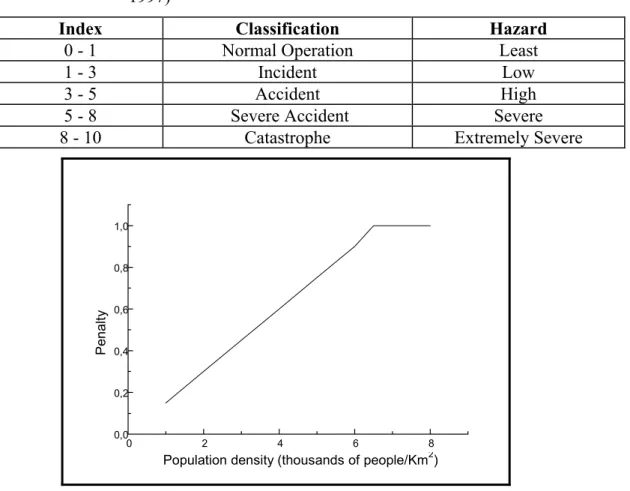
chemical industry agents causing the damage. The population parameter is estimated as a function of the population density around the company (See figure 1), or rather, it considers the relation between the number of people and the area they occupy around the company. The estimate of monetary loss is established as a function of the monetary value stipulated by the assets located near, inside, or outside of the company that could be destroyed in an accident. The eco-system parameter corresponds o the area that could be devastated or aggrieved by an accident. The indirect parameters correspond to the possible contamination that would persist in an area affected by the disposition of solids, liquids and gases resulting from an accident. With the values obtained for each of the parameters and for the potential damages, the authors calculate an index that varies from 1 to 10 and classifies the accidents according to table 4.
Table 4 – Classification of accidents as a function of the index (Khan et al., 1997)
Index Classification Hazard
0 - 1 Normal Operation Least
1 - 3 Incident Low
3 - 5 Accident High
5 - 8 Severe Accident Severe
8 - 10 Catastrophe Extremely Severe
0 2 4 6 8 0,0 0,2 0,4 0,6 0,8 1,0 Penalt y
Population density (thousands of people/Km2)
Figure 1 - Penalty estimation to asses damage to the population (Khan et al., 1997)
Hinze et al.(1995), describe a criterion they use to realize contracts in civil construction: safety performance based on previous accident history. This criterion is significant in the selection of construction companies and uses a viable assesment: the cost of indemnities to workers or expenses due to a company’s lack of safety, constituting an experience modification rating (EMR) (See eq. 3). Data taken from the past three years are is used to calculate this rate, which consider the frequency and severity of accidents that have already occurred. This reflects the ability of the builder to prevent accidents through the use of safety programs in the work environment. B E B W)E (1 WA A EMR p e e + + − + + = (Eq. 3). where:
Ap = actual primary losses (summation of costs below US$ 5,000.00/injury);
W = weight (provided in state experience rating plan manuals);
Ae = actual excess losses (summation of costs above de US$ 5,000.00/injury);
Ee = excessive expected loss (equal to E x (1 – reason for discount ou
reduction));
E = expected excess losses (equal to the payroll x expected loss ratio); B = ballast (provided in state experience rating plan manuals).
The methods of the American Standards Association, Khan & Abbasi (1997) and Hinze et al. (1995), do not make use of reliability parameters but use estimates and data about the lack of safety, characterized as methods for the evaluation of safety. Most of the techniques to assess the safety of products use qualitative data. Of the ones presented, only those applied to the chemical and construction industries use quantitative data, which allows the establishement of a quantitative assessment for product safety. Application of these techniques consists of estimating the consequences of accidents in terms of prejudice to human life, the environment and to finances, in order to estimate lack of safety and thus compliment safety itself.
3 Safety Assessment Method
A method that uses frequency and the consequences of accidents to assess product safety is presented. In estimating safety, the following objectives are pursued:
• Evaluate the safety level of the product;
• Obtain information capable of improving a product’s safety beginning with its design;
• Compare the safety of different products;
• Accompany the safety performance of the product along the course of time. The stages for estimating product safety are:
• Collect and register information about previous accidents; • Assess the consequences of the accidents;
• Assess the frequency of the accidents; • Determine the safety index.
The assessment of safety was conceived as trying to estimate how users perceive the consequences of accidents. This perception should include all types of consequences that the user might have. The consequences of accidents can be divided into two groups of basic parameters: one that refers to the frequency or temporal rate of accident occurrence and the other refers to the consequences in terms of injuries and prejudice.
The parameters of the first group have as their objective the denotation of the relationship between the quantity of accidents and the total time of operation or use of the product. The quantity of accidents is the number of accidents that have occurred in a determined period of time. The time of use or operation is expressed in hours. Thus, one parameter of the calculation of safety will be the relationship between the number of accidents and the period of time in which they occurred.
The other group of basic parameters refers to the consequences of the accidents in terms of prejudice to human lives, finances and the environment, and consists of estimates of the possible consequences of accidents computed in the first
group: total prejudice to the user means material and personal damages, such as injuries and death. Financial prejudice, starting with estimates of the financial or monetary parameter, must account for all types of prejudice caused by accidents, including expenses from indemnities, maintenance and recuperation of equipment and installations, recuperation of the environment, hospital internments and procedures, loss of production time, delays, loss and loss of opportunities, among others.
Environmental prejudices must account for the area affected by the accident, which was either partially or completely destroyed and which needs to be recovered. The area affected can be made up of industrial installations, the environment, constructions, seas, lakes, agricultural lands and roads. This accounting should also consider contamination of the air and water. This environmental prejudice is counted in units of area (m2). With the dimensions of the area affected by the accident we can estimate the environmental parameter of the accident.
Prejudice to human life resulting from an accident can be counted in terms of the number of people injured or killed when accidents occur. The reference to ‘people injured’ by an accident is justifiable since, many times, it is not just product users who are injured but also people who were near the scene when an accident occurred. Injuries suffered may vary from light scratches to fatalities. The number of people injured enables estimation of the personal parameter of an accident.
Injuries that people may suffer vary from light scratches to high severe injuries that may end in death. The number of people injured enables estimates of the personal parameter of the accident. Along with the personal and environmental parameters there must still be considered the severity of the injuries and damage to people and the environment, respectively. This severity is related to the intensity of the incident, varying from injuries and damage with an easy and rapid recuperation to ones that are irrevocable.
Once these parameters have been determined through information obtained from the beginning of the accident investigation, we can proceed with an estimate of the product’s safety index, performed as described in items 3.1 and 3.2. The safety index of a product represents a single value that must be conceived as the notion of safety relative to the use of the product, centered around its characteristics. For
example, if an accident occurs with a commercial airliner and 5 people die, this would not be considered a catastrophe as more deaths would be expected from such an event. However, if 5 people die in a car accident (all the passengers), this can be considered a catastrophe. This idea indicates a way of estimating safety as a function of the number of people involved with a product, or as a function of safety offered to the users that depends on the product at a determined moment of use. In truth then, safety is estimated in relation to the characteristics of the product, such as its cost of acquisition, the number of users and the area of the product.
In order to assess the safety of product it is necessary to collect basic information about accidents and the circumstances involved. With this information, safety assessment can proceed, serving to orient designers and manufacturers about the safety of their products, permitting comparison of the values obtained. As a consequence, safety assessment allows the continuous accompaniement of safety, enabling improvement both in relation to the probability and frequency of occurrence and reduction in the severity of accidents. When accompaniment of product safety is did, through graphics, for example, this assessment must show the tendency towards improvement or worsening of safety, revealing the results of efforts did by the designers. As an example, figure 2 presents a graphic for monthly accompaniment of the safety of two models of the same product. Observe that model A has its safety diminished with use. Model B has an index value greater than model A, although in the sommer months its safety went down, probably due to some interaction with the temperature. Comparisons like this help to prepare decision making.
Another example of the application of quantitative values obtained by safety assessment is the possibility of realizing statistical tests or of using Taguchi techniques to verify if a determined aspect can or can not influence the safety of a product. Or, through a history of values obtained through safety assessment, we can know how the safety of a product has performanced over the years.
Safety assessment must establish a reference for the design. With this, the designers will be able to orient themselves in the development, revision and specification of the product’s characteristics, characterizing the prevention of accidents. That being the case, estimated value must express the property called
safety and be applicable in the design of industrial products, in both a corrective and preventative way. 0 0,1 0,2 0,3 0,4 0,5 0,6 0,7 0,8 0,9 1
Jan Feb Mar Apr May Jun Jul Aug Sep Oct Nov Dec
Month
Safety Index
Model A Model B
Figure 2 – Example of a graphic for accompanying the evolution in safety of two models of the same product
3.1 Collecting and Registering Information
The collection and registration of information about accidents is vital to the calculation of the safety index because it embraces the product, object or substance directly related with the accident; the subsystem involved in the accident; the potential hazard offered by the subsystem; the unsafe condition of the product due to alterations; the environmental condition; financial prejudice; resultant injuries; operator actions and the personal factor. Besides their necessity in calculating the safety index, this information is important to designers in the improvement of their product designs.
3.2 Assess the Consequences of Accidents
After the accident investigation, the consequences are estimated, considering the damage and injuries caused by the product and enabling verification of the prejudices caused by the product. An estimate of the consequence of an accident is composed of three parameters measured from the time of the accident: personal, monetary and environment. This evaluation is made form real accidents, about which information can be obtained through interviews with users or accident reports from the companies where the products are being used.
The personal parameter (PP) identifies the number of people affected by the accident, as well as the intensity of the accident upon them, and can be calculated by equation 4. With this, the intensity or severity of the accident can be determined by the resultant consequences or injuries to persons, such as accidents with light injuries, mutilation or death. This is done by responding to two questions: “How many people were injured in the accident?” and “How severe is the most significant injury?” The answers to these questions must be in agreement with the response options in tables 5 and 6.
GP NP
PP= × (Eq. 4) Where:
NP = number of de people affected, according to the classification determined through table 5;
GP = weight attributed to the severity of the injury, according to table 6. In case there were several people injured in the accident, it is necssary to find the most significant injury in order to attribute to it the correct GP value, which can be found through a weighted average, conforming to equation 5.
4 3 2 1 4 3 2 1 N N N N N 4 N 3 N 2 N GP + + + × + × + × + = (Eq. 5) Where:
N1, N2, N3 e N4 = the number of people injured conforming to the injuries in
table 6, or rather, with light, moderate, severe and high severe injuries, respectively.
Table 5 – Numerical values for the number of people injured in an accident Number of People Affected - NP Points
No one was injured 0
The number of injured is less than the number of users at the time of the accident
1 The number of injured is equal to the number of users at the time of the
accident
2 The number of injured is greater than the number of users at the time of the
accident
3
Table 6 – Severity of the injuries suffered Severity of the Injury- GP Weight Attributed to the Severity of the Injury Examples
Light 1 Small cuts, small collisions or shocks with objects,no need to suspend work.
Moderate 2 Injuries that incapacitate work for a limited period of time.
Severe 3 Definitive occupational disease that makes work impossible.
High Severe 4 Permanent invalid status that requires life
assistance, such as paralysis, blindness, coma and death.
Assigning points or values to human lives is a complex task given that they are irreplaceable and of inestimable value to families and friends. For example, in the English courts, the starting point for indemnities from fatal accidents is calculated by the money that the victim would have gain during the rest of his life, enabling stipulation of value on a monetary basis. In the case of non-salaried workers such as housewives, indemnity is calculated by the value necessary to be paid for someone to exercise the work. However, if a person contributed to the accident, there is a reduction in compensation. It won’t do to agree with this form of calculating indemnities: human life cannot be valued just by economic productivity but by what it is; besides, this method increases the complexity of calculations of the safety index. Because of this, we have opted for a assessment centered on the product.
The environement affected identifies the area and environmental severity of the accident, such as environmental contamination and destruction of property. In relation to environmental severity, we can divide the effects of accidents into
consequences whose recuperations are immediate or short term, medium term and long term or impossible. To determine the environmental damage caused by accidents, one must respond to two questions: What area was destroyed as a result of the accident?” and How severe was the destruction to the area?”
The possible responses are in tables 7 and 8. To determine the greater area of the product, use table 7, multiplying the two largest dimensions of the product. The environmental parameter (PA) can be calculated with equation 6.
GA AA
PA = × (Eq. 6) Where:
AA = area affected by the accident, conforming to Tabela 7;
GA = weight attributed to the severity of environemntal destruction, determined by table 8.
In case of differentiated environmental destruction, it is necessary to find the most significant environmental destruction and attribute it the correct GA value. This correct value is found through a weighted measurement, conforming to equation 7.
4 3 2 1 4 3 2 1 A A A A A 4 A 3 A 2 A GA + + + × + × + × + = (Eq. 7) Where:
A1, A2, A3 e A4 = area destroyed by an accident conforming to classification
of the severity of environmental destruction in table 8, with short, medium and long term or irrevocable recuperation, respectively.
Table 7 - Area destroyed by an accident
Área Affected by the Accident - AA Points
The environment was not affected 0
The area of the affected environment is less than the area formed by the larger area of the product
1 The area of the affected environment is equal to the area formed by the
larger area of the product 2
The area of the affected environment is greater than the area formed by
Table 8 – Severity of environmental destruction Severity of Environmental Destruction GA Weight Attributed to the Severity of Environemental Destruction Examples
Immediate or short term
recuperation (up to 1 year) 1 Destruction of fences, walls, small installations and planted areas
Medium term recuperation
(from 1 to 10 years) 2 Death of small, reforested trees and destruction of large installations
Long term recuperation
(between 10 and 100 anos) 3
Contamination of water with detergents or mineral oils Recuperation impossíble
(period greater than 100 years)
4 Contamination with radioactive uranium
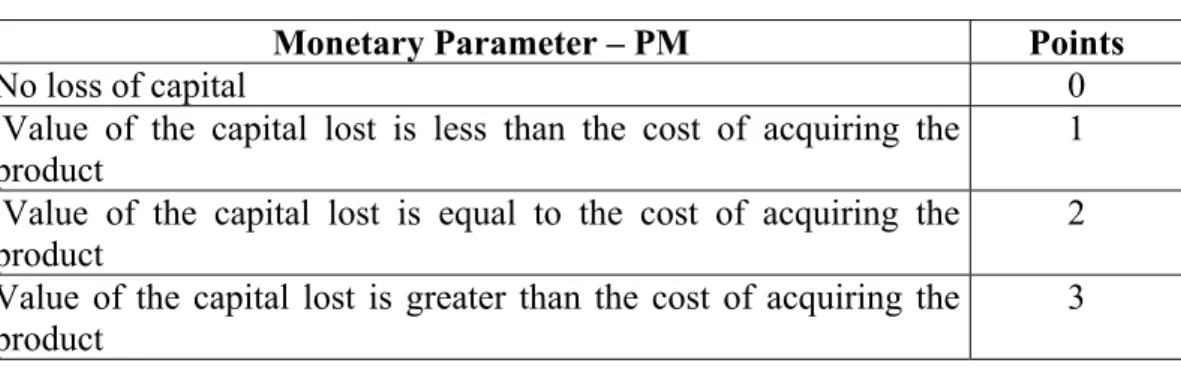
The monetary parameter (PM) indicates the capital losses resulting from an accident. To determine this, it is enough to compare the value of monetary losses with the cost of acquiring the product and responding to the question: What is the relationship between the price of the product and the capital lost due to the accident?” The possible responses are in table 9.
Table 9 – Monetary Parameter.
Monetary Parameter – PM Points
No loss of capital 0
Value of the capital lost is less than the cost of acquiring the
product 1
Value of the capital lost is equal to the cost of acquiring the product
2 Value of the capital lost is greater than the cost of acquiring the
product
3
All of these parameters result in quantitative values that can be grouped into one single value, conforming to equation 8, that determines safety index (IIC) of the product due to consequences of accidents. Equation 8 is used when there is only one observation of the accident. In cases where there are other observations of accidents under study, use equation 9.
∑
× + + × = PMP PM) GA AA GP (NP IIC (Eq. 8)Where:
ΣPMP = maximum possible scores sum for a hazard, due to the values suggested in tables 5 to 9, resulting in 27.
NOB 27 ) (PM ) GA (AA ) GP (NP IIC N 1 i i N 1 i i i N 1 i i i × + × + × =
∑
=∑
=∑
= (Eq. 9) Where: N = number of accidents;NOB = number of observations made.
It is worth restating that the various parameters cannot be used for making comparisons between themselves, like a comparison between monetary values and human life, for example. These are uniquely based on the parameters of the product, being applicable only through assessment of their safety. Another pertinent observation is that the scale of calues for factors NP, AA and PM was conceived over the scope of the accident. The values “0, 1, 2, and 3” signify the consequences and were, respectively, zero, less than, equal to or greater than the parameters of the product. The values of severity GA and GP were conceived with MIL STD-882 as the basis.
3.3 Assess the Frequency of Accidents
The safety index of a product due to the frequency of accidents is given by the relationship between the number of accidents and the hours of utilization of the product, conforming to equation 10.
NTHU NAO
IIF= (Eq. 10) Where:
IIF = product safety index due to frequency of accidents; NAO = number of accidents that have occurred;
NTHU = total number of hours of utilization, including maintenance and transport between utilization sites.
3.4 Determining the Product Safety Index
Considering that safe and unsafe are self-complementary, we have:
Safe = 1 – Unsafe (Eq. 11) And Index of Safety (IS) = (1-IIC) x (1-IIF) (Eq. 12) This safety index represents an estimate of average product safety and can vary between 0 and 1, 1 being the ideal situation of zero accidents with the product. As any accident presuposes the existence of hazards, in order to improve product safety it is necessary to reduce the number and severity of hazards, making the occurrence of accidents difficult and lessening the severity of their consequences. The safety index, and its parameters, allows the realization of continuous and systematic accompaniement of product safety, besides being an aspect of product quality.
Safety assessments must be made with already existent products. Useful information can be obtained from laboratory tests and from accompanying the use of the product by the user. Information arising from the user can be obtained through technical assistance or through a proper system of obtaining user information. It is unrealistic to suppose that a product has 100% safety just because no information to the contrary has been gleaned from the users. In such a case, it is more probable that the user information obtainment system is not functioning properly.
It is recommended, as a question of economy, that the study be a sample, or rather, that the manufacturer be able to verify the safety of its products through information randomly obtained from users. For products made in reduced quantities, but of great responsibility, it may be necessary to assess the safety of all products.
4 Case Study
This case study, which aims to verify the applicability of safety mensurement, was made among companies in the furniture industry in the State of Santa Catarina, more specifically with 5 kinds of equipment: router, circular saw, shaper, spindle moulder and squaring saw. Figure 3 presents the number of accidents with these machines in the companies visited, during the period of January 1st to August 14th,
2000 (227 days), resulting in a total of 5448 work hours. In table 10, the parameters and safety indexes obtained are calculated, these last shown in Figure 4.
0
1
2
3
4
5
6
Shaper
Spindl
e
Mo
ulder
Circular Saw
Rout
er
Squar
ing Sa
w
Number of Accidents
Figure 3 – Number of accidents per machine
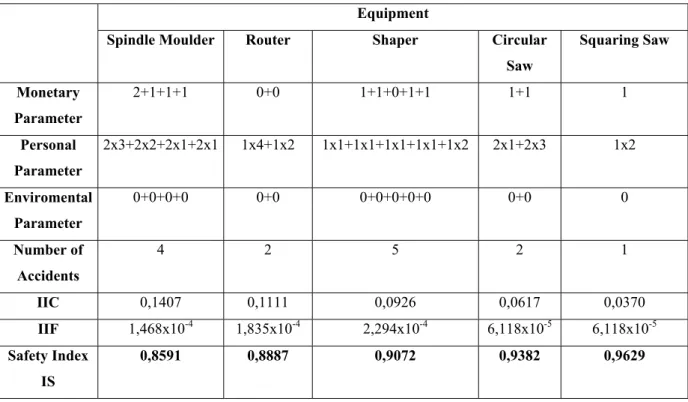
Table 10 – Values of parameters and safety index of the equipment
Equipment
Spindle Moulder Router Shaper Circular
Saw Squaring Saw Monetary Parameter 2+1+1+1 0+0 1+1+0+1+1 1+1 1 Personal Parameter 2x3+2x2+2x1+2x1 1x4+1x2 1x1+1x1+1x1+1x1+1x2 2x1+2x3 1x2 Enviromental Parameter 0+0+0+0 0+0 0+0+0+0+0 0+0 0 Number of Accidents 4 2 5 2 1 IIC 0,1407 0,1111 0,0926 0,0617 0,0370 IIF 1,468x10-4 1,835x10-4 2,294x10-4 6,118x10-5 6,118x10-5 Safety Index IS 0,8591 0,8887 0,9072 0,9382 0,9629
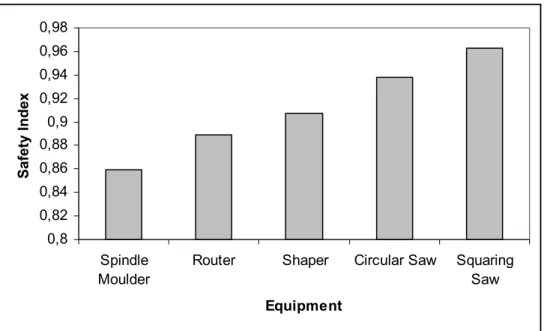
It may be observed that the shaper caused more accidents, although these were the least serious, generating small damage and injuries such as trapped fingers or throwing off fragments. The machines that caused the worst accidents were the spindle moulders and the routers, which can be verified through the safety indexes attributed to these machines: 0.8591 and 0.8887, respectively. The safety indexes obtained are thus consistent with experience.
0,8 0,82 0,84 0,86 0,88 0,9 0,92 0,94 0,96 0,98 Spindle Moulder
Router Shaper Circular Saw Squaring
Saw
Equipment
Safety Index
Figure 4 – Equipment ordered according to safety index
5 Final Considerations
This work compared the significance of safety and reliability, verifying that they are not synonomous. Even so, some techniques of safety analysis avail themselves of reliability data. Assessment of safety enables evaluation of product safety in real conditions of use, which is its principal advantage. Even the best estimates or analytical tools, if applied to a product’s characteristics without consideration of its use, are subject to errors when they do not consider the real interactions between the product and the environment, the abilities of the users and the wear and tear of the product, among other things. In the proposal for estimating product safety presented here, a value or index has been generated which considers the elements that constitute real conditions of use of the product. The principal
function of the determination of a product’s safety index is to accompany the evolution of the product’s safety. Through this index, we may verify if efforts to improve safety have really been obtained. Other information about the product and the the conditions under which accidents occur serve to demonstrate for the designer how those accidents occurred.
Application of safety assessment demonstrates that it may be used with different products, and thus applicable with any product. Besides this, safety assessment provides consistent values, since it not only considers the number of accidents but also their intensity and severity, which results in values different from those that are traditionally represented as safety indicators. This can be observed in comparing figures 3 and 4.
The safety index is an estimate of an aspect of qualtiy perceived by the user of the product: safety. The complement of this index reflects an estimate of what the user perceives when accidents occur, or rather, that product safety is partial instead of absolute, and the index estimates this partial sense. It thus takes into consideration the feelings that the user has in relation to a product.
The product safety estimate could be realized through analytical techniques made about the product’s characteristics, without considering accidents that have occurred. However, this estimate would be unrealistic since it would not consider the real use of the product, which may different from the intended design. Besides, users cannot be adequately trained to use the product correctly. An evaluation of a product’s safety, starting with its characteristics, is useful for new products not yet in use, without similar products being available. In spite of the difficulties, this evaluation reveals hazards that exist in the product, a basic pre-condition in the occurrence of accidents.
6 References
(ABNT, 1994) ASSOCIAÇÃO BRASILEIRA DE NORMAS TÉCNICAS. Rio de Janeiro. NBR 5462, Confiabilidade e Mantenabilidade - Terminologia. Rio de Janeiro, 1994. 37 pg.
(Carpes Jr., 2001) Carpes Jr., Widomar Pereira. Análise da Segurança Humana para Desenvolvimento de Produtos mais Seguros. Tese de Doutorado. Florianópolis: Universidade Federal de Santa Catarina, 2001. 251p. (Dias, 1996) Dias, Acires. Metodologia para Análise da Confiabilidade em Freios
Pneumáticos Automotivos. Tese de Doutorado. São Paulo: Universidade Estadual de Campinas, 1996. 119 p.
(Dougherty, 1997) Dougherty, E.M. Is human failure a stochastic process? Reliability Engineering and System Safety, 1997, no 55, pg 209-215.
(Gruhn, 1991) Gruhn, P. The pros and cons of qualitative & quantitative analysis of safety systems. ISA Transactions, 1991, vol. 30, no 4, pg 79-86.
(Hinze et al., 1995) Hinze, J.; Bren, D.C.; Piepho, N. Experience modification rating as measure of safety performance. Journal of Construction Engineering and Management, dec. 1995, vol. 121, no 4, pg 455-458.
(Khan et al., 1997) Khan, F.I.; Abbasi, S.A. Accident Hazard Index: a multi-attribute method for process industry hazard rating. Process Safety and Environmental Protection, Nov 1997, vol. 75, no 4, pg 217-224.
(Lederman et al., 1995) Lederman, L.; Niehaus, F.; Tomic, B. Probabilistic safety assessment past, present and future. An IAEA pespective. Nuclear Design and Engineering, No 160, 1995. pg. 273-285.
(Tiffin et al., 1975) Tiffin, J.; McCormick, E.J. Psicologia Industrial. São Paulo, EPU, 1975.
(Wang et al., 1996) Wang, J.; Yang, J.B.; Sen, P. Multi-person and multi-attribute design evaluations using evidential reasoning based on subjective safety and cost analyses. Reliability Engineering and System Safety, no 52, 1996.