UNIVERSIDADE DA BEIRA INTERIOR
Engenharia
Automatization of Real Time GNSS Data
Acquisition, Validation, Processing for Water
Vapor Estimation
NUVEM
Hugo Valentim Figueira Gonçalves
Dissertação para obtenção do Grau de Mestre em
Engenharia Informática
(2º ciclo de estudos)
Orientador: Prof. Doutor Rui Manuel da Silva Fernandes
Acknowledgements
I would like to thank my supervisor Prof. Rui Fernandes for all his support, enthusiasm, pa-tience, time and effort. I am grateful for all his guidance in all of the research and writing of this dissertation. It was very important to me to work with someone with experience and knowledge and that believed in my work.
I would also like to thank all the other SEGAL members that accompanied, supported and en-couraged me in this journey. Thank you André Sá, João Apolinário, Machiel Bos, Rafael Couto, Prof. Paul Crocker, Prof. Carlos Barrico and Cristiano Geraldes.
I am also very grateful to my girlfriend Andreia Lobo, her encouragement and patience were a key factor in the achievement of this goal.
I would like to thank my mother, father and my brother for all their support. They always gave me strength and encouragement to achieve my dreams. Without them this work would not be possible. I am really grateful to all of you.
I would like to refer the networks ReNEP (http://www.dgterritorio.pt/cartografia_e_geodesia/ geodesia/redes_geodesicas/renep/), SERVIR (https://www.igeoe.pt/index.php?id=45), ANDALU-CIA (http://www.ideandalucia.es/ portal/web/portal-posicionamiento), EXTREMADURA (http:// www.rep-gnss.es/), IGN (http://www.ign.es/ign/ main/index.do) and CASTILLA (http://gnss.ita cyl.es/) for their openness and availability to provide data to support this dissertation. I would also like to acknowledge IPMA, specially the team involved in the NUVEM project Dr. Pedro Viterbo, Dr. João Martins, Tiago Machado and Gonçalo Rodrigues for their efforts which con-tributed to make this work possible.
This work was carried out in the framework of the Portuguese Project NUVEM (EXPL/GEO-MET/0413/2013), supported by the Portuguese Science Foundation. The author was funded by the project FCT UID/GEO/50019/2013 - Instituto Dom Luiz.
Abstract
In the recent years, Global Navigation Satellite Systems (GNSS), in particular Global Positioning Systems (GPS), have proved their capacity to monitor atmospheric water vapor with an accu-racy that is comparable to the accuaccu-racy of other conventional meteorological sensors. GNSS has several significant advantages compared to the traditional observational systems, including low operating expense, all-weather operability and high temporal/spatial coverage. As a result, the provision of Zenith Total Delay (ZTD) and derived Precipitable Water Vapor (PWV) from GNSS data has become established as a standard and valid technique. These atmospheric parameters are currently assimilated into regional weather forecast models (Meteo Office UK; Meteo France and German Research Center for Geosciences (GFZ)). However, the accuracy of the near real-time estimates for these values is still in active research issue.
This dissertation describes the implementation and testing of the estimation of PWV in near-real time that was carried out at SEGAL in framework of the NUVEM project during 2015-2016. The scheme to estimate the atmospheric parameters (ZTD and PWV) and to deliver them timely to the Portuguese Meteo Office (IPMA - Instituto Português do Mar e da Atmosfera) is described in detail. The focus was on the computational component of the scheme but some studies using the estimated solutions were also necessary to be performed in order to obtain some necessary parameters for the operational phase of the project.
The timely estimation of the solutions depends of several processes, which needed to be anal-ysed and optimized separately (but considering always their integration in the full schema), namely:
• download of the GNSS data from external providers since the project relies on the data acquired by different GNSS networks in Portugal and Spain.
• download of the additional products (orbits and clocks) necessary to process the GNSS data.
• retrieve from numerical models the values (temperature & pressure) necessary to convert from ZTD to PWV (done at IPMA).
• processing of the GNSS solutions as soon as the data and products were available. • uploading of numerical and graphical solutions to IPMA and to the dedicated website. • redundancy of the system in order to guarantee a maximum operational (online) time. Additional features and improvements can be implemented in the future in order to further op-timize the use of GNSS-PWV in Portugal for nowcasting. Nevertheless, the goals were achieved since the NUVEM system is currently running in operational mode at SEGAL providing IPMA with timely PWV estimates that can be used to help the analysis of atmospheric events in near-real time.
Keywords
Resumo alargado
Nos últimos anos, Sistemas de Navegação Global por Satélite (GNSS), em particular o Sistema de Posicionamento Global (GPS), têm provado a sua capacidade para monitorizar o vapor de agua existente na atmosfera, com uma precisão ao nível de outras soluções mais tradicionais. Este tipo de sistemas tem várias vantagens comparado com os tradicionais sistemas de observação. Entre estas vantagens estão o baixo custo de operacionalização, e a alta cobertura espacial e temporal. Como resultado a previsão de Atraso Total de Zenith (ZTD) e a previsão de Vapor de Água Precipitável (PWV) foi estabelecido como uma técnica de observação standard. ZTDs e PWVs já são hoje em dia utilizados em vários países (nomeadamente Reino Unido, França e Ale-manha) como um dos factores que ajuda nos modelos de meteorologia. No entanto, a precisão das estimativas de ZTD/PWV em tempo quase real baseadas em orbitas ultra rápidas do sistema GPS, encontra-se ainda em estudo.
Nesta dissertação é descrita a implementação e os testes de validação da computação de PWV em tempo quase real feita pelo SEGAL no âmbito do projecto NUVEM que ocorreu entre 2015 e 2016, o esquema de cálculo dos parâmetros atmosféricos (ZTD e PWV) e o seu envio atem-padamente ao Instituto Português do Mar e da Atmosfera (IPMA) é descrito em detalhe. O foco centrou-se na componente informática. No entanto alguns estudos, relativos aos resultados obtidos, foram realizados de forma a poder definir alguns parâmetros necessários na fase op-eracional do projecto.
A computação das soluções está dependente de vários processos. Houve a necessidade destes serem analisados e optimizados separadamente. Eles são:
• download dos dados GNSS dos provedores externos, uma vez que o projecto depende desses dados, adquiridos em diferentes redes GNSS em Portugal e Espanha;
• download dos dados adicionais (órbitas e relógios) necessários à computação dos dados GNSS;
• obtenção via modelos de previsão numérica dos valores de pressão e temperatura necessários para a conversão de ZTD em PWV (feito pelo IPMA);
• computação das soluções GNSS tão rápido quanto possível;
• upload das soluções (numéricas e gráficas) para o IPMA e para o website; • redundância dos recursos computacionais.
Existem funcionalidades e melhorias que podem ser implementadas no futuro de forma a opti-mizar o uso de GNSS-PWV para o nowcasting em Portugal. Contudo, os objectivos foram atingi-dos, uma vez que, o sistema NUVEM está em modo operacional, sendo executado no SEGAL e providenciando ao IPMA as soluções que são depois usados na análise de eventos atmosféricos em tempo quase real.
Palavras-Chave
Contents
1 Introduction 1 1.1 Motivation . . . 1 1.2 Problem Statement . . . 2 1.3 Objectives . . . 2 1.4 Approach . . . 2 1.5 Main Contribuitions . . . 3 1.6 Dissertation Structure . . . 42 GNSS and Water Vapor 5 2.1 GNSS Overview . . . 5
2.2 Water Vapor Overview . . . 5
2.3 GNSS Water Vapor Estimation . . . 6
2.4 Summary . . . 8
3 State of the Art 9 3.1 GNSS Processing . . . 9
3.1.1 Processing Methods . . . 9
3.1.2 Processing Software . . . 10
3.1.3 Method and Software Used in the Dissertation . . . 11
3.2 Satellite Orbits . . . 11
3.2.1 Ultra-Rapid . . . 12
3.2.2 Stream . . . 12
3.3 Pressure & Temperature . . . 12
3.4 Water Vapor by other methods . . . 13
3.4.1 Radiosonde . . . 13
3.4.2 Satellite Image . . . 14
3.4.3 Numerical Weather Prediction Models . . . 15
3.4.4 NESDIS Blended Total Precipitable Water . . . 16
3.5 Use Cases around the world . . . 17
3.5.1 European Project . . . 17
3.5.2 METEOOFFICE - United Kingdom . . . 17
3.6 Summary . . . 19
4 System and Network Infrastructure Preparation 21 4.1 SEGAL Infrastructure . . . 21 4.2 Virtualization . . . 22 4.2.1 Virtualization Approach . . . 22 4.3 Virtualization Hosts . . . 24 4.3.1 VMWare . . . 24 4.3.2 Microsoft Hyper-V . . . 24 4.3.3 Oracle VM . . . 24 4.4 Oracle VM - Implementation . . . 24 4.4.1 Migration . . . 25 4.5 Redundancy . . . 26
4.6 New Virtualized Infrastructure . . . 26 4.6.1 Hardware description . . . 27 4.7 Operating System . . . 30 4.7.1 Users . . . 31 4.7.2 Folder Structure . . . 31 4.8 Summary . . . 34
5 Near Real Time Data Acquisition 35 5.1 Networks . . . 35 5.2 Technologies used . . . 36 5.2.1 TCSH . . . 36 5.2.2 Java . . . 37 5.2.3 Linux Tools . . . 37 5.2.4 TEQC . . . 37 5.3 System Architecture . . . 37
5.3.1 Ultra Rapid Orbits and Clock Acquisition . . . 38
5.3.2 Pressure and Temperature . . . 39
5.3.3 RINEX files acquisition . . . 41
5.3.4 Processing . . . 45
5.3.5 Graphic Generator . . . 47
5.3.6 Auxiliary Scripts . . . 49
5.4 Summary . . . 52
6 Results & Data Validation 53 6.1 Network Reliability . . . 53
6.1.1 Data availability . . . 53
6.1.2 Average delay . . . 56
6.2 Time Window Influence testing . . . 61
6.2.1 Processing with 20 hours . . . 62
6.2.2 Processing with 10 hours . . . 65
6.3 Rule definition . . . 67 6.4 GNSS-PWV Quality Testing . . . 67 6.5 Summary . . . 71 7 Conclusions 73 7.1 Implemented objectives . . . 73 7.2 System assessment . . . 74 7.3 Final notes . . . 74 7.4 Future Work . . . 75 Bibliografia 77 A GNSS Processing Software 81 A.1 RTKLIB . . . 81 A.2 GPSTk . . . 82 A.3 BERNESE . . . 83 A.4 RTNet . . . 84 A.5 GAMIT . . . 85
B Files and Logs of the System 87
B.1 NETWORK files . . . 87 B.2 Log for files missing . . . 88 B.3 Log for statistics . . . 88
List of Figures
1.1 Lisbon, 22nd September 2014, extreme weather event . . . 1
2.1 Layers of the Earth's atmosphere . . . 6
2.2 GPS signal between the satellites and receiver. . . 7
3.1 Weather balloon carrying a radiosonde. . . 14
3.2 Example of a visible Satellite image of the atlantic ocean. . . 15
3.3 Example of an Infrared Satellite image of the Iberian Peninsula. . . 15
3.4 Orography based on ALADIN. . . 16
3.5 Orography based on AROME. . . 16
3.6 Orography based on ECMWF. . . 16
3.7 Example of an image of the NESDIS project. . . 17
3.8 METO system processing data flow. . . 18
4.1 Old SEGAL Cabinet and arrangement . . . 21
4.2 Exemplification of the Server Pool System . . . 23
4.3 Overview of the OVMM web interface . . . 25
4.4 SEGAL new arrangement . . . 27
4.5 Representation of the RAID5 . . . 27
4.6 NAS System QNAP TS-420U . . . 28
4.7 Representation of the RAID1 . . . 28
4.8 Oracle VM Server 1: Dell PowerEdge R820 . . . 29
4.9 Oracle VM Server 2: HP ML360 G8 . . . 29
4.10 Oracle VM Server 1: HP ML380 G6 . . . 29
4.11 UPS1: Riello Vision Dual . . . 30
4.12 UPS2: APC SmartUps . . . 30
4.13 Folder structure for the Pressure and Temperature files . . . 31
4.14 Folder structure for the Orbits files . . . 32
4.15 Folder structure for the NUVEM system . . . 33
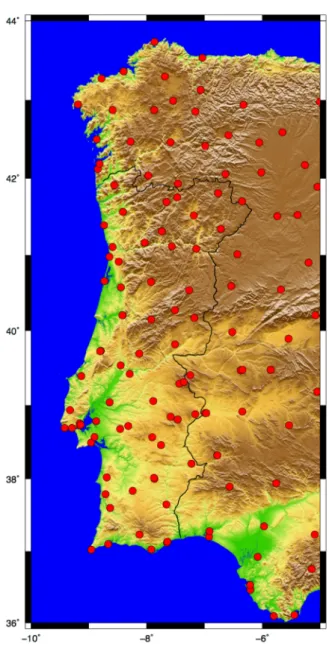
5.1 Map with the Sites used in the NUVEM project. . . 36
5.2 General Diagram of the System. . . 38
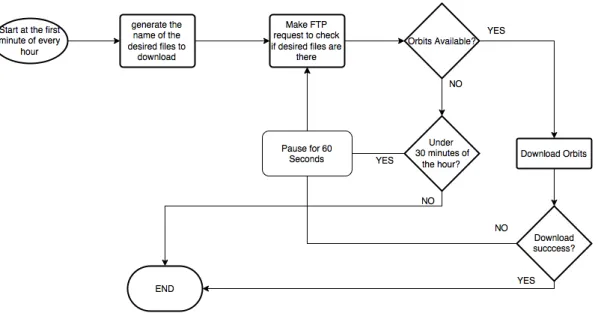
5.3 Diagram of the Orbits and Clock files download. . . 39
5.4 Diagram IPMA uploading files to SEGAL. . . 39
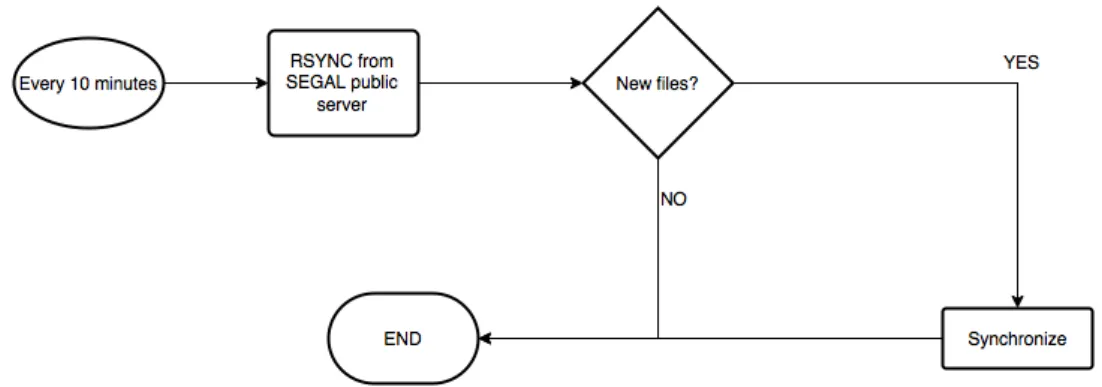
5.5 SEGAL internal synchronization of the Pressure and Temperature files from the Public Server to the NUVEM Virtual Machine. . . 40
5.6 Pressure and Temperature file conversion. . . 40
5.7 Flowchart GNSS data download. . . 42
5.8 Flowchart GNSS data download - ANDALUCIA. . . 44
5.9 First step of the processing scheme. . . 45
5.10 Second step of the processing scheme. . . 46
5.11 Image of the NUVEM project website. . . 47
5.12 Movie of an hour generation diagram. . . 48
5.14 Retest Stations auxiliary script diagram. . . 51
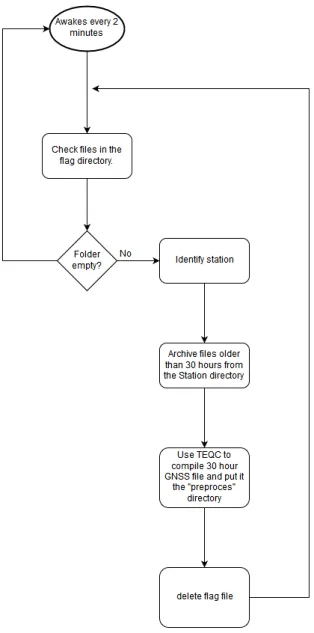
5.15 Clean 30 hours auxiliary script diagram. . . 52
6.1 downloaded files per station (ANDALUCIA network) . . . 54
6.2 downloaded files per station (EXTREMADURA network) . . . 54
6.3 downloaded files per station (IGN network) . . . 55
6.4 downloaded files per station (ReNEP network) . . . 55
6.5 downloaded files per station (SERVIR network) . . . 56
6.6 Average delay in minutes per station (ANDALUCIA network) . . . 57
6.7 Chart with statistics for network Andalucia . . . 57
6.8 Average delay in minutes per station (EXTREMADURA network) . . . 58
6.9 Chart with statistics for network Extremadura . . . 58
6.10 Average delay in minutes per station (IGN network) . . . 59
6.11 Chart with statistics for network IGN . . . 59
6.12 Average delay in minutes per station (ReNEP network) . . . 60
6.13 Chart with statistics for network ReNEP . . . 60
6.14 Average delay in minutes per station (SERVIR network) . . . 61
6.15 Chart with statistics for network SERVIR . . . 61
6.16 Difference for processing ZTD with 20 or 30 hours for the AGUE station - 05/05/2016 to 09/05/2016 . . . 63
6.17 Difference for processing ZTD with 20 or 30 hours for the MOGA station - 05/05/2016 to 09/05/2016 . . . 64
6.18 Difference for processing ZTD with 10 or 30 hours for the BEJA station - 19/05/2016 to 23/05/2016 . . . 65
6.19 Difference for processing ZTD with 10 or 30 hours for the BRGN station - 19/05/2016 to 23/05/2016 . . . 66
6.20 Graph with RMS for five stations . . . 67
6.21 Graph with RMS of all stations . . . 68
B.1 stations_network file - ReNEP . . . 87
B.2 Stations_network file - IGN . . . 87
B.3 downloads_missingNETWORK log file - ReNEP . . . 88
List of Tables
3.1 Types of Software and Licencing . . . 10 6.1 Difference for processing ZTD with 20 or 30 hours for the AGUE station - 05/05/2016
to 09/05/2016 . . . 63 6.2 Difference for processing ZTD with 20 or 30 hours for the MOGA station - 05/05/2016
to 09/05/2016 . . . 64 6.3 Difference for processing ZTD with 10 or 30 hours for the BEJA station - 19/05/2016
to 23/05/2016 . . . 65 6.4 Difference for processing ZTD with 10 or 30 hours for the BRGN station - 19/05/2016
to 23/05/2016 . . . 66 6.5 Results of the differences greater than 1mm, 2mm or 3mm in percentage
com-bined by station . . . 70 6.6 Results of the differences greater than 1mm, 2mm or 3mm in percentage
List of Acronyms
UBI Universidade da Beira Interior FCT Fundação Ciência e Tecnologia
SEGAL Space and Earth Geodetic Analysis Laboratory
NUVEM New methods to Use GNSS Vapor Estimates for Meteorology of Portugal GNSS Global Navigation Satellite System
GPS Global Positioning System ZTD Zenith Total Delay PWV Precipitable Water Vapor
IPMA Instituto Português do Mar e da Atmosfera GFZ German Research Center for Geosciences GLONASS Russia Global Navigation Satellite System Galileo Europe global navigation satellite system BDS China BuiDou Navigation Satellite System TOA Time Of Arrival
ZHD Zenith Hydrostatic Delay ZWD Zenith Wet Delay
MF Mapping Function
NWP Numerical Weather Prediction VMF1 Vienna Mapping function 1
DD Double Difference PPP Precise point positioning JPL Jet Propulsion Laboratory IGS International GNSS Service
COST Co-operation in the Field of Scientific and Technical Research EUMETNET Network of European Meteorological Services
E-GVAP EIG GNSS water vapour program GEO Geostationary Earth Orbit
LEO Low Earth Orbit
TPW Total Precipitable Water NAS Network Attached Storage Disks UPS Uninterruptible Power Supply SAN Storage Area Network
OVMS Oracle Virtual Machine Server OVMM Oracle Virtual Machine Manager
NFS Network File System VM Virtual Machines
OS Operating System
RAID Redundant Array of Inexpensive Drives IGN Instituto Geográfico Nacional
UTC Universal Time Coordinated FTP File Transfer Protocol
NTRIP Network Transport of RTCM via Internet Protocol BNC BKG NTRIP Client
ReNEP Rede Nacional de Estações Permanentes
Chapter 1
Introduction
1.1
Motivation
Weather forecast is a very difficult field of study, because many factors can alter the weather in a question of minutes. This is clearly a big problem since an extreme weather event can occur without a warning of the responsible authorities. Without a proper warning from the authorities people won't take precaution. This may cause extreme loss, or even, in some very extreme cases, death. Figure 1.1 shows an example of an extreme weather event that took place in Lisbon in 22 September of 2014.
Figure 1.1: Lisbon, 22nd September 2014, extreme weather event
In some countries, particularly in Europe, a new method to help in the prediction of these ex-treme weather events has been emerging. This method consists in using the Global Navigation Satellite System (GNSS) networks. GNSS stations provide observations at a really fast and con-tinuous rate. With the GNSS observations it is possible to calculate the Zenith Total Delay (ZTD), that represents the atmospheric delay of the GPS signal arriving along the zenith direction. From this it is possible to estimate the Precipitable Water Vapor (PWV) (a more detailed explanation regarding the co-relation between ZTD and PWV is located in Chapter 2). The amount of Water Vapor in the atmosphere is one of the most important factors influencing the weather. This makes the GNSS-PWV product a great help to Meteorologists, so that they can identify extreme weather events more easily.
This dissertation is part of the NUVEM project (New methods to Use GNSS Vapor Estimates for Meteorology of Portugal). This project was an exploratory project financed by the FCT (Por-tuguese Science Foundation) with the reference, EXPL/GEO-MET/0413/2013, that started in 01 of April of 2014 and ended in 30 of September of 2015.
On the personal side, what motivated me to choose this topic has my dissertation was the possibility of working in a multi-disciplinary project that combine Meteorology and Computer Sciences. This is very important to me because it is a real world application of Informatics that will connect Geodesy and Meteorology. And it is very gratifying being a part of such an impor-tant project.
1.2
Problem Statement
The problem addressed in this dissertation concerns the issue partially discussed above. The weather can be very unpredictable, and there are few methods that can provide such an impor-tant factor, as Water Vapor in a continuous near real time approach.
In this scenario the GNSS-PWV can be of good help to the responsible authorities. But before they can use this product it is very important to study how reliable it is. Therefore it is necessary to develop an automated system that can calculate the GNSS-PWV and after that validate the system.
1.3
Objectives
The main objective of this dissertation was to optimize the operationalization of the computa-tion of PWV estimates using data retrieved from several GNSS networks in Portugal and Spain and deliver them timely to the Portuguese Meteo Office (IPMA). This process should be done as fast as possible, since the main purpose is to support the nowcasting activities, particularly during the occurrence of Extreme Weather events.
It was also necessary to study the reliability of the networks, the influence of lack of data for the PWV computation and, most importantly, the accuracy of the obtained GNSS-PWV, compared with the most accurate estimates of Water Vapor, that can be obtained about 15 days later.
1.4
Approach
The adopted approach for solving the problem mentioned in the previous section can be sum-marised and structured into the following stages:
1. The first stage consisted in identifying several elements necessary for the GNSS-PWV com-putation. Defining strategies to obtain them efficiently, whilst taking into account the SEGAL and IPMA infrastructures;
2. Stage two consisted in preparing SEGAL's infrastructure in order to provide the best support to the project;
4. In Stage four a series of tests were conducted to asses, the quality of the generated solu-tions, and the reliability of the networks used;
5. Stage five, the last one, consisted in applying the rules, generated based on the tests conducted in Stage four.
1.5
Main Contribuitions
The main contributions of this dissertation are presented here .
The first contribution consists in the development of several computational applications that, based on existing software packages, implemented an integrated system to:
• Download GNSS raw data from several sources;
• Processing the acquired data using the GIPSY/OASIS software (more details further); • Extract ZTD values;
• Calculate the PWV; • Upload files to IPMA.
During the course of this dissertation the following posters and conference papers were pre-sented:
• A Poster with the title "New methods to Use GNSS Vapor Estimates for Meteorology of Portugal (NUVEM)" was presented at GNSS4WEC 2014 Summer School, in Varna, Bulgaria in September 2014 (http://nuvem.di.ubi.pt/publicacoes/valentim_varna.pdf).
• A Poster with the title "New methods to Use GNSS Vapor Estimates for Meteorology of Portugal" was submitted and accepted for the AGU 2014 in San Francisco, United States in December 2014 (http://nuvem.di.ubi.pt/publicacoes/fernandes_agu.pdf).
• An article with the title "Aplicações de produtos de vapor de água com base em GNSS" was submitted and accepted for the APMG2015 – 9º Simpósio de Meteorologia e Geofísica da APMG, in Tavira, Portugal in March 2015 (http://nuvem.di.ubi.pt/publicacoes/machado _apmg.pdf).
• An article with the title "Desenvolvimento de um produto de vapor de água integrado com base em estimativas GNSS" was submitted and accepted for the APMG2015 – 9º Simpósio de Meteorologia e Geofísica da APMG, in Tavira, Portugal in March 2015 (http://nuvem.di.ubi. pt/publicacoes /rodrigues_apmg.pdf).
• An article with the title "Operational Forecast in Near Real Time of Perceptible Water Vapor from GNSS data for Portugal" was submitted and accepted for the 9th Spanish Portuguese Assembly of Geodesy and Geophysics, in Madrid, in 28-30th June 2016
A project website with the general info and publications was also developed, and can be found at http://nuvem.di.ubi.pt
1.6
Dissertation Structure
This dissertation is organised in seven chapters. The contents of such chapters can be sum-marised as follows:
Chapter 1 - Introduction Refers to this chapter, it contains the motivation. The problem
state-ment, the objectives of the dissertation and the approach used throughout the project.. It also contains the main contributions for this dissertation.
Chapter 2 - GNSS and Water Vapor In this chapter the relation between the GNSS and the
wa-ter vapor is described in detail, namely the definitions and methods of estimating wawa-ter vapor.
Chapter 3 - State of the Art Analyses the different GNSS orbit types, the different methods to
compute GNSS data, and the different software available for it. An explication regarding the different satellite Orbits and Clock products is made. It also analyses different Pressure & Temperature models. A small comparison between GNSS-PWV and other methods to obtain PWV is made. It ends with the methods used to compute GNSS-ZTD in the MetOffice UK..
Chapter 4 - System and Network Infrastructure Preparation In this chapter the preparation
of the Server that olds the product, the internal network changes made, and the virtual-ization infrastructure implemented for a redundant system are described.
Chapter 5 - Near Real Time Data Acquisition The several GNSS data networks and providers is
described. It is detailed and explained the system architecture. It is also explained how the different parts needed to generate the GNSS-PWV are obtained.
Chapter 6 - Data Validation In this chapter an analyses on the networks reliability is made.
The results of several tests made regarding the missing data in a given time window is analysed, as well as the results of the quality testing for this product. Based on the results obtained, some rules are also defined.
Chapter 7 - Conclusions Presents the main conclusions of this dissertation as well as some
Chapter 2
GNSS and Water Vapor
2.1
GNSS Overview
Global Navigation Satellite Systems (GNSS) is the term that refers to all space-based navigation systems. Currently, there are several systems, namely, the Global Positioning System (GPS) from the United States, Russia Global Navigation Satellite System (GLONASS), Europe's Global Navigation Satellite System (Galileo) and China's BuiDou Navigation Satellite System (BDS). These systems have revolutionised the surveying and mapping industry. This technology involves satel-lites, ground reference station infrastructure and user equipment. They can estimate the posi-tions and velocity continually and accurately around the world.[RHH05]
Of the several different systems, GPS is the most known and used. With that in mind, GPS will be the primary focus in this dissertation. The GPS satellite navigation system consists in 24 satellites arranged in 6 orbital planes where each plane contains 4 satellites. Like was men-tioned before, GPS provides to the normal users positioning and velocity information. It was also designed to be able to transfer time between ground stations. The GPS services can be used by an unlimited number of users because GPS receivers only receive data[Kap96].
GPS satellites broadcast navigation data and ranging codes on four different frequencies: L1 (1575.42 MHz), L2/L2C (1227.6 MHz) and L5 (1176 MHz)[gps11]. Each satellite transmit a dif-ferent ranging code. The difdif-ferent ranging codes allows the use of a technique called One-way Time of Arrival (TOA). TOA consists in determining the propagation time of the signal and con-sequently calculate the satellite-to-user range while the navigation data allows each receiver to know the location of each satellite at the transmission signal[Kap96].
It is possible to determine the receiver's three-dimensional location by combining the satellite's location and the TOA ranging measurements. Due to the uncertainty of the time value, four satellites are needed to obtain a position (unless that the receiver is connected to an atomic clock) [Kap96].
2.2
Water Vapor Overview
Water vapor represents a very important role in atmospheric processes that act over a wide range of temporal and spatial scales from climate to micrometeorology[BBH+92]. Several
at-mospheric processes are influenced by the water vapor distribution (e.g., radiation transfer, energy balance, cloud formation/composition and the convective initiation and development of precipitation systems)[BAD05]. It is also the major constituent in the greenhouse effect. Water vapor is the most variable constituent of the atmosphere and is an essential compo-nent of climate and numerical weather prediction because of its relation with the atmosphere
processes[Gue03].
With such an important role scientists aimed to create a series of methods to measure the distribution of water vapor in the atmosphere (i.e., radiosondes, microwave radiometers, spec-trometers, lidar and GNSS which is the method described in this dissertation).
2.3
GNSS Water Vapor Estimation
There are several advantages of GNSS water vapor estimation over other existing methods. The most important ones are, good temporal resolution (down to 5 minutes) and both the fact that can be run unattended and work in all weather conditions[BAD05]. Another important fact is that the number of GNSS stations continues to grow every day, around the world.
GNSS signal suffers several propagation effects, that are referenced in the literature as a signal delay, when passing through the atmosphere.The magnitude of those effects depends on the satellite-receiver elevation angle and the atmospheric environment.[Gue03]
Figure 2.1: Layers of the Earth's atmosphere
Figure 2.1 shows the different atmospheric layers. The delay is mainly due to the ionosphere and troposphere layers, but while the ionospheric delay can be eliminated with Double Difference receivers (because this layer is frequency dependent), the tropospheric layer is not frequency dependent (above 15Mhz), so it can not be eliminated[Gue03].
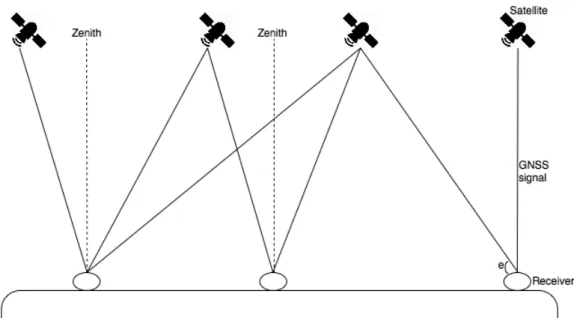
The Zenith Total Delay (ZTD) is defined as the atmospheric delay of a GNSS signal that would arrive from the zenith direction.
Figure 2.2 shows an illustration of the GPS signal, zenith direction and elevation angle (e). ZTD is the sum of two delay effects in the troposphere. Those effects are the Zenith Hydrostatic
Figure 2.2: GPS signal between the satellites and receiver.
Delay (ZHD) and the Zenith Wet Delay (ZWD). The ZHD is the one causing the bigger impact, and it is caused by dry air containing mainly N2 (nitrogen gas) and O2 (oxygen). The ZHD represents a delay of about 2.1 meters at sea level and it varies mainly with the temperature and atmo-spheric pressure. This fact makes it predictable. The ZWD oscillate normally between 1 and 80 centimeters. However, ZWD has a higher spatial and temporal variation than the ZHD making it more difficult to predict[Gue03].
In order to model the tropospheric delay precise GNSS positioning requires an accurate Mapping Function (MF). There are several mapping functions. Along the years the most used were the Niell mapping function[Nie96], the Global Mapping Function[BNTS06], and this last one successor GPT2[LSB+13]. There is however a problem with these functions. They all are based in
clima-tology. That fact makes them have a limited capacity to predict short-term and anomalistic atmosphere behaviour.The Numerical Weather Prediction (NWP) models capture the short-term variability of the atmosphere. This fact makes the NWP be considered as a good data source from mapping functions[Nie01].
At the time of the writing of this dissertation the Vienna Mapping Function 1 (VMF1) is consid-ered as the most accurate available[TBHS07]. What might explain its great accuracy is that it is based on an accurate functional formulation and an accurate underlying atmospheric data source, namely the operational analysis from the integrated forecast system of the European Center of Medium range Wheater forecast[BWS06].
The ZHD can be calculated easily and with great accuracy, using measurements of surface at-mospheric pressure with the following formula[Saa72] [AN87]:
ZHD = 2.2768± 0.0015 P0 f (ϕ, H)
where P0is the surface pressure in millibars, ϕ is the latitude and H is geodetic height in
kilo-metres. ZHD is given in millikilo-metres.
Calculating ZHD and knowing ZTD (which is the value estimated by the GNSS processing) we can calculate the ZWD using the formula:
ZT D = ZHD + ZW D
After the ZWD has been calculated it can be multiplied by the variable∏[AN87] to obtain the quantity of water vapor integrated in the zenith direction (IWV):
IW V =∏.ZW D
where∏is given by:
∏ = 10 6m w (k2− k1mmw d + k3 Tm)R ∗
where Tmis the weighted mean temperature of the atmosphere, mwis the molar mass of water
vapor, md is the molar mass of dry air, R∗ the ideal gas constant, k1, k2 and k3 are physical
constants that are based in part on theory and in part on experimental observations[BBH+92].
According to [BBC+94]:
• k1= 77.60± 0.05K/hP a
• k2= 70.4± 2.2K/hP a
• k3= (3.739± 0.012).105K2/hP a
Bevis et. al in [BBH+92] have derived the following formula:
Tm= 0.72t + 70.2(oK)
2.4
Summary
In this chapter an overview to the GNSS and Water Vapor was presented. It was also shown how the GNSS Water Vapor estimation is calculated. This chapter was widely influenced from chapter 5 of [Ben13].
Chapter 3
State of the Art
3.1
GNSS Processing
3.1.1
Processing Methods
There are two methods for processing GNSS raw data, Precise Point Positioning (PPP) and Double Difference (DD), which will be discussed in the following subsections.
3.1.1.1 Double Difference
Double Difference, differently from PPP, is a network processing approach. The idea is to form baselines between GNSS stations, with this method it is possible to eliminate the clock errors. Double Difference results of the combination of two other methods:
Between-Receivers Single Difference: In this technique there are two GNSS receivers
observ-ing the same satellite at the exact same time. This method provides better positions esti-mates by subtracting each receiver observations equation from the other because common error sources are cancelled out when the difference is taken.[SD14]
Between-Satellites Single Difference: In this case the idea is to have just one receiver
ob-serving two satellites. What is subtracted here is the code and/or phase measurement of one satellite from the other. The data obtained in this method eliminates the receiver clock error (since there is only one). This method does not provide a better position estimate.[SD14]
With the combination of both methods the benefits of both are acquired, the improvement of position estimates gained through the Between-Receivers Single Difference method and the clock error suppression obtained from the Between-Satellites Single Difference method. Not just the receiver clock error is eliminated, but also the satellite.[SD14]
3.1.1.2 Precise Point Positioning
PPP is a method for performing precise position determination using a single GNSS receiver. This positioning technique is based on the fact that precise GNSS orbit and clock data products, with centimeter accuracy, have been widely disseminated in recent years. That data can be used to reduce drastically the errors in the GNSS satellite orbits and clocks. Those are two of the biggest error sources in GNSS positioning.[Gao06]
If a dual-frequency GNSS receiver is combined with satellite clocks and precise positions, PPP will be able to provide solutions with an accuracy of centimeter. That fact might be appealing to several applications. Unlike double-difference positioning that requires observations from at
least one base station with known coordinates and will be discussed in the next subsection, PPP does not require such observations from a base station. PPP is distinguished from the conven-tional point positioning techniques, because of the precise part. The other ones only use code or phase-smoothed code as the principal observable for position determination.[Gao06] There are a few advantages of choosing the PPP technique over the differential precise posi-tioning techniques:[Gao06]
1. The fact that PPP only requires one GNSS receiver means that establishing a base station is not necessary. This eliminates the constraint of simultaneous observations as well as the operating range limit, on both rover and base receivers imposed by the differential RTK technique.
2. Other great benefit, when compared to the differential approach, is the reduced equip-ment cost, and labor, because the use of base station(s) is not necessary.
3. PPP can also be applied in other fields, since PPP needs to estimate receiver clock and tropospheric effect parameters, it provides a new way for precise time transfer and water vapor estimation using only one GNSS receiver.
A downside about this approach is that if there is an error in the clock of the GPS satellite, that error will propagate in a larger position error at every station.
3.1.2
Processing Software
There are several softwares for GNSS data processing. There are different types of licensing and different feature in them. In this section it can be found a slight overview about them. First of all we take a look at the licensing type of all the softwares:
Software Type of Software Licence Details
RTKLIB Open-Source BSD 2-clause license
GPSTk Open-Source GNU LGPL
BERNESE Commercial
RTNet Commercial
GAMIT
Commercial with Free Licence for Universities and non-commercial uses GIPSY-OASIS
Commercial with Free Licence for Universities and non-commercial uses
Table 3.1: Types of Software and Licencing
A more detailed analysis on these software options are taken in Appendix A.
3.1.2.1 GIPSY-OASIS
GIPSY-OASIS, is the GNSS-Inferred Positioning System and Orbit Analysis Simulation Software package. GIPSY is developed by the Jet Propulsion Laboratory (JPL), and maintained by the
Near Earth Tracking Applications and Systems groups. Its main characteristics are[gip]:
Analysis of data from Global Navigation and Satellite Systems: GPS, GLONASS, DORIS, SLR; Precise centimeter-level GNSS-based positioning and timing: Space platforms, including
low-Earth orbiters and GNSS constellations, Airplanes, Terrestrial (ground) stations, static or moving and Time transfer;
Single-receiver ambiguity resolution: using JPL's GPS orbit and clock products;
Terrestrial positioning for geophysical research: Earth deformation, plate tectonics, GNSS
Net-works, Ice flow, Climate studies through observation of troposphere and ionosphere, Ref-erence frame (geocenter and scale) and Earth rotation parameters;
Airplane positioning
Precise orbit determination: Low-Earth orbiters: Topex/Poseidon, Jason-1, Jason-2/OSTM,
GR-ACE, Champ, SAC-C, COSMIC, Space Shuttle (e.g. SRTM), Commercial Satellites; GNSS constellations including GPS and GLONASS.
3.1.3
Method and Software Used in the Dissertation
With the descriptions above, regarding the different software solutions, it is easy to conclude that all of them would be able to perform the necessary tasks for this specific project. However the learning curve of these software and their basics, are big. It normally takes a few months just to learn the basics in each and every one of them.
So with these problems, it was established, at the start of the project that the software used would be the GIPSY-OASIS. The reason, is that the SEGAL team, and mostly Prof. Rui Fernandes, have been working with GIPSY for over 10 years. This sure helped keeping the project on time. Since GIPSY-OASIS was used, the Processing Method was the PPP, since it is the only one used by GIPSY.
3.2
Satellite Orbits
One of the most important components for every GNSS based processing are the Orbits of the satellites. There are two providers of orbit observations the Jet Propulsion Lab (JPL) of NASA[jpl], and the International GNSS Service (IGS)[igs].
Both of the providers make Orbit files available in three types:
1. Final - These are the most precise orbit files. They have an accuracy of 2,5cm and are available with a delay of 14 days;
2. Rapid - The Rapid orbits have the second place in terms of precision. They have an accuracy of 3,5cm and are available much sooner than the Final ones, with a delay of just 1 day; 3. Ultra-Rapid - The Ultra-Rapid orbits are a different case. Depending on the provider (JPL
3.2.1
Ultra-Rapid
The Ultra-Rapid orbits are the ones used for this research since they are faster ones (excluding streams) available and we are interested in near real-time water vapor estimation. However, there are two options for these kind of orbits.
The IGS Ultra-Rapid orbits files contain a 48 hours window, the first half (24 hours) is based on observations and the second half are predicted. These files are updated four times a day (03:00, 09:00,15:00 and 21:00 UTC time). When the file is made available they contain six hours in the future (i.e. the file of 03:00 contains orbits (predicted) corresponding to 09:00 of the same day)[igs].
Differently from the IGS Ultra-Rapid orbits, the JPL ones completely based in observations. They contain a 30 hour window with an accuracy of 5cm. Since these are observation they have a delay, in this case of 2 hours and are updated every hour[jpl].
After knowing both possible solutions, it can be observed that the choice was between a more accurate one (the JPL since is based in observations), or a faster one (IGS file has predictions in the future). By now the ideal would be to test with both options and see how much unreliable the IGS predictions would be. However a problem was encountered. GIPSY can use both Final and Rapid orbits form IGS, but it cannot use the Ultra-Rapid ones. What causes this is that GIPSY needs not only the file with the orbits but also a file with the clocks of the satellites. By the time the Rapid and Final orbits are available those clocks are available and so GIPSY can get them and use the IGS orbits. Since the IGS Ultra-Rapid orbits are predicted the same method cannot be applied. So it is here established that for this product the Orbits used are the JPL Ultra-Rapid, and that based on that the solutions generated will have a two hour delay.
3.2.2
Stream
Another possible choice would be to collect the GPS satellite data streams. There are different providers making these available. Some software (like BERNESE) can use these streams input instead of the orbit files and therefore have a fast and reliable(since it is made based on obser-vations) solution for the Real Time products. Unfortunately by the time that this dissertation was written GIPSY (since it only uses the PPP technique) was not capable of using these streams, because the lack of the required Clock corrections.
3.3
Pressure & Temperature
Pressure and Temperature values are necessary variables to convert the ZTD in PWV. The ideal solution, would be that the GNSS stations would be fitted with high precision Temperature and Pressure sensors so that the values used in the conversion would be the most accurate as possi-ble. Since our GNSS data providers did not have their stations fitted with these kind of sensors, and since it would be too expensive to acquire them in the scope of this project (it would cost around 2000€ for each station) it was decided to use Pressure and Temperature predictions from
Numerical Weather Prediction Models.
IPMA, since they already use these models, were responsible for providing them. They suggested two models:
AROME: It is a non hydrostatic numerical prediction model of high resolution in time and
re-garding a delimited area. It has been developed and maintained by Météo-France. The AROME is executed locally at IPMA with a vertical resolution of 46 levels and a horizontal resolution of 2.5Km[ipm15a].
ECMWF: it is a global model, meaning that it perform a worldwide prediction. The deterministic
version is executed with a maximum reach of 10 days. It has a vertical resolution of 137 levels and a horizontal resolution of 16Km[ipm15b].
After a set of preliminary tests conducted at IPMA they decided it would be best to use the ECMWF models. In [KIA+12] is an example case study that also supports that ECMWF provides
better results (in most cases) when compared with AROME.
3.4
Water Vapor by other methods
PWV have been being estimated for years, by different methods. In this section it will be taken an overview over the different methods available regarding those methods. There are more methods than the ones presented, but we will take only a look on the ones used at IPMA.
3.4.1
Radiosonde
The idea of the radiosonde is to connect an electronic equipment to a weather balloon, nor-mally of 600gr, filed with helium and launch it. This equipment is equipped with high precision sensors that measure the atmospheric pressure, temperature and the relative humidity of the air and wind in the vertical atmosphere. It is also equipped with a radio transmitter, that sends the data measured by the sensors to the base[ipm15d].
The information obtained can be seen in real time, or stored for studies in the future. Also the data obtained is used to[ipm15d]:
Initialization of the Numerical Weather Prediction Models;
Local prediction of the stability of the atmosphere and the distribution of the Water Vapor; Studies regarding the atmospheric pollution;
Prediction of the effects of the atmospheric refraction in the propagation of the electromag-netic radiation and of wave sounds;
Studies of the ballistic precision and reach, by calculating the density of the air for a given pressure;
In Portugal there are three sites where these kind of equipment is launched[ipm15d]: 1. Lisbon;
2. Funchal, Madeira; 3. Lajes, Azores.
Compared with the GNSS solution its main downsides are the spatial coverage, and the fact that they are expensive. In fact only three a day are launched. In Figure 3.1 is an image of a weather balloon carrying a radiosonde.
Figure 3.1: Weather balloon carrying a radiosonde.
3.4.2
Satellite Image
Since the beginning of the firsts satellites launches, it was possible to verify that the observation of the Earth could help, a lot, the Meteorological field. The first satellite completely dedicated to meteorology was launched by the United States in 1960.
Based on its orbit there are two kinds of satellites. The first are the Geostationary Earth Orbit (GEO). They are positioned in the equatorial plan at about 42000Km of height based on the center of the earth. Their orbit is calculated so they can have a velocity equal to the angular velocity of the rotation of the Earth, making so that the satellite always observe the same area. The Meteosat satellites from the EUMETSAT (www.eumetsat.int) are in this category. In the EUMETSAT website it is possible to view, images from the Meteosat9 with a temporal resolution of 30 minutes. Those images are available in two types[ipm15e]:
• Visible Chanel, with a spatial resolution of 1Km (figure 3.2); • Infrared Chanel, with a spatial resolution of 3Km (figure 3.3).
The second kind of satellites are the Low Earth Orbit (LEO). The orbits for these ones is almost vertical to the poles, and they are locate below 1000Km of height, and provide spatial resolutions of 1.1Km. They make 2 world tours a day, making two passages on the same site every day. Like the GEO satellites they can provide Visible and Infrared images[ipm15e].
Figure 3.2: Example of a visible Satellite image of the atlantic ocean.
Figure 3.3: Example of an Infrared Satellite image of the Iberian Peninsula.
3.4.3
Numerical Weather Prediction Models
NWP models have a very important role in weather forecasting. NWP is present as a resource in most of the meteorological services in the world. NWP resorts to computer calculations to produce estimates of future states of the atmosphere, using prediction models.
Based on the prediction model, a prediction can be obtained initializing the NWP with some variables (that can be obtained with a radiosonde), temperature, pressure, wind and humidity.
The inherent uncertainties regarding the knowledge of the state of the atmosphere at a certain time, influence the quality of these methods. Those uncertainties and the use of observations irregularly distributed over the globe are some of the error factors that are both introduced in the analysis.
A team started this activity, at IPMA, in 1993. Portugal (by IPMA) is a member of the Euro-pean Center for Medium-range Weather Forecasts and a partner in the ALADIN project. Cur-rently at IPMA there are three NWP methods used in the weather forecasts, ALADIN, ECMEF and AROME[ipm15c].
Figure 3.4: Orography based on ALADIN.
Figure 3.5: Orography based on AROME.
Figure 3.6: Orography based on ECMWF.
3.4.4
NESDIS Blended Total Precipitable Water
Another product at use in IPMA is the NESDIS blended Total Precipitable Water (TPW). This product is derived from multiple sensors and satellites. These products are merged from both, Low Earth Orbit, and Geostationary satellites. The blended methodology provides global cov-erage with no gaps that allow the analysis of atmospheric moisture over land and ocean. These products have a 16Km resolution over the equator. In terms of products, they have a 16Km resolution, are centered at the equator and 160 degrees West. It has 1437 lines and 2500 ele-ments, which covers the earth from about 71 degrees North to 71 degrees South. The products are available on an hourly basis[nes16].
Figure 3.7: Example of an image of the NESDIS project.
3.5
Use Cases around the world
3.5.1
European Project
In 1971 it was created an European intergovernmental framework for cooperation in science and technology. This organization goes by the name Co-operation in the Field of Scientific and Technical Research (COST), and aims for the cooperation between scientific fields, and country cooperation.
In 1998 COST, launched a project (COST Action 716) with the name ‘Exploitation of ground-based GPS for Operational Numerical Weather Prediction and Climate Applications’. This project aimed to connect the fields of meteorology and geodesy, in a way to operationalise, and test, the use of ground-based GPS for meteorological applications. The idea was that the GPS stations would provide near real-time observations to be assimilated in the numerical weather predic-tion. The project ended in 2004 and the result were positive, since the test indicated that ZTD based on ground based GPS had a good accuracy[exp11].
In 2005, a programme called EUMETNET (Network of European Meteorological Services) EIG GNSS water vapour program (E-GVAP) started with the goal of providing its members with ZTD and Water Vapor (WV) estimates in near real-time. How is this achieved? The GNSS data is collected for several of GNSS analysis centers. These centers process that data and forward the obtained ZTDs to E-GVAP dataserver. In this dataserver the ZTDs go through a process of validation, and then are forward to the Meteorological institutes[COS].
3.5.2
METEOOFFICE - United Kingdom
Dr. Jonathan Jones, from Meteo Office - UK, was a member (external consultant) of the the NUVEM project. He provided vital help in some phases of the implementation. In this section a look at the METEOOFFICE - UK ZTD/PWV products will take place. This analysis is based within the testimonial, and PhD. Thesis of Dr. Jonathan Jones.
METEOOFFICE - UK, started in this field in 2002. A partnership with the Institute of Engineering, Surveying and Space Geodesy (IESSG) at the University of Nottingham was made, to develop an automated processing system managed by Met Office staff. This was the first system
imple-mented at the METEOOFFICE - UK, and was given the name of METO. This system was moved from "development" to "production" in 2007. Since the beginning of the METO project tests, regarding the assimilation of the ZTDs in the Numerical Weather Prediction (NWP) models have been performed. Those tests shown that assimilating the ZTDs, in almost all cases have a neu-tral or positive impact. The reduction of the standard deviation, of the humidity model reached 4% in the several cases.[Jon10]
Since then the METEOOFFICE - UK have implemented three different systems for ZTD assimila-tion in NWP.
3.5.2.1 METO & METG
The METO and METG system, are basically the same system with just some minor twists. The biggest difference is that the METO concerns to an Europe based network. The METG concerns to a global network. The idea of these systems is to obtain hourly GNSS files from several FTP (File Transfer Protocol) servers and then process these files.
In terms of the processing, there is another difference to the systems. In the METO the system waits 20 minutes (time for it to collect the GNSS files) before starting to process them, in the METG, this delay is of 40 minutes. The METO processing takes around 20 minutes, and the METG takes around 10 minutes (thought it concerns to the whole world it has fewer stations). So the METO ZTDs are ready for assimilation at around HH:40 and the METG ZTDs at HH:50.
Figure 3.8: METO system processing data flow.
In Figure 3.8 it can be observed the METO system processing data flow. This Figure was taken from the PhD. thesis of Dr. Jonathan Jones.[Jon10]
3.5.2.2 METR
Then there is the METR system, that has a completely different approach. In this system the idea is to collect Real Time data streams from the GNSS stations. This data is streamed via the
NTRIP protocol, and collected with a BNC client. After collecting that data, GNSS files contain-ing 15 minutes are written (4 files per hour). The processcontain-ing of these files start after 2 minutes (of the 15 minute interval) and the process takes around another 2 minutes. So the average delay for this product is 19 minutes. It is also worth mentioning that this system only concerns to a UK network. And all three systems are process using the Double Difference technique and the BERNESE software.
3.6
Summary
During this chapter an overview on the several components necessary to calculate GNSS-PWV was made. It was also made a description on other methods to obtain Water Vapor estimations used at IPMA. Finally an analyses on the use of both Europe (through E-GVAP) and in the United Kingdom, of these kind of products was conducted.
Chapter 4
System and Network Infrastructure Preparation
A server was acquired at the beginning of the NUVEM project to be fully dedicated to the NUVEM tasks. This server (called meteo) was installed as part of the SEGAL computational infrastruc-ture. After the development of the project, this server will be responsible for the operational part of NUVEM.After the system was made ready, and already some tests were being made, a hardware mal-function stopped it for a few days. At this point it was decided that, once in production, this should not happen again and it was decided to rearrange SEGAL infrastructure. In this section we will take a look at the changes made, and how the new implementation makes the whole system more reliable.
4.1
SEGAL Infrastructure
SEGAL has a set of 6 Physical Servers, 2 Network Attached Storage Disks (NAS), and 2 Uninter-ruptible Power Supply (UPS). For the project only the Server bought specifically to the NUVEM project, and one of the SEGAL public server(geodac) were necessary.
Figure 4.1 shows the old disposition of SEGAL's servers (only the elements marked by name where important to this project).
4.2
Virtualization
Two possible solutions were considered after the analysis of the problem. The first one con-sisted in having a new server and have a duplicated system at all times. This would imply to buy an additional new server (preferably an exact one like the one already in use). Apart from the cost of the new server, the biggest problem, was the waste of resources, since this clone server would be in idle state unless the first one had some kind of malfunction. Besides the fact that it is difficult to have a complete clone all the time (it always take some times to clone all the new data), it is also costly in terms of bandwidth consumption.
The second option was to implement for a virtualization infrastructure. With the resources already available at SEGAL, it would be possible to do it without extra cost. In addition, the virtualization it would make it possible to take maximum advantages of the servers hardware since one server can support multiple Virtual Machines. So at the moment, in terms of costs this seemed the better solution.
4.2.1
Virtualization Approach
In terms of virtualization, there are several implementation approaches to choose from. The more known and "simple" implementation of virtualization, is the capability of one physical machine to run several Virtual Machines. This is a great advantage in terms of hardware op-timization. However, by itself this would not provide the solution for our problem, in fact it could make it worst, because if one physical server died, several servers would stop functioning instead of one. A possible remedy for this would be to have two virtualization servers and have a clone of the Virtual Machine. This may seem a little bit similar to the approach of having two physical servers, but it could save SEGAL the money on a new server, because it would be possible to migrate several of the physical servers to virtual machines, and then reuse the free hardware to hold the new virtual machines. There would still have the problem of the need for synchronization of the Virtual Machines between the servers.
Although the scenery described above was a better solution than having a cloned physical server, in the last few years, virtualization techniques have been evolving, and there is a new approach that would not just provide the solution for the problem at end, but also optimize the use of the available resources. This solution has several names, depending on the virtualization provider, but the selected provider (Oracle) uses the name of Server Pooling [pol15]. The idea is actually quite simple. One only requires two or more physical servers and a NAS or a Storage Area Net-work (SAN) so that the Virtual Machines would be stored on this shareable netNet-work drives. The system consists on having the Virtual Machines stored in the network storage and then then the pool servers access this storage to run the different Virtual Machines. This solves the problem of the synchronization because if we have two servers (A and B) and our Virtual Machine is running in server A and that server stops working, the Virtual Machine could run on server B, and no data would be lost because the storage is not in the server that just died. Not just that, in
a Server Pool the management of the available resources is made by the system, meaning if Virtual Machine A is running in Server A and that server dies, it would pass to server B without the need of any interference from the SysAdmin.
But there are also some disadvantages. This approach makes the systems a little bit slower (mainly because it is slower to have the storage in the network than having an Hard Disk in the server), and in a more detailed observation of the available resources at SEGAL, it would mean that the storage in the servers used in the Server Pool would stop being used, since that with this approach, the only thing that can be in the internal Hard Drives is the Operating System. Balancing all advantages and disadvantages, server pooling was the chosen approach that was implemented. Figure 4.2 shows an example of implementation of a server pool implementation.
4.3
Virtualization Hosts
There exist several virtualization software packages. The characteristics of the main ones are discussed in this section.
4.3.1
VMWare
The first provider that was identified was VMWare. VMWare is the market leader in terms of virtualization. A lot of the technologies and features in terms of virtualization were developed by VMWare.
The VMWare has several products, almost all of them with paid licenses licences. The exception is the VMWare ESXi suite. The problem with the VMWare ESXi suite is that it only offers simple features, and not the ones described before. Therefore, and since the cost of the paid products were too high for SEGAL, VMWare was ruled out.
4.3.2
Microsoft Hyper-V
Another provider is Microsoft's Hyper-V which is used by University of Beira Interior Informatics and has all the necessary features. Another advantage of the Microsoft Hyper-V was the exist-ing experience at UBI. The learnexist-ing curve, and implementation phase, would have been a lot simpler. The problem once again was the licensing, even though it was a lot cheaper than the VMWare solution it was still more than SEGAL, or the project could cover so this option was also ruled out.
4.3.3
Oracle VM
Between several products available, the Oracle Virtual Machine Server (OVMS), was what we needed. It has all the features desired, it is free (paid support) and another advantage it is a Linux System, so it would be simpler, since all the servers in SEGAL are Linux based.
Apart from that, the Oracle VM community is very big and active, and the oracle documenta-tion is very good. This made all the learning on the system really easy. The biggest drawback encountered so far, is that since this is the free version, some bugs take sometime to be solved (in the paid version it only takes a few days, normally, to have these fixes available).
4.4
Oracle VM - Implementation
It was necessary to have the necessary hardware prepared. So, a computer was prepared with Oracle Linux 7 where the Oracle Virtual Machine Manager (OVMM) was installed (any computer with 8Gb of RAM and a x64 bit CPU is eligible for this). A Server (at first we started with only one server, and as long as the migrations started the other ones were added to the server pool)
with the OVMS, and finally creating a Network File System (NFS) share in one of SEGAL's NAS. Once all the requirements were met was time to follow the procedures, once again, very well documented by Oracle, and create the Server Pool[cre11]. When this was accomplished suc-cessfully the migrations could start. As a note, the whole system is then managed via the OVMM (a web interface that can be seen in Figure 4.3).
Figure 4.3: Overview of the OVMM web interface
4.4.1
Migration
After the virtualization system started to run, it was time to convert the "old" machines into Virtual Machines (VMs). The first idea was to create clean VMs, and then reinstall and recon-figure that VMs accordingly to the systems they were supposed to replace. Although this might be the best solution, it is not the faster/easier one. Data loss may occur, or even some config-urations/services lost during the process, and it would also took a lot more time to reconfigure and reinstall everything.
However, OVMS has a tool dedicated to do the migration. And in a few steps (and some hours later) any "traditional" system can be converted in a VM[con11].
The steps for migrating a physical server to a VM are as follows:
1. Inserting the Oracle VM Server CD in the desired server, and start it by that CD; 2. When the system reaches the boot menu, type "p2v";
3. Then it is given a menu to insert Network details, this should be in the same network as the Oracle VM Server;
4. Then is logical disk(e.g., partitions, apart from the partition that holds the operating system, the user can only choose the desired ones) selection (you can choose all, but if
there is any not necessary you can discard it);
5. After a new menu prompting for the Virtual Machine you want to create for this server (VM Name, Virtual CPUs, Memory and password);
6. Finally go to the OVMM platform, select "import from template" and in the field "Template URLs" it should be entered "https://defined_ip/System-sda.img" "https://defined_ip/vm.cfg";
7. This takes some time, and when it is finished a new VM will be available in the OVMM platform.
This tool takes care of the biggest preoccupations, like file system conversion, or VM configura-tion files without the need to do anything else then the steps described above.
4.5
Redundancy
So the new adopted infrastructure guarantees the redundancy in terms of servers, preventing that the death of a single server implies the death of the services maintained by it. But there was still a flaw ( a big one ) in this system. All the storage was saved in one NAS, so if that NAS died, all the services maintained by VMs, would be lost.
To solve this, it was necessary to rearrange both NAS, and then making one NAS the clone of the other. The clone is updated daily, in terms of data it would be better to have a shorter window, however that would cost much in terms of internal band-witch and it would also slow down both NAS (since it were some more operations running all the time), and so a compromise was made, that a day of lost data can be recovered if necessary without too much work.
4.6
New Virtualized Infrastructure
Figure 4.4: SEGAL new arrangement
4.6.1
Hardware description
4.6.1.1 NAS
The NAS have four Hard Drives mounted and were set to a RAID5 configuration. RAID5 is a con-figuration where one of the HD is configured as a spare. In case of failure in one of the active drives the spare drive takes its place. An illustration on RAID5 can be seen in Figure 4.5.
Regarding the NAS hardware:
Figure 4.6: NAS System QNAP TS-420U
Make/Model: QNAP TS-420U (Figure 4.6) CPU: Marvell - 1.6GHz
Memory: 1Gb
Hard Drives: 4x 4TB Sata
4.6.1.2 Servers
All of the servers involved have a RAID 1 configuration. With the RAID 1 configuration it is en-sured that a failure in one of the two Hard Drives will not collapse the whole server.
As can be observed in Figure 4.7 RAID1 is a complete mirror of an Hard Drive to another.
Oracle VM Server 1:
Figure 4.8: Oracle VM Server 1: Dell PowerEdge R820
Make/Model: Dell PowerEdge R820 (Figure 4.8) CPU: 4x Intel Xeon E5-4607 - 2.6GHz
Memory: 64Gb
Hard Drives: 2x 1TB SAS Oracle VM Server 2:
Figure 4.9: Oracle VM Server 2: HP ML360 G8
Make/Model: HP ML360 G8 (Figure 4.9) CPU: Intel Xeon E5-2420 - 1.90GHz Memory: 8Gb
Hard Drives: 2x 2TB Sata Oracle VM Server 3:
Figure 4.10: Oracle VM Server 1: HP ML380 G6
Make/Model: HP ML380 G6 (Figure 4.10) CPU: Intel Xeon E5506 - 2.13GHz
Memory: 8Gb
4.6.1.3 UPS
In terms of hardware involved the only thing missing is the UPS. They are set in parallel con-figuration, meaning that in case of power loss, the first UPS (lets call it UPS1) starts to provide power to the servers, when that ups is empty, the second UPS (lets call it UPS2) takes its place. It was also configured in one of our server the APC software, that helps to identify when the UPS reaches a certain threshold. Based on that threshold a script was made to shutdown our servers, preventing them from having an abrupt power loss, that can harm them.
UPS1:
Figure 4.11: UPS1: Riello Vision Dual
Make/Model: Riello Vision Dual (Figure 4.11) Power: 2200Va
UPS2:
Figure 4.12: UPS2: APC SmartUps
Make/Model: APC SmartUps (Figure 4.12) Power: 2200Va
4.7
Operating System
Another decision that needed to be made was the choice of operating system of the Virtual Machine that would be used during the development and operationalization of the product. It was set at start that it need it to be a Linux based system. This was mainly because all SEGAL infrastructure is based on Linux systems. But now there were several options. From the most popular Linux Mint and Ubuntu to the more enterprise ones CentOS and RedHat.
The option taken was the CentOS, since it is an open-source clone of the RedHat and that it gives as more support in terms of RAID and that all the packages are very well tested before released for public, and are only released if don't interfere with other functions/packages (e.g.
the official php version in centos 6 is PHP 5.3 that is dated from 2010[Gro01]).
4.7.1
Users
With the Operating System set, it was needed to define the internal structure of the system. First of all were defined the users and their functions:
gpsdata: This user is responsible for collecting all the data for the product. It fetches the GNSS
data of the stations from GNSS networks, the Orbits from the JPL servers and the Pressure and Temperature files from SEGAL public server that are uploaded there by IPMA. It also handles a set of secondary functions related with the data collection, like creating log files of the missing that, and the arrival times of the ones successfully collected, that later help perform stats about the system.
realtime: It is the user responsible for generating the processing of the data collected. All the
operations that use the GIPSY-OASIS software are performed by this user. It also uses the resultant ZTD of GIPSY and calculate the final product GNSS-PWV.
4.7.2
Folder Structure
Having both the Operating System and the user structure defined, what was left to define was the internal folder structure which largely follows the existing structure for GNSS data that is stored at SEGAL.
Figure 4.13: Folder structure for the Pressure and Temperature files
In Figure 4.13 it can be observed the folder structure regarding the Pressure and Temperature files where:
"/uib" Stands for the the folder that stores ALL data in the system is located;
"/METEO" Stands for meteorology and it was decided that all meteorological files would be put
here;
"/ECMW" Identifies the type of files inside that folder (in this case ECMWF files with pressure
and temperature);
"/YEAR" Complete year that prevents data from being replaced, it also makes easy to find old