www.scielo.br/rbg
HYDRODYNAMICS OF THE ITAPOCU RIVER AND
THE BARRA VELHA LAGOON ESTUARINE SYSTEM, SC, BRAZIL
Cl´audia Franc¸a de Abreu
1, Eduardo Siegle
2, Eliane C. Truccolo
3and Carlos Augusto Franc¸a Schettini
4Recebido em 6 marc¸o, 2009 / Aceito em 18 maio, 2010 Received on March 6, 2009 / Accepted on May 18, 2010
ABSTRACT.A hydrodynamic characterization of the Itapocu river and Barra Velha lagoon estuarine system was carried out with the objective of evaluating how the current regime in this area is affected by astronomical and meteorological tides and the river discharge. Meteorological, water level and current velocity and direction data were gathered hourly during a twenty-day period, from 22-July until 10-August, 2004. Current meters were positioned at the inlet, at the entrance of the north and south lagoons and at the lower estuary of the river along with a tide gauge. The estuarine system showed distinct current behavior among the different sectors within the estuary, responding to the different forcings. The strongest currents were observed at the inlet while the weakest values were observed at the northern lagoon, a location that showed little dynamic. The general flow was ebb-dominated flux, in response to fluvial discharge, even during local wind water set-up event.
Keywords: circulation, hydrography, river discharge, tides, estuary.
RESUMO.Uma caracterizac¸˜ao hidrodinˆamica do sistema estuarino do rio Itapocu e Lagoa de Barra Velha foi realizada com objetivo de avaliar como o regime de correntes ´e afetado pela mar´e astronˆomica e meteorol´ogica, e pela descarga fluvial. Dados meteorol´ogicos, n´ıvel da ´agua e correntes foram registrados em intervalos hor´arios durante um per´ıodo de vinte dias, entre 22 de julho at´e 10 de agosto de 2004. Os corrent´ografos foram posicionados na desembocadura, nas conex˜oes do estu´ario com as lagoas norte e sul, e no baixo estu´ario, juntamente com um mar´egrafo. O sistema estuarino apresentou comportamento de correntes diferenciado entre as diversas localizac¸˜oes, em resposta `as diferentes forc¸antes. As correntes mais intensas foram registradas na desembocadura, e as mais fracas na lagoa norte, local que apresentou uma hidrodinˆamica muito reduzida. O escoamento apresentou fluxo residual de vazante, em resposta `a descarga fluvial, mesmo durante eventos de subida do n´ıvel do mar causados pelo vento.
Palavras-chave: circulac¸˜ao, hidrografia, descarga fluvial, mar´e, estu´ario.
1Coastal and Marine Engineering and Management, Civil Engineering Department, Delft University of Technology, CoMEM/TU Delft. Stevinweg 1, 2628 CN, Delft, The Netherlands – E-mail: [email protected]
2Instituto Oceanogr´afico, Universidade de S˜ao Paulo – IO/USP, Prac¸a do Oceanogr´afico, 191, Cidade Universit´aria, 05508-120 S˜ao Paulo, SP, Brazil – E-mail: [email protected]
3Programa de P´os-Graduac¸˜ao em Geociˆencias, Universidade Federal do Rio Grande do Sul – PPGGeo/UFRGS, C.P. 15001, 91509-900 Porto Alegre, RS, Brazil – E-mail: [email protected]
322
HYDRODYNAMICS OF THE ITAPOCU ESTUARINE SYSTEM, SC, BRAZILINTRODUCTION
Our ability to predict future changes in estuarine systems de-pends on an integrated understanding of hydrological and phys-ical-dynamical processes (Kjerfve, 1986). For these reasons and keeping in mind that industrial complexes, fishing communities and cities often border coastal water bodies, the purpose of this paper is to characterize the hydrodynamic of the lower Itapocu estuary and Barra Velha coastal lagoon (Fig. 1) and to evaluate how the current regime is affected by the astronomical tide, river discharge and wind set-up forcing.
The Itapocu river and Barra Velha coastal lagoon estuarine system is located in the northern coast of Santa Catarina State, Brazil, between the coordinates of 26◦31′56′′S and 48◦38′41′′W
and 26◦37′56′′S and 48◦48′51′′W (Fig. 1). The regional mean
annual value of temperature and precipitation are 20◦C and
1500 mm, respectively. The mean fluvial discharge of Itapocu river is 77 m3.s−1 (Schettini & Carvalho, 1998); its drainage basin occupies an area of 2930 km2(Gaplan, 1986). The river is formed near the city of Corup´a by the confluence of a few ri-vers, such as the Novo river and Vermelho river, and drains out between the cities of Araquari and Barra Velha (SC).
Dionne’s (1963) definition of estuary is used in this study in order to characterize the section of this estuarine system to be analyzed. Therefore, the section of the estuary studied in this sys-tem is the lower estuary of the Itapocu river and also the Barra Velha coastal lagoon, which is considered as part of the estua-rine system.
The Itapocu estuary (Fig. 1) is a river dominated estuary and has been classified as a highly stratified system (Schettini et al., 1996; Schettini & Carvalho, 1998), according to Hansen & Rattray’s (1966) classification (e.g. Miranda et al., 2002). Even though this estuary is strongly influenced by fluvial discharge, during low discharge periods the tide plays a relevant role. The local tidal regime is micro-tidal (<2 m), mixed with
predomi-nance of semi-diurnal oscillations. The tide form number is 0.4, mean tidal range is of 0.8 m, ranging between 0.3 to 1.2 m during neap and spring tidal periods, respectively (Schettini, 2002).
The Barra Velha lagoon (Fig. 1) is a coastal lagoon orien-ted parallel to the coast being separaorien-ted from the sea by a narrow sand barrier extending for approximately 12 km along the coast. According to Kjerfve (1986) coastal lagoons are common land-forms along the borders of most continents. They have restricted connections to the ocean, are poorly flushed and exhibit higher residence times. The Barra Velha coastal lagoon has only one in-let that is never closed compin-letely due to the influence of Itapocu river discharge and tidal currents which generate strong enough flows that keep the channel open. The lagoon is approximately
2 m deep and 200 m wide.
The main aim of this study is to evaluate the hydrodynamic regime of the lower estuary of the Itapocu river and the Barra Velha coastal lagoon. The objectives are to verify the energy dis-tribution in terms of tidal and sub-tidal frequencies and to evalu-ate the responses of the currents to the tides, river discharge and meteorological tide.
MATERIAL AND METHODS
The dataset used in this study was recorded in a campaign that took place between 22-July and 10-August, 2004 in the Itapocu estuarine system as a part of the “Morphodynamic and Sediment Transport in an Estuarine Inlet System – CANAIS” project. In this campaign, current speed and direction, water level, salinity, tem-perature and meteorological data were gathered. The sampling period covered a complete neap-spring-neap tidal cycle lasting 20 days.
Meteorological data were recorded by a DavisTM
meteorolo-gical station (#MS, Fig. 1) installed during the campaign. Meteo-rological data consisted of air temperature, humidity, wind speed and direction and barometric pressure, recorded at 30-minute in-tervals. Water level data was recorded by a RBRTMpressure tide
gauge (#TG, Fig. 1), at 30-minute intervals, time averaging over 2 minutes at 2 Hz. Currents were monitored in four different stations in the lower estuary, which were located in the inlet (#I), in the lower estuarine channel (#E), in the intersection between the estuary and South Lagoon (#SL) and in the intersection between the estuary and the North Lagoon (#NL; Fig. 1). The depth at #I was of the order of 7 m and 2 m for the other 3 sta-tions. At each station an acoustic current meter, model 2D-ACM by FalmouthTM, was moored leveled at 1 m below the surface,
recording at 30-minute intervals, time averaging over 2 minutes at 2 Hz.
Daily values of water discharge data were obtained from the Environmental Resources and Hydrometeorology Informa-tion Centre – CIRAM/Agribusiness Research and Rural Extension Company of Santa Catarina – EPAGRI for the gauge station of n. 82350000. This station is located on the Jaragu´a river, with catchment area of 302 km2, which corresponds to 27% of the basin. The distance between the hydrologic station and the estu-arine inlet is of 68 km, approximately.
Figure 1– Location of the Itapocu river estuary and the Barra Velha lagoon. In detail is the study area with the location of the stations: Station #I – Inlet; Station #E – Lower Estuary; Station #SL – South Lagoon; Station #NL – North Lagoon; Station #TG – Tide Gauge; Station #MS – Meteorological Station.
Current direction was firstly corrected subtracting the mag-netic declination (19◦for 2004) and plotted on polar diagrams in
order to identify the main flow axis for each station. The decompo-sition of ebb/flood currents was performed in relation to the main axis based on complementary sectors, disregarding the effects of secondary circulation. The narrowness of the inlet, estuary and lagoons forces a strongly bimodal distribution in this main axis, justifying this procedure. Downstream currents were assigned as negative (out of the estuary) whereas upstream currents were as-signed as positive (into the estuary). The maximum flood and ebb currents were obtained for each station.
In order to evaluate how the astronomical tide, meteorolo-gical tide and river discharge affects the currents, three 25-hour periods were selected: Period 1 (P1) at the beginning of the
cam-paign, during neap tide conditions, high river discharge and no meteorological tide; Period 2 (P2), in the middle of the cam-paign, during spring tide conditions, low river discharge and no meteorological tide; and Period 3 (P3), at the end of the cam-paign, during neap tide conditions, low river discharge and with meteorological tide.
324
HYDRODYNAMICS OF THE ITAPOCU ESTUARINE SYSTEM, SC, BRAZILanalyzed in terms of spectral analysis. The power spectral density was calculated using the Welch’s averaged periodogram method with a 512-element window at a 95% confidence interval (e.g. Truccolo et al., 2006).
RESULTS
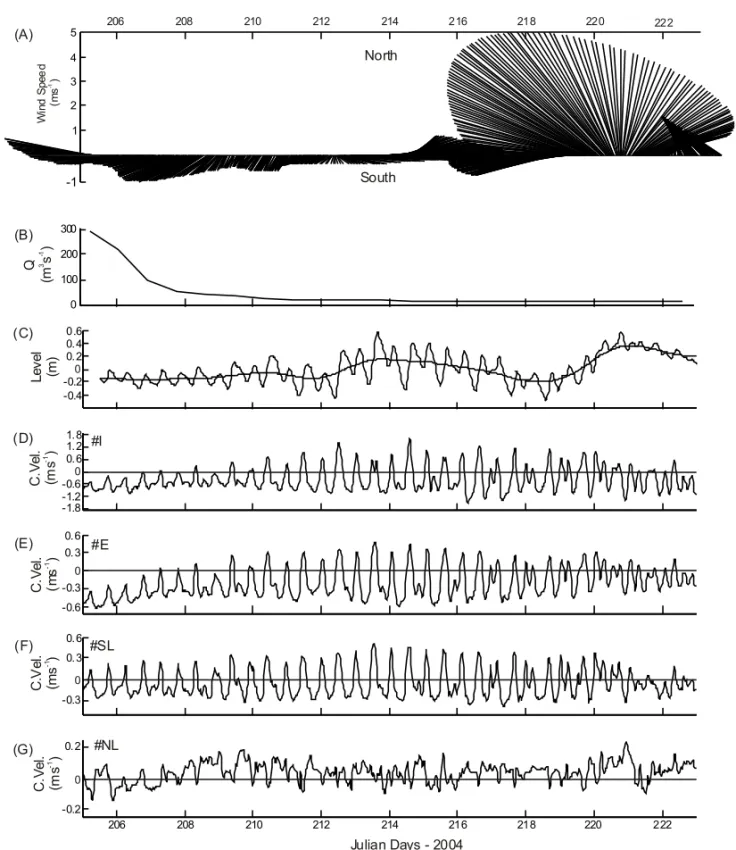
During most of the experiment winds were southward with mag-nitudes under 1 m.s−1. However, between the days 219 to 221 strong southerly winds were recorded, reaching up to 6 m.s−1 (Fig. 2A).
A peak in fluvial discharge occurred at the beginning of the measuring period due to heavy rainfall on the drainage basin re-aching 290 m3.s−1(Fig. 2B). After the discharge peak, it decre-ased rapidly to 116 m3
.s−1
on day 207, 24 m3 .s−1
on day 210, and 15.7 m3
.s−1
on day 222, remaining around 14.5 m3 .s−1 onwards.
The water level (Fig. 2C) showed a neap tide period, days 206-210, followed by a spring tide period, days 212-216, and another neap period, days 218-222. Two low frequency water le-vel oscillations were recorded in the middle, days 212-218, and at the end, days 218-222, of the campaign, with amplitudes of 0.3 and 0.6 m, respectively. The water level variance associated with the sub-tidal frequencies accounted for 58% of the energy, whereas the tidal frequencies accounted for the remainder 42%.
Time series of the measured currents at the four sites are shown in Figure 2 (D, E, F and G). Except for Station #NL, the cur-rent regime in all other stations presented a clear semi-diurnal ti-dal signal. On Station #I flood currents reached a maximum mag-nitude of 1.57 m.s−1and the ebb currents reached 1.68 m.s−1 (Table 1). Station #E presented maximum values of flood and ebb currents of 0.27 and 0.61 m.s−1
, respectively. Flood currents at stations #SL and #NL reached 0.54 and 0.2 m.s−1, respecti-vely, and 0.46 and 0.20 m.s−1
for the ebb currents, respectively. Residual currents were ebb-oriented for #I and #E and flood-oriented for #SL and #NL. The longitudinal axis energy represen-ted 82, 59, 76 and 63% of the variance for the #I, #E, #SL and #NL stations, respectively.
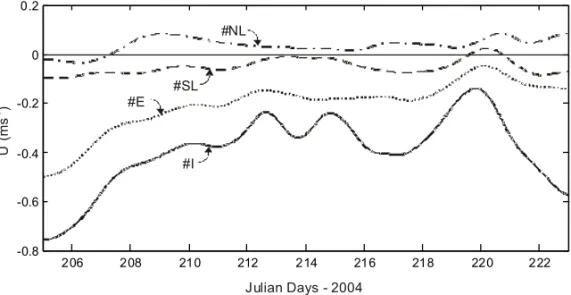
Tidal frequencies accounted for nearly 65% of the cur-rent velocity variance, being the higher variance in #SL station (75%; Table 1). Sub-tidal currents are shown in Figure 3. Sta-tions #I and #E had negative values during all monitored period, with the higher negative values during the first days of the cam-paign, of –0.75 and –0.5 m.s−1
, respectively. The currents at sub-tidal frequencies at stations #SL and #NL ranged between ±0.1 m.s−1. The currents were mostly negative at #SL, while they were mostly positive at #NL.
Table 1– Maximum ebb and flood currents for each station and their residual over the monitored period; longitudinal current variance (L.C.V.) and tidal fre-quency variance (T.F.V.).
Station Ebb Flood Residual L.C.V. T.F.V.
(m.s−1
) (m.s−1
) (m.s−1
) (%) (%)
#I –1.68 1.57 –0.34 82% 64
#E –0.61 0.27 –0.20 59% 66
#SL –0.46 0.54 +0.04 76% 76
#NL –0.20 0.20 +0.02 63% 68
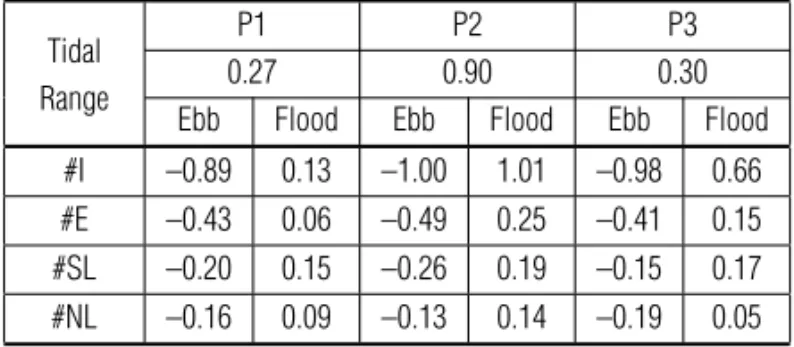
Table 2– Tidal range (m), and maximum ebb and flood currents (m.s−1 ) at the four stations for the three selected 25-hour periods.
Tidal P1 P2 P3
Range 0.27 0.90 0.30
Ebb Flood Ebb Flood Ebb Flood
#I –0.89 0.13 –1.00 1.01 –0.98 0.66
#E –0.43 0.06 –0.49 0.25 –0.41 0.15
#SL –0.20 0.15 –0.26 0.19 –0.15 0.17
#NL –0.16 0.09 –0.13 0.14 –0.19 0.05
Table 2 shows the water level variation and maximum and minimum current speeds within the 25-hour periods for P1, P2 and P3 selected periods. In P1 and P3 the ebb current speeds were significantly higher than the flood currents speeds in every station except Station #SL on P3. In P2, under spring tide con-ditions, the currents speed were similar between ebb and flood in stations #I and #NL and had higher magnitudes in ebb conditions on stations #E and #SL.
The current polar frequency distribution is shown in Figure 4. The energy on Station #I was concentrated along the east-west axis with most of the energy concentrated in ebb current speeds. Similar pattern was observed for #E, although there was some dispersion along the east-west direction. The energy on Station #SL showed a concentration of energy along the north-south axis and mostly on ebb-oriented current. Little energy concentration was observed along east-west direction for #NL being most of it towards west-northwest and north direction.
Figure 2– Time series of wind speed (A, in vector notation), river discharge (B), water level at #TG (C) and current velocity (C.Vel.) at stations #I (D), #E (E), #SL (F) and #NL (G).
DISCUSSION
Estuaries have a wide range of morphologies, each of which developed in a specific way of interaction between fluvial and ma-rine processes (Cameron & Pritchard, 1963; Perillo, 1995; Dyer, 1997; Miranda et al., 2002). In the Itapocu river and Barra Velha lagoon estuarine system, the estuary crosses the lagoon before it flows out to the sea, through the lagoon’s only inlet. This
sys-tem can be considered as composed by two restricted lagoons, according to the coastal lagoon classification (Kjerfve, 1986; Kjerfve & Magill, 1989), associated with a deltaic front estuary (e.g. Fairbridge, 1980), even though they form a single coastal water body.
326
HYDRODYNAMICS OF THE ITAPOCU ESTUARINE SYSTEM, SC, BRAZILFigure 3– Time series of sub-tidal frequency currents at the Inlet (#I), Lower Estuary (#E), South Lagoon (#SL) and North Lagoon (#NL) stations.
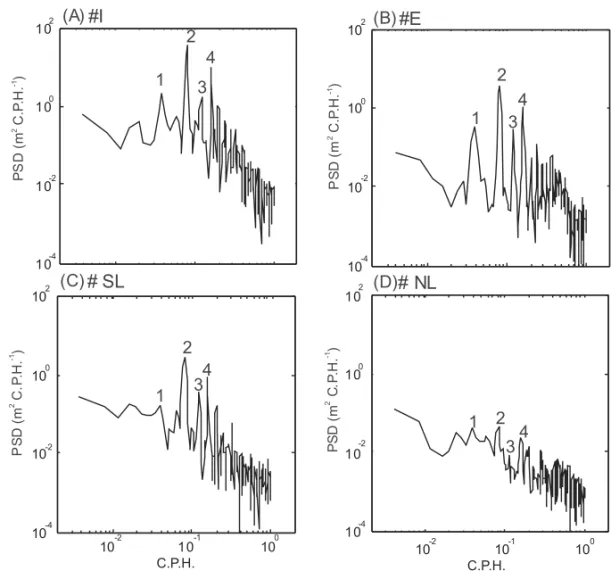
Figure 5– Spectrograms of longitudinal currents for the four sampling sites. The numbers over the spectrum peaks indicate the tidal species (1: diurnal; 2: semi-diurnal; 3: terci-diurnal; 4: quarti-diurnal). PSD: power spectral density; C.P.H.: cycles per hour. A: Station #I; B: Station #E; C: Station #SL; D: Station #NL.
total energy. For comparison, Schettini (2002) and Truccolo et al. (2006) found energy distribution between tidal and sub-tidal frequencies of nearly 70 and 30%, respectively, from records of several months of water level in Itaja´ı-Ac¸u estuary, 35 km south, and Enseada Bight, 40 km north, respectively. The energy asso-ciated with the sub-tidal frequencies for the present case can be explained due to the occurrence of a river discharge peak during the beginning of the sampling period and the meteorological tide recorded at the end of the sampling period.
The low frequency sea level oscillations play an important role along the Santa Catarina coast, as it is under a micro-tidal regime (<2 m; Truccolo et al., 2006). These fluctuations are generated
mostly by meteorological events and the wind accounts for 90% of the variance whereas the remaining 10% are explained by at-mospheric pressure (Truccolo et al., 2006). The influence of me-teorological processes on the mean sea level is very important for local coastal dynamics since the water level can be raised up to 1 m above the astronomical tides (Schettini et al., 1996),
genera-ting currents and influencing mixing processes. The importance of meteorological events on coastal water bodies was effectively verified in this study. Water level set-up at the end of the cam-paign (Fig. 2), at neap tide conditions, occurred due to intense southerly winds that reached speeds of up to 10 m.s−1
(the wind vectors in Figure 2 were filtered to minimize noise, though mas-king wind peaks). Truccolo et al. (2006) demonstrated that there is a phase lag between the wind stress and water level of around 10 hours for the coastal region of S˜ao Francisco do Sul, located to the north of the study area. The winds that lasted for appro-ximately 3 days starting at day 219, were strong enough to push and accumulate water against the coast and lagoon generating the water level raise.
328
HYDRODYNAMICS OF THE ITAPOCU ESTUARINE SYSTEM, SC, BRAZILdirection almost always followed the tidal pattern, with flood cur-rents occurring synoptically with high tides, and the ebb curcur-rents coinciding with the low tides; therefore, the higher magnitudes were always recorded during ebb phase.
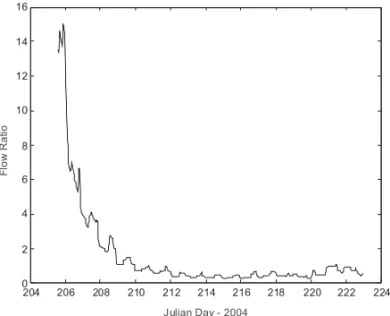
Although the tidal frequencies exhibit higher energy concen-tration both in the spectrum and in the energy variance, the highest current speeds and dominant flux were associated with increased river discharge, which is made clear by the flux rate values (e.g., Dyer, 1997). The flux rate,F R, weights the relative volume con-tributions of river discharge and tides, by
F R= R6.2
0 Qdt
Ah (1)
or, the river discharge, Qin m3 .s−1
, integrated over half semi-diurnal tidal period, divided by the tidal prism. The latter is the product of the estuarine surface area,Ain m2
, and the tidal height, hin m. TheF Rwas calculated using a 12.4-hour running win-dow over the dataset (Fig. 6). Values ofF Requals to one mean that river and tide equal volume contributions, whereas higher F Rvalue indicates the dominance of river discharge. According to Dyer (1997), when F R >1 there is river dominance and the
estuary is highly stratified.
Figure 6– Time series of the flow ratio during the sampling period.
During the first third of the experimentF Rvalues were much higher than unity, reaching up to 15, directly related to the river discharge peak. During the second third, under spring tide con-ditions, F Rranged between 0.3 and 1.5 indicating that during low tide the volume of river water is greater than the tidal prism and during high tide the tidal prism dominates over the river dis-charge. During the last third of the campaignF Rvaried between 1 and 2, also demonstrating the dominance of river discharge over tidal prism.
CONCLUSIONS
The observations of wind speed, water level and currents in the lower Itapocu estuary and lagoons during a limited time period (15 days), during which a river discharge peak and a meteorolo-gical tide were recorded, allow one to depict some important cha-racteristics of this system. Each current measurement station has a current pattern that responds in different ways to tides and river discharge. It was observed that in general the flux direction swit-ches between ebb and flood due to the tidal variation, being more perceptible during spring tide condition, when the tidal range is larger.
In this estuary the ebb currents had a higher frequency and intensity for the entire campaign period. The magnitude of the fluxes and their resultant direction were forced by the low fre-quencies, mostly by the action of the river discharge, causing the dominance of the ebb currents during most of the campaign.
The highest speeds were measured at the inlet (#I), due to its constricted form and because it is the only water connection to the ocean; and the lowest current speed values were recorded in the north lagoon (#NL), showing it to be the location where the lowest dynamics occurs in this estuarine system.
ACKNOWLEDGEMENTS
We would like to thank Santa Catarina’s Research Support Foun-dation – FAPESC for the financial support and everyone that had a participation in the Morphodynamic and Sediment Transport in an Estuarine Inlet System – CANAIS, project; we are grate-ful to the anonymous reviewers for its valuable contribution im-proving the manuscript. CNPq Grants No. 306217/2007-4 and 308303/2006-7.
REFERENCES
CAMERON WM & PRITCHARD DW. 1963. Estuaries. In: HILL MN (Ed.). The sea. New York, Wiley Interscience. p. 306–324.
DIONNE JC. 1963. Towards a more adequate definition of the St. Law-rence estuary. Zeitschr. F. Geomorph., 7(1): 36–44.
DYER KR. 1997. Estuaries: a physical introduction. 2nded. New York,
John Wiley and Sons, 195 p.
FAIRBRIDGE RW. 1980. The estuary: its definition and geodynamic cy-cle. In: OLAUSSON E, CATO I. (Eds.). Chemistry and biogeochemistry of estuaries. New York, John Wiley and Sons, p. 1–35.
GAPLAN. 1986. Atlas do Estado de Santa Catarina. Gabinete de Plane-jamento e Coordenac¸˜ao Geral, Florian´opolis, 173 p.
KJERFVE B. 1986. Comparative Oceanography of Coastal Lagoons. In: WOLFE DA (Ed.). Estuarine variability. New York, Academic Press. p. 63–81.
KJERFVE B & MAGILL KE. 1989. Geographic and hydrodynamic charac-teristics of shallow coastal lagoons. Marine Geology, 88: 187–199.
MIRANDA LB, CASTRO BM & KJERFVE B. 2002. Princ´ıpios de Oceano-grafia de estu´arios. S˜ao Paulo, EdUSP, 411 p.
PERILLO GME. 1995. Geomorphology and Sedimentology of Estuaries. New York, Elsevier Science, 471 p.
SCHETTINI CAF. 2002. Caracterizac¸˜ao f´ısica do estu´ario do rio Itaja´ı-Ac¸u. Revista Brasileira de Recursos H´ıdricos, 7(1): 123–142.
SCHETTINI CAF & CARVALHO JLB. 1998. Hidrodinˆamica e distribuic¸˜ao
de sedimentos em suspens˜ao dos estu´arios dos rios Itapocu, Tijucas e Cambori´u. Notas T´ecnicas da Facimar, 2: 141–153.
SCHETTINI CAF, CARVALHO JLB & JABOR P. 1996. Comparative hydro-logy and suspended matter distribution of four estuaries in Santa Catarina State – Southern Brazil. In: Workshop on Comparative Studies of Tem-perate Coast Estuaries, Bah´ıa Blanca. Proceedings, p. 29–32.
SIEGLE E, SCHETTINI CAF & TRUCCOLO EC. 2007. Balanc¸o dinˆamico em desembocaduras durante mar´es meteorol´ogicas. In: Congresso Lati-no-americano de Ciˆencias do Mar – XII, 2007. Florian´opolis. CD-ROM.
TRUCCOLO EC, FRANCO D & SCHETTINI CAF. 2006. The low frequency sea level oscillations in the northern coast of Santa Catarina, Brazil. Journal of Coastal Research, 39(SI): 547–552.
NOTES ABOUT THE AUTHORS
Cl´audia Franc¸a de Abreu. Undergraduate in Oceanography by the Universidade do Vale do Itaja´ı (2007). Actually is graduate student in Coastal and Marine Engineering and Management (CoMEM), Erasmus Mundus Program, Delft University of Technology – The Netherlands. The main interests are coastal hydrodynamics and morphodynamics.
Eduardo Siegle.Undergraduate in Oceanography by the Fundac¸˜ao Universidade do Rio Grande (1996), Master in Geosciences by the Universidade Federal do Rio Grande do Sul (1999) and Doctor in Marine Sciences by the University of Plymouth (2003). Actually is Lecturer in the Instituto Oceanogr´afico of the Universidade de S˜ao Paulo. Has experience in oceanography, with emphasis in Coastal Environmental Morphology, acting mainly in the subjects: coastal morphodynamics, estuarine and coastal processes, sedimentology, coastal dynamics, numerical modeling, and remote sensing. Has CNPq Research Grant since 2007.
Eliane Cristina Truccolo. Undergraduate in Oceanography by the Fundac¸˜ao Universidade do Rio Grande (1993), Master in Environmental Engineering by the Universidade Federal de Santa Catarina (1998) and Doctor in Geosciences by the Universidade Federal do Rio Grande do Sul (2009). Actually has pos-doc scholarship in the Instituto de Ciˆencias do Mar of Universidade Federal do Cear´a. The main interests are physical oceanography, sea-atmosphere interactions, and sea-level analysis.