INTRA-TIDAL VARIATION OF STRATIFICATION IN A SEMI-ARID ESTUARY
UNDER THE IMPACT OF FLOW REGULATION.
Felipe Facó Frota1, Bárbara Pereira Paiva1 and Carlos Augusto França Schettini2*
1
Universidade Federal do Ceará - Instituto de Ciências do Mar (Av. da Abolição, 3207, 60165-081 Fortaleza, CE, Brasil)
2
Universidade Federal de Pernambuco - Departamento de Oceanografia (Av. Prof. Moraes Rego, 1235, 50670-901 Recife, PE, Brasil)
*Corresponding author: [email protected]
A
B S T R A C TThe Jaguaribe River is the largest semi-arid Brazilian river and represents an important water source for the state of Ceará. The Castanhão Weir, built to regulate the flow of the Jaguaribe, began operating successfully in the 1990s. As a result, the hydrodynamic regime of the estuary has undergone alteration and is no longer subject to the former annual climatological variability of the dry and rainy seasons. This paper introduces an assessment of the changes in the hydrological conditions resulting from the construction of the weir and investigates the structure of the density stratification in the estuary. A field experiment was conducted at the end of the dry season in November 2009, during which salinity and temperature were monitored at different levels for three tidal cycles. The temporal variations in salinity and temperature during the tidal cycles were 16 psu and 1.5°C, respectively. The salinity exhibited a vertical variation of four units, while the temperature variation was much lower. Several stratification indicators were calculated from the observed density: the stratification coefficient, the Brunt-Väisälä frequency and the potential energy anomaly. The results showed that the parameters behave similarly, differences being observed only in their relative magnitudes. The vertical structure of the estuary exhibited marked stratification during the ebb tide but vertical homogeneity during both flood and high tide. With the regularized flow existing under present conditions, the estuary exhibits hyposaline and a partially mixed structure for the period studied, despite the typical expectation of a hypersaline and well-mixed vertical structure.
R
E S U M OO rio Jaguaribe é o maior rio do semi-árido brasileiro, constituindo uma importante fonte de água para o estado do Ceará. Na década de 1990 entrou em operação o Açude do Castanhão com o objetivo de regularizar a vazão do rio Jaguaribe, o qual obteve grande sucesso. Como consequência foi alterado o regime hidrodinâmico do estuário, o qual atualmente não está mais sujeito a variabilidade climatológica anual de estações seca e chuvosa. O presente trabalho apresenta uma avaliação da mudança do regime hidrológico antes e após a construção do açude, e investiga a estrutura de estratificação da densidade nos estuários. Foi realizado um experimento de campo em novembro de 2009, no fim da estação seca, quando a salinidade e temperatura da água foram monitorados em diferentes níveis durante três ciclos de maré. A variação temporal da salinidade e temperatura durante os ciclos de maré foram de 16 psu e 1,5ºC, respectivamente. A salinidade chegou a apresentar variação vertical de 4 unidades, enquanto que a variação da temperatura foi bem inferior. Foram calculados parâmetros indicadores da estratificação a partir da densidade: coeficiente de estratificação; frequência de Brunt-Väisälä; e a anomalia da energia potencial. Os resultados mostraram que os parâmetros comportam-se da mesma maneira, apenas com diferença da magnitude relativa de seus valores. A estrutura vertical do estuário apresentou estratificação pronunciada durante a fase de vazante da maré, e verticalmente homogênea na fase de enchente da maré e durante a preamar. Dada as condições presentes, com vazão regularizada, o estuário apresenta padrão de estratificação parcialmente misturado e hiposalino, quando seria esperado uma condição bem misturada e hipersalina para o período estudado.
I
NTRODUCTIONEstuaries are restricted bodies of water where there is a measurable dilution of seawater by freshwater from continental drainage due to the free connection with the ocean (CAMERON; PRITCHARD, 1963). Most of the materials generated by continental weathering are carried to oceans via estuaries, which indicates the importance of these environments to global ecology (MIRANDA et al., 2002). Estuaries act as efficient traps for materials due to their hydrodynamic and biological characteristics (SCHUBEL; CARTER, 1984), which result in environments with high primary productivity that serve as a nursery for many species. These environments are directly affected by human activities such as urban development, port-related activities and shrimp farming and are indirectly impacted through watershed management.
The filtration efficiency of a given estuary depends on several factors, such as its morphology and flow regime, although estuary water circulation also plays a major role (DYER, 1995). Estuary systems dominated by river discharge characteristically exhibit a highly stratified vertical salinity distribution governed by fluvial advection and lower filtering efficiency (e.g., SCHETTINI et al., 2006). In estuaries where there is a balance between river and tidal forcing, the vertical pattern of salinity is partially stratified, and estuarine circulation plays an important role in scalar transport inside the estuary, resulting in efficient systems for the retention of material (e.g., GEYER et al., 2000). The tide-dominated estuaries present a well-mixed vertical distribution of salinity, and the filtration efficiency may be low or high depending on the morphology and behavior of the tide (e.g., WOLANSKI; RIDD, 1986; SCHETTINI; MIRANDA, 2010).
The construction of dams to supply water is a common intervention in most rivers flowing through semi-arid areas that significantly impacts the physico-chemical characteristics and circulation of estuaries by reducing their flow in the rainy season (GENZ et al., 2008) and maintaining a perennial flow during the dry season. The reduction of flow results in increased salinity intrusion and a decreased sediment load, increased residence time and changes in the dynamic maximum turbidity zone (REDDERING, 1988; SKLAR; BROWDER, 1998; ALBER, 2002). However, the perennial flow can produce an increase in the average flow during the dry season, which may result in increased water-column stratification associated with the gravitational circulation and residual circulation displacing the estuary zone seaward (GENZ et al., 2008).
The Jaguaribe River is the longest river in a semi-arid region in Brazil, and its river basin is the
largest between the São Francisco River (641,000 km2) in the south and the River Parnaíba (344,000 km2) to the west. The seasonal variation of the rainfall regime is well defined: there is a rainy season lasting from February to May and a dry season from August to November. The rainfall is of approximately 750 mm.yr-1, and the water balance between
precipitation and evapotranspiration is mainly negative in the dry season.
The hydrological seasonality is reflected in the estuarine hydrodynamics. During the dry season, there is no river input, and estuarine circulation is governed by the tides; the circulation pattern is of the well-mixed type. In the rainy season, discharge increases significantly and may completely flush the salt water from the estuary (e.g., SCHETTINI 2002a) or maintain a stratified flow pattern. However, hundreds of dams have been constructed in the basin to supply water, due to the semi-arid climatic conditions. The two largest reservoirs on the Jaguaribe River are the Orós, built in the 1960s, with a capacity of 2.1 x 10⁹ m3, and the Castanhão, built in the 1990s,
with a capacity of 6.7 x 10⁹m3. The purpose of these dams was to permit a perennial discharge of the Jaguaribe River in its lower course (FUCK JÚNIOR, 2008) so as to sustain agricultural activity and to supply water in the middle portion of the basin for the metropolitan region of Fortaleza through the "Canal do Trabalhador”. This artificial channel consists of an aqueduct that begins 35 km upstream from the estuary inlet, at the village of Itaiçaba and extends as far as Fortaleza City. At this point, a wet passage (a shallow barrier) was constructed that determines the upper limit of tidal propagation up the Jaguaribe River.
The effect of the perennial, regular discharge from the Jaguaribe River is reflected in the hydrodynamic conditions of the estuary and has eliminated the previous effect of the climatic variability. As a result of the present constant river input, the dynamics of the estuary are determined mainly by the modulation of the tide. The objective of this study is to characterize the pattern of the vertical distribution of the density in the middle estuary of the Jaguaribe River by assessing the intra-tidal effects of salinity and temperature on estuarine dynamics on the basis of a short-term experiment and the contextualization of the situation in relation to the current hydrologic framework. A brief assessment of the tide propagation behavior in the estuary is also presented.
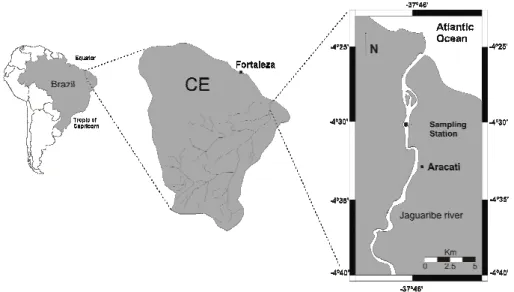
Study Area
the coordinates 4°30’ and 7º45’ S and 37°30’ and 41°00’W (Fig. 1) and is situated almost entirely within the boundaries of the state of Ceará. The Jaguaribe River has an extension of 630 km and an average flow of approximately 60 m3.s-1.
The average annual air temperature is approximately 25°C, with little seasonal variability (CAMPOS, 2003). Rainfall presents a negative gradient from the coast inland. The average annual rainfall is approximately 1,270 mm in the humid coastal region and 470 mm throughout most of the basin in the semi-arid region (VERISSIMO et al., 1996).
An important feature of the regional climate is the contrast between the winter and summer rainfall. The rains that occur between December and January often result from the arrival of cold fronts from the south and the formation of cyclonic vortices. Between February and May, considered to be the rainy season, the rains impact the position of the Intertropical Convergence Zone (ITCZ), a system that is considered directly responsible for regulating the climate of the region (CAMPOS, 2003).
The Jaguaribe River estuary is located between the municipalities of Fortim and Aracati; its mouth is situated approximately 100 km east of Fortaleza, in a region characterized by sandy beaches with large dune fields exposed to constant wind. The estuary, relatively narrow - though up to 900 m wide in certain places, extends for 35 km to the village of Itaiçaba. It also includes mangrove areas, covering about 12 km2, in the lower estuary.
The estuarine region is of great economic importance due to shrimp farming which has adapted the species cultivated to farming conditions, and also to the great profitability of the enterprise
(FIGUEIREDO et al., 2005). Shrimp have a particularly important effect on the hydrodynamics of the estuarine system. The farms in the estuary cover approximately 19.7 km2 of free surface, whereas the lane surface area of the estuary is of only approximately 7 km2. Water is pumped from the estuary, causing a loss of water, by evaporation, to the atmosphere. However, the effects of this practice have not been evaluated. The perennial contribution to the river estuary currently occurs by means of the controlled release of water from the Castanhão, Orós and Banabuiú dams (FUCK JÚNIOR, 2008).
The local astronomical tides are semi-diurnal; the maximum spring tide attains a height of 2.8 m, and the maximum neap tide one of 1.5 m (SCHETTINI et al., 2011), resulting in an intermediate stage between micro- and meso-tide, in accordance with Davies' classification (1973).
M
ATERIAL ANDM
ETHODSA field experiment was conducted in the estuary of the Jaguaribe River from November 24-26, 2009, covering three complete semi-diurnal tide cycles (thirty-seven hours) under neap tide conditions. The experiment used instruments anchored in the thalweg of the cross-section, located nine kilometers upstream from the mouth (Fig. 1) at a depth of 6 m. An Acoustic Doppler Current Profiler (ADCP; ADP-1500 SonTek) was installed to collect data on the speed and direction of current probes, and three data loggers measuring water conductivity and temperature (CTs; Diver CTD Schlumberger) were situated at surface, midwater and near-bottom levels. The ADCP had technical problems and did not report any data.
Salinity was calculated from the recordings of conductivity and temperature made by the CTs using algorithms to determine the practical salinity scale of 1978 (FOFONOFF; MILLARD, 1983) by means of the routines for Matlab (MathWorks Inc.) provided by Phil Morgan at http://www.cmar.csiro.au.
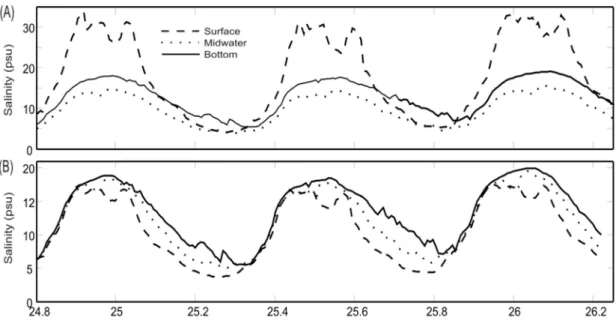
A preliminary inspection of the salinity data revealed that in periods of high tide, the salinity of the surface exhibited higher values than were observed at midwater and bottom depths, while the low-water surface values were lower (Fig. 2A). This behavior is abnormal, as in classical estuaries salinity increases from the surface downwards because an increase in salinity implies an increase in water density. This observation suggested that the CTs were not functioning properly or that the calibration applied was incorrect. For confirmation, a verification procedure using a CTD probe type (SD-204 SAIV A/S) was performed as a reference.
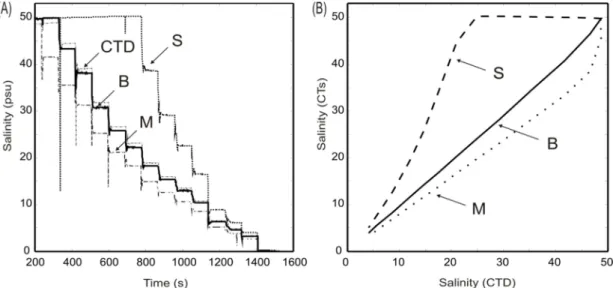
A salt solution was prepared using sodium chloride and fresh water. The initial concentration was estimated at 50 psu. This value was based on the conductivity range of the CT’s and the CTD of 80 mS cm-1, which corresponds to a salinity of approximately 60. The CTs and CTD were immersed in saline and set to record data at intervals of one second. At approximately one-minute intervals, 200 ml volumes
of fresh water were added to the tank, thus gradually diluting the salt content until it approached zero. Figure 3A shows the temporal variation of salinity recorded by the CTs and CTD during the procedure. The CTs were designated S, M and B in reference to the level (surface, midwater and bottom, respectively) of the data loggers during the fieldexperiment. Mean values were calculated for each additional fresh water interval to allow comparisons across the sensors. The results of the calibration considering the reference CTD value are shown in Figure 3B. The CT-B results showed the greatest consistency with the CTD; a linear 1:1 salinity relationship was observed until a salinity of slightly above 40 was attained. The CT-M also exhibited a linear relationship with CTD, but with a gentler slope, which generates little discrepancy at low salinity, whereas a salinity relationship of 30 (CTD) produces a discrepancy of 5 units. The CT-S showed strongly nonlinear behavior with salinity at the upper limit of 20. Polynomial functions for the best-fit curves (Table 1) were generated using the Matlab Curve Fitting Toolbox (Mathworks Inc.). Once corrected, the data were consistent with the pattern expected for classical estuaries, exhibiting a negative vertical gradient of salinity throughout the experiment (Fig. 2B).
Fig. 2. Temporal variation in salinity levels at the surface (S), midwater (M) and bottom (B) during the experiment. A. Uncalibrated data; B. Calibrated data.
Figure 3.A. Time series of salinity obtained during the calibration procedure for the CTs. B. Relationships between the salinity values recorded by the CTs and those recorded by the CTD during calibration. The values are related to the levels of the probes during the field experiment. S: surface, M: midwater, B: bottom.
Table 1. Salinity adjustment equations for the CTs.
CT Adjustment Equations r²
S -0.004565x² + 0.0648x + 1.035 0.9991 M -0.0004815x³ + 0.02517x² + 0.9028x +
1.253
0.9991
B 0.002477x² + 1.124x – 0.5382 0.9996
From the corrected database for salinity (Fig. 2B), the density of water was calculated according to the equation of state for sea water (FOFONOFF, 1985) using Matlab routines (MathWorks, Inc.) available from Phil Morgan at http://www.cmar.csiro.au.
Data on flow in the Jaguaribe River basin and rainfall were obtained from the National Water Agency (AgênciaNacional de Águas - ANA) through the HIDROWEB tool and the Ceará Foundation of Meteorology and Water Resources (FundaçãoCearense de Meteorologia e RecursosHídricos - FUNCEME).
River discharge data were recovered and analyzed in a time series from a station located downstream from the Castanhão Weir (Peixe Gordo Station, 5°13’39"S; 38°11’52" W and altitude of 50 m). Precipitation data were obtained for the Jaguaribe Station (located at 5°54’S; 38°37’W), for the Orós Station, (located at 6°15’S; 38°55’W) and for theAracati Station (located at 4°34’S; 37°46’W).
Sea level data were obtained from a station of the Fortaleza Geodetic Permanent Tide Gauge Network (Estação Fortaleza da RedeMaregráfica Permanente paraGeodésia - RMPG) from the Brazilian Institute of Geography and Statistics (InstitutoBrasileiro de Geografia e Estatística - IBGE) located at the Port of Mucuripe, Fortaleza - CE (03° 42.9’S; 38°28.6’W).
R
ESULTS ANDD
ISCUSSIONHydrological Regime
The semi-arid Jaguaribe River basin is hydrologically characterized by well-established annual rainy and dry seasons. Figure 4 shows the seasonal variation of precipitation for coastal (Aracati) and innermost areas (Orós and Jaguaribe). The rainy season is concentrated between February and May, while the dry season occurs mainly between August and November. Rainfall is slightly higher near the coast during the wet season; during the dry season, there is no distinction between different areas.
(ANDREOLI; KAYANO, 2007), influencing the position of the Inter-Tropical Convergence Zone. After construction of the weir, the flow was regulated, resulting in a considerable decrease of their maximum values in the annual rainy season. Moreover, the flow rate was maintained at higher levels than those occurring during dry periods. Figure 6 illustrates data presented in Figure 5 in terms of the monthly averages pre- and post-construction of the Castanhão Weir. Before the construction of the weir, the monthly runoff at a point in the Jaguariberiver downstream from the weir presented a maximum of approximately 580 m3s-1
in the rainy season and a minimum value of 1.2 m3s-1 in the dry season. After the installation of the weir, the recorded flow rates were homogeneous throughout the year, averaging approximately 35 m3s-1, and opening the gates of the weir was sufficient to control the river discharge. Only under extreme conditions, when the reservoir level exceeds the safety limit, are the weir gates opened to allow higher flow rates downstream.
The regularization of the flow rate influences the estuary's functioning as a filter as material transfer occurs across the continent-ocean interface. The extreme reduction of flow considerably reduces the export of sediments which occurs during periods of high discharge onto the continental shelf. Large-flow events are able to move larger volumes of sediment than those moved under low-flow conditions (DYER, 1998; SCHETTINI, 2002b),
Fig. 4. Annual variation of the monthly average daily rainfall for the AracatiOrós and Jaguaribe regions for the period from 1974 to 2010.
Fig. 5. Time series of the Jaguaribe River flow between the years 1962 and 2010; no data between 1985 and 1996.
Fig. 6. Average monthly flow for the period from 1962 to 1985 (pre-Castanhão), prior to the construction of the weir, and from 1995 to 2010 (post-Castanhão) at a station downstream of the Castanhão Weir on the Jaguaribe River.
Tides in the Jaguaribe Estuary
A variation in the water level of 1.24 m was recorded during the observation period (Fig.7), indicating a neap tide condition. The tidal wave was symmetrical between the tidal cycles, with nearly the same period of flood and ebb, which indicates a low degree of distortion due to shallow water tidal propagation.
Figure 7 also shows the temporal variation of the synoptic water level in the Port of Fortaleza. The distance between the mouth of the estuary and the harbor is approximately 110 km. The harbor tide gauge is located at Ponta do Mucuripe, representing open sea conditions (SCHETTINI et al., 2011). The same pattern is observed throughout the mouth of the estuary, albeit with a phase shift. The propagation of oceanic tides in this area occurs from east to west (PUGH, 2004), and the tide in Fortaleza exhibits a phase delay compared with the tide of the estuary, based on the difference in the timing of high tides found in the records.
The difference in the water level between the coast and the recording site in the estuary was 0.1 m, which suggests an energy reduction of about 10% for the neap tide condition recorded. This decrease in the amount of energy is the result of the frictional effects of the edges on the upstream flow, associated with a hyposynchronous tidal pattern (NICHOLS; BIGGS, 1985). The width of the estuary is between 100 and 300 m, and the depth of the channel at the measuring point is approximately 5-6 m. Upstream from Aracati, 18 km from the mouth of the estuary, there is a depth reduction to approximately 1 m, and more effective dissipation of the tide is expected to occur from this point.
Fig. 7. Change in the water level observed in the estuary of the Jaguaribe River (solid line) and at the Port of Fortaleza (dotted line).
Vertical Structure - Stratification and Mixing
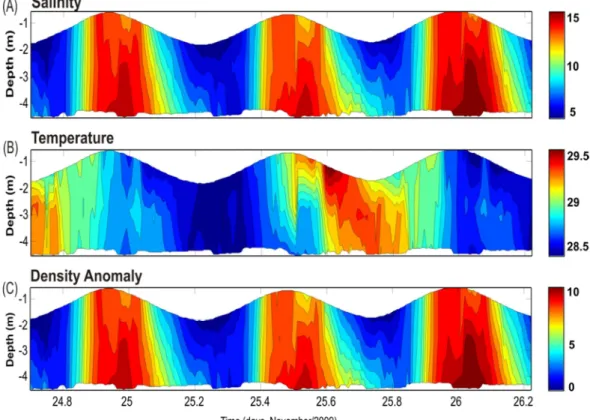
Figure 8 shows the vertical and temporal distributions of salinity, temperature and density, indicating the variation in the structure of the water column as a function of the tides. The overall average salinity was 11.4, with a variation of 16 units observed during each tidal cycle. The pattern of variation in salinity followed the tidal cycles, with maximum values recorded during high tides and minimum values during low tides. The vertical structure exhibited a salinity variation of 4, with mean values of 9.7, 11.4 and 13.1 at surface, midwater and bottom levels, respectively. The minimum and maximum values recorded for the surface, midwater and bottom levels were 1.8 and 17.4, 3.0 and 19.7 and 5.5 and 20.0,
respectively. During most of the period examined, the water column exhibited a vertically homogeneous pattern. Vertical stratification of salinity was recorded only during periods of low tide, showing a difference of up to 5 units between the surface and bottom.
The overall average temperature was 28.8° C, with minimum and maximum values for the surface, midwater and bottom levels of 28.3 and 29.9, 28.3 and 29.6 and 28.3 and 29.6 °C, respectively. In contrast to the pattern of variation in salinity, the temporal variation of temperature did not follow the tidal variation. The lowest temperatures were recorded at low tide during the night of the 25th, and the highest temperatures were recorded at ebb tide during the day on the 25th and throughout the subsequent low tide. The energy balance induced by daytime heating and nighttime cooling of estuarine waters caused this modulation.
The density, expressed as the density anomaly (Sigma-t), averaged 4.8 kg.m-3, exhibiting
minimum values near zero and maximum values near 11. The oscillation of the density correspondedstrictly to the observed salinity variation. For the conditions of temperature and salinity recorded, the variability in density due to temperature was only 0.5 kg.m-3, whereas that due to the salinity was 13.6 kg.m-3.
Fig. 8. Temporal Distribution/Vertical Distribution: A. salinity (psu), B. temperature (oC) and C. density anomaly (
The density distribution pattern shown in Figure 8C indicates the highest vertical gradients during the ebb tide phase, when the vertical structure of the estuary becomes stratified. During the flood tide phase, the vertical structure becomes homogeneous. The modulation of increasing the stratification in the ebb period and the mixing during the flood phase is explained by the tidal straining (e.g., SIMPSON et al., 2004). Considering the oscillatory tidal flow, the water displacement on the surface will be higher due to the near bottom bed shear, resulting in slower near bed currents. Additionally, taking into account the longitudinal density gradient along the estuary, low density waters will flow over higher density waters during ebb tide, increasing the stratification. The maintenance of a stratified vertical structure can be justified by the relatively low energy dissipation as the tide travels up estuary (e.g. Figure 7). The same effect applies during the flooding process, though producing reverse stratification with an increase in density upwards. This creates an unstable situation which results in water parcels' overturns and vertical mixing.
The evolution of the vertical structure of the water column during the tidal cycles was evaluated in terms of the stratification parameter (e.g., HANSEN; RATTRAY, 1966); buoyancy frequency, or Brunt-Väisälä frequency (e.g., DIJKSTRA, 2008); and anomaly of potential energy (e.g., LEWIS, 1996).
The dimensionless parameter of stratification used by Hansen and Rattray (1966) in their stratification-circulation diagram for the classification of estuaries is a parameter that is simple to obtain and widely used (DYER 1973, 1986, 1997; OFFICER, 1976; PRITCHARD, 1989). The stratification parameter is usually calculated based on the variation in salinity. In this case, the density was utilized to allow comparison with other parameters indicative of the vertical structure. For purposes of estuarine classification, this parameter is calculated averaging over one or more tidal cycles. However, its calculation for instantaneous values allows one to visualize the vertical structure's changing during the different stages of the tide.
The stratification parameter e is calculated by
= (1)
where is the bottom density; is the surface density; and ̅ is the depth averaged density. For homogeneous conditions, ε = 0, whereas under conditions of maximum vertical density stratification, the amount of vertical variation will be approximately 0.025.
A characteristic parameter indicative of stratification is the buoyancy frequency (or Brunt-Väisälä), N, given by
= − (2)
where g is the gravity acceleration and z is the depth. In a stable water column, N > 0, which indicates that a parcel displaced vertically will tend to return to its level of hydrostatic equilibrium and, depending on the potential energy gain, will oscillate around the resting level with a frequency of N. The greater the stratification, the higher the value of N; the smaller the value of N, the greater the kinetic energy consumption involved in the production of turbulent mixing, which leads to vertical homogenization. The highest values of N are usually found in the area of the pycnocline, which coincides with the halocline in the case of coastal waters or estuaries (POND; PICKARD, 2003).
A third way to evaluate the stratification of the water column is using the anomaly of potential energy, , calculate by
=ℎ ℎ − ̅ (3)
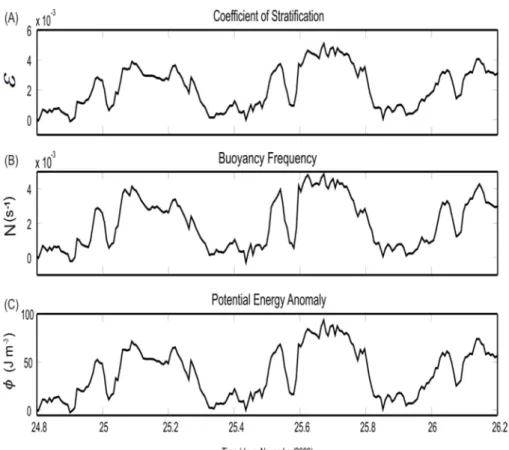
where h is the depth. This parameter measures the energy required to completely mix the water column (J m-3). For homogeneous conditions, the value of will be near zero. Its value increases with stratification; typical values are of the order of tens. The variability of the anomaly of potential energy is understood as the energy balance during each tidal cycle (LEWIS, 1996). While the average level of the tide is used as a reference for zero potential energy, the elevations or depressions in the tidal cycle represent the variation of the potential energy stored in the system. The maximum potential energy occurs at high tide, when the anomaly is minimal, and the water column is vertically homogeneous, as indicated by e and N. Figure 9 shows the temporal variation of quantitative indices of stratification. All three indices exhibited very similar temporal variation, differing only in terms of the scale of variation in the units. The coefficient of stratification ranged between 0.11x10⁻³ and 5.1x10⁻³. The buoyancy frequency ranged between -3.07x10⁻⁴ and 48x10-4 s-1. The anomaly of potential energy (Fig. 9C) ranged from 0 to 93 J.m-3. The relationship between all of these parameters is strongly linear (Fig. 10); the correlation coefficients are close to 1 between N and φ and between SP and N and equal to 1 between SP and φ (Table 2).
Fig. 9. Temporal variation during the anchoring of: A. the coefficient of stratification, B. the frequency of thrust and C. the potential energy anomaly.
Fig. 10. Relationship between: A. the stratification parameter (SP) and potential energy anomaly, φ; B. the frequency between the thrust, N and φ; and C. SP and N.
Table 2. Linear regressions between SP, N and φ.
Relationship Adjustment Equations r²
SP x 0.0002 x + 0.03 1
N x 0.0002 x + 3.93 0.97
SP x N 1.014 x – 0.0002 0.97
operation of the Castanhão Weir has completely changed the past seasonality characteristics, as shown in Figure 6. This is indicated by the low salinity values recorded during the experiment, increased stratification during periods of low water and the general vertical distribution pattern, which exhibits a partially stratified salinity type (e.g., PRITCHARD, 1989). In this type of estuary, water mixing occurs between fresh and marine waters. The effect of tidal turbulence on stratification breakdown is balanced by the buoyancy flux resulting from the advection of less-dense river water. It is expected that during spring tide conditions the vertical salinity structure should become less stratified or even well mixed due to stronger tidal currents and vertical mixing - with the reestablishment, therefore, of the stratified vertical structure in the next neap tide period.
The sedimentary processes in estuaries are determined by density gradients, waves, tides, energy dissipation regarding the influx of the river and meteorological forces (DAVIS, 1985; DYER, 1995). The balance between the processes related to tides and river advection results in an environment in which there is high retention of materials, characteristic of partially stratified and well-mixed estuaries (DYER, 1995). In the case of Jaguaribe River, after the construction of the Castanhão Weir, a synodical modulation of partially mixed conditions at neap-tides and well-mixed conditions at spring-tides are to be expected. In both cases, high trapping efficiency is to be expected, due to the gravitational circulation in the former case, and to the tidal pumping in the latter case. Before the construction of the Castanhão Weir, the export of materials to the continental shelf was to be expected yearly during the flood peaks in the rainy season. Nowadays, such exportation is only to be expected during extreme rainy events that are capable of filling the weir and making the opening of the floodgates unavoidable. The last time this occurred was in 2009, as a consequence of a marked ’La Niña’ period.
C
ONCLUSIONSThe Jaguaribe estuary is an example of system alteration by virtue of global changes, mainly due to anthropogenic effects rather than climatic ones. The semi-arid climate with its prolonged droughts encouraged the construction of weirs for water storage and river flow regulation. Today, river inflow into the estuary is perennial at an almost constant rate throughout the year. Extreme conditions, whether of flood or null discharge no longer exist. Estuary dynamics are now driven mainly by the tides which present synchronous behavior.
The vertical stratification of density varies over the tidal cycles. A vertically homogeneous
structure is observed during flood and high tide, and a highly stratified structure is detected during ebb and low tide. The general pattern of stratification corresponds to a partially stratified estuary type. The stratification indexes, stratification parameter, buoyancy frequency and potential energy anomaly, showed almost identical behavior with differences only of the order of magnitude of the respective values.
The effect of perennial river discharge enhances the filtering capability of the estuary in two ways: by avoiding the extreme flooding events by the creation of reservoirs, and by the maintenance of a continuous river discharge even during the dry period, which maintain an active estuarine gravitational circulation at neap tides and lead to tidal pumping during spring tides. The export of materials to the continental shelf will occur only under extreme conditions, such as during marked ’La Niña’ periods when excessive rain is to be expected.
A
CKNOWLEDGEMENTSThe authors would like to thank Arnoldo Valle-Levinson and the anonymous reviewer for their useful comments; Luiz Jose Cruz Bezerra for his assistance in data collection activities during the experiment. This study was supported by CNPq / INCT-TMCOcean [Transport of Materials at the Continent-Ocean Interface, Transporte de Materiais na Interface Continente Oceano] and CAFS - CNPq 306772/2010-8. The Ceará Foundation of Meteorology [Fundação Cearense de Meteorologia, FUNCEME] provided rainfall data. The National Water Agency [Agência Nacional de Águas, ANA] provided available dataflow through HIDROWEB.
R
EFERENCES
ALBER, M. A conceptual model of estuarine freshwater inflow management. Estuaries, v.25 (6B), p. 1246-1261, 2002.
ANDREOLI, R. V.; KAYANO, M. T. A importância relativa do Atlântico tropical sul e Pacífico leste na variabilidade de precipitação do nordeste do Brasil. Rev. Bras.
Meteorol. vol.22, n.1, p. 63-74,2007.[online].
CAMERON, W. N.; PRITCHARD, D. W. Estuaries. In:GOLDBERG, E. D.; MCCAVE, I. N.; O’BRIEN, J. J.; STEELE, L. H. (Ed.) The Sea. New York: John Wiley, 1963. p. 306-324.
CAMPOS, A. A. A zona costeira do Ceará: Diagnóstico para a gestão integrada. Fortaleza: Aquasis,2003.248 p. DAVIES, J. L. Geographical variation in coastal
development. New York: Hafner, 1973.204 p.
DAVIS Jr., R. A. Coastal sedimentary environments. Springer, New York, N. Y., 2nd ed., 1985.
DYER, K. R. Sediment transport processes in estuaries. In: PERILLO, G. M. E. (Ed.). Geomorphology and
sedimentology of estuaries. New York: Elsevier,
1995.p.423-449,
DYER, K. R. Coastal and estuarine sediment dynamics., Chichester, NY: John Wiley,1986.232 p.
DYER, K. R. Estuaries: A physical introduction. 2nd ed. Chichester, NY: John Wiley, 1997. 195 p.
DYER, K. R. Estuaries: A physical introduction. London: John Wiley, 1973.140 p.
DYER, K. R. Fine sediment particle transport in estuaries. In: DRONKERS, J.; LEUSSEN, W. VAN. Hydrodinamics
of estuaries. Berlin: Springer Verlag, 1998. p. 295-310.
FIGUEIREDO, M. C. B. DE et al. Impactos ambientais do lançamento de efluentes da carcinicultura em águas interiores. Eng. Sanit. Ambient., v. 10, n.2, p. 167-174, 2005. [online].
FOFONOFF, N. P. Physical properties of seawater: A new salinity scale and equation of state of seawater. J. Geophys. Res., v. 90(C2), p. 3332-3342, 1985. FOFONOFF, N. P.; MILLARD, R. C. Algorithms for
computation of fundamental properties of seawater.
UNESCO Tech. Pap. Mar. Sci., n. 44, 1983, 53 p,
FUCK JUNIOR, S. C. F. Subsídio à gestão ambiental: Descrição fisiográfica e análise funcional das bacias hidrográficas do Ceará. Geoambiente-Online, Jataí, GO, n. 10, 2008.
GENZ, F.; LESSA, G. C.; CIRANO, M. Vazão mínima para estuários: um estudo de caso do Rio Paraguaçu/BA. Rev.
Bras. Recurs.Hidr., v. 13, p. 73-82, 2008.
GEYER, W. R.; TROWBRIDGE, J. H.; BOWEN, M. The dynamics of a partially mixed estuary. J. Phys.
Oceanogr., v. 30, n. 8, p. 2035-2048, 2000.
HANSEN, D. V.; RATTRAY, M. New dimensions in estuary classification, Limnol. Oceanogr., 11, 319–326, 1966 LEWIS, R. Relative contributions of interfacial and bed
generated mixing to the estuarine energy balance. In: PATTIARATCHI, C. (Ed.). Mixing inestuaries and
coastal seas. Washington, D .C.: American Geophysical
Union, 1996. p. 250-266. (Coastal and Estuarine Studies, v. 50).
MIRANDA, L. B.; CASTRO, B. M.; KJERFVE, B.
Princípios de Oceanografia Física de estuários. São
Paulo: EDUSP, 2002. 414 p.
NICHOLS, M.M.; BIGGS, R.B. Estuaries. In: DAVIS JR., R.A. (Ed.) Coastal sedimentary environments. New York: Springer Verlag, 1985 p.77-186.
OFFICER, C. B., Physical Oceanography of estuaries and associated coastal waters. New York: John Wiley, 1976.465 p.
POND, S.; PICKARD, G. L. Introductory dynamical
oceanography. 2. ed. Oxford; New York: Pergamon
Press, 2003.
PRITCHARD, D. W. Estuarine classification: A help or hindrance. In: NEILSON, B.J.; KUO, A.; BRUBAKER, J. (Ed.). Estuarine circulation.Clifton, N. J.: Humana Press, 1989.
PUGH, D. Changing sea levels: Effects of tides, weather and climate. Cambridge: Cambridge University Press, 2004. 265 p.
REDDERING, J. S. V. Prediction of the effects of reduced river discharge on the estuaries of south-eastern Cape Province, South Africa. S. Afr. J. Sci., v. 86, p.425-428, 1988.
SCHETTINI, C. A. F. Caracterização física do Estuário do Rio Itajaí-açu, SC. Rev. Bras. Recurs. Hídr., v.7, n.1:, p. 123-142, 2002a.
SCHETTINI, C. A. F. Near bed sediment transport in the Itajaí-Açu River Estuary, southern Brazil. In: WINTERWERP , J.C.; KRANENBURG, C. (Ed.).
Fine sediment dynamics in the marine environment.
New York: Elsevier, 2002b.p 499-512.
SCHETTINI, C. A. F.; MAIA, L. P.; TRUCCOLO, E. C. Análise da variabilidade do nível da água na costa de Fortaleza, Ceará. Arq.Ciênc. Mar,Bras., v. 44, n. 1, p. 27-32, 2011.
SCHETTINI, C. A. F.; MIRANDA, L. B. Circulation and suspended particulate matter transport in a tidally dominated estuary: Caravelas Estuary, Bahia, Brazil.
Braz. J. Oceanogr., v. 58, n. 1, p. 1-11, 2010.
SCHETTINI, C. A. F.; RICKLEFS, K.; TRUCCOLO, E. C.; GOBIG, V. Synoptic hydrography of a highly stratified estuary. Ocean Dynam., v. 56, p. 308-319, 2006. SCHUBEL, J. R.; CARTER, H. H. The estuary as a filter for
fine-grained suspended sediment. In: KENNEDY, V. S. (Coord.).The estuary as a filter. New York: Academic Press, 1984. p. 81-105.
SIMPSON, J. H.; WILLIAMS, E.; BRASSEUR, L. H.; BRUBAKER, J. M. The impact of tidal straining on the cycle of turbulence in a partially stratified estuary. Cont.
Shelf Res., v. 25, n. 1, p.51-64, 2004.
SKLAR F. H.; BROWDER, J. A. Coastal environmental impacts brought about by alterations to freshwater flow in the Gulf of Mexico. Environ. Manag., v. 22, n. 4, p. 547-562, 1998.
VERÍSSIMO, L. S.; MEDEIROS M. F.; SOUZA, J. F.; ANDRADE, F. T. B. Avaliação das potencialidades
hídrica e mineral do médio-baixo Jaguaribe-CE.
Fortaleza: CPRM/Programa de gestão e administração territorial, 1996.89 p.
WOLANSKI, E.; RIDD, P. Tidal mixing and traping in mangrove swamps. Estuar. Coast. Shelf Sci., v. 23, p: 759-771, 1986.