*Correspondence: Jianguo Wen. The First Affiliated Hospital. Depart-ment of Chemistry. Zhengzhou University. Zhengzhou, China. E-mail: [email protected]
Article
vol. 51, n. 2, apr./jun., 2015 http://dx.doi.org/10.1590/S1984-82502015000200020
A simple and sensitive method for determination of Norfloxacin in
pharmaceutical preparations
Zhuo Ye, Le Wang, Jianguo Wen
*The First Afiliated Hospital, Department of Chemistry, Zhengzhou University, Zhengzhou, China
In this approach, a new voltammetric method for determination of norloxacin was proposed with high
sensitivity and wider detection linear range. The used voltammetric sensor was fabricated simply by
coating a layer of graphene oxide (GO) and Naion composited ilm on glassy carbon electrode. The advantage of proposed method was sensitive electrochemical response for norloxacin, which was attributed to the excellent electrical conductivity of GO and the accumulating function of Naion under
optimum experimental conditions, the present method revealed a good linear response for determination of
norloxacin in the range of 1×10⁻⁸ mol/L–7×10-6 mol/L with a detection limit of 5×10⁻⁹ mol/L. The proposed
method was successfully applied in the determination of norloxacin in capsules with satisfactory results.
Uniterms: Norfloxacin/determination. Graphene oxide. Nafion. Voltammetry/differential pulse.
Pharmaceutical formulations/quantitative analysis.
Propos-se, por essa abordagem, novo método voltamétrico, com alta sensibilidade e faixa linear de
detecção mais ampla, para a determinação de norloxacino. O sensor voltamétrico utilizado foi fabricado simplismente por cobertura de camada de óxido de grafeno (GO) e ilme de Naion em eletrodo de cabrono vítreo. A vantagem do método proposto foi a resposta eletroquímica sensível para o norloxacino, atribuída à condutividade elétrica excelente do GO e à função acumulada do Naion. Sob condições experimentais ótimas, o presente método revelou boa resposta linear para a determinação do norloxacino na faixa de limite de detecção de 1×10⁻⁸ mol/L–7×10-6 mol/L. O método proposto foi aplicado com sucesso na
determinação de norloxacino em cápsulas, com resultados satisfatórios.
Uniterms: Norloxacino/determinação. Óxido de grafeno. Naion. Voltametria de pulso diferencial. Formulações farmacêuticas/análise quantitativa.
INRODUCTION
Norfloxacin, 1-ethyl-6-fluoro-1,4-dihydro-4-oxo-7-(1-piperazinyl)-3-quinolonecarboxylic acid (NFX), is considered to be the irst commercially available member
of modern luoroquinolones (Hooper et al., 1986; Zhang et
al., 2013). It is effective against positive and
gram-negative bacteria by inhibition of their NAD gyrase, a critical enzyme to bacterial chromosome replication (Kim, Noh, Park, 2013; Marians, Hiasa, 1997). It is also widely used in treatment of respiratory tract and urinary tract infections
(Leigh, Smith, Marriner, 1984). Therefore, the widespread
use of NFX in clinic and pharmacological study require fast and sensitive analytical methods for its quantitative determination. For this purpose, some methods have been developed for determination of NFX, such as
high-performance liquid chromatography (HPLC) (Samanidou,
Demetriou, Papadoyannis, 2003; Delepine, Hurtaud-Pessel,
Sanders, 1998), spectrophotometry (Rahman, Ahmad,
Hejaz, 2004; Amin, Elsayed, Issa, 1995), spectroluorimetry
(Espinosa-Mansilla et al., 2004; Espinosa-Mansilla et
al., 2005) and capillary electrophoresis (CE) (Barrón et
al., 2003; Barrón et al., 2001). Although these methods
are proven and widely accepted, they require advanced technical expertise and are expensive and time-consuming.
By comparison, electrochemical method is less expensive
real-time detection in clinical and drug control. Based on these
reasons, some electrochemical methods for determination of NFX were developed more recently (Agrawal et al., 2013; Devaraj, Deivasigamani, Jeyadevan, 2013; Moreira, Freitas,
Sales, 2011). Shim and co-workers (Agrawal et al., 2013) used a multi-walled carbon nanotube (MWCNT) modiied pyrolytic graphite (MPG) electrode for determination of
NFX. At this sensor, the detection linear range was from
1.2 × 10⁻⁶ mol/L to 1.0 × 10⁻³ mol/L with detection limit
of 4.06 ×10⁻⁸ mol/L. Devaraj, Deivasigamani, Jeyadevan
(2013) reported a CuO nanoleaves composited MWCNTs
film modified electrode for determination of NFX with
detection limit of 3.21×10⁻⁷ mol/L and linear range of
1×10⁻⁶ ~ 4.77×10⁻⁵ mol/L. Some of the described methods for determination of NFX possess enough sensitivity, but
usually have narrow linear range, and vice versa. So to
develop a new electrochemical method for determination of NFX with high sensitivity and wider linear range is still
interesting and signiicant.
Because of its excellent conductivity and good chemical stability (Stankovich et al., 2006; Chattopadhyay
et al., 2008), Graphene oxide (GO) is widely used as
nanomaterials in chemically modiied electrode. As a kind
of new voltammetric sensor, it possess excellent properties in sensitive sensing for many analytes, such as dopamine and paracetamol (Cheemalapati et al., 2013), cancer markers (Wu et al., 2014), glucose (Yang et al., 2013) and so on. In experiment, we found that GO composited
Naion ilm modiied glassy carbon electrode (GO/Naion/
GCE) had sensitive voltammetric response for NFX.
Based on this property, a new voltammetric method for
determination of NFX was proposed with high sensitivity and wider detection linear range. In investigation, the
long-time stability of GO/Naion/GCE was from the good ilm-forming property of Naion, which stably ixed the
GO on GCE surface. The high sensitivity of detection was from both the good electrochemical response of GO and accumulating action of Nafion for NFX. The
wider detection linear range might proit from the large surface area of GO/Naion ilm. Finally for appraising the
accuracy of proposed method, determination of NFX was performed in NFX capsules with standard content and the results were satisfactory.
MATERIAL AND METHODS
Reagents and chemicals
Naion (5%, w/v in alcoholic solution) was purchased from Alfa and diluted to 0.1% (w/v) with ethanol before
use. Norfloxacin (NFX) was purchased from National
Institutes for Food and Drug Control and used as received.
Stock solution of NFX (1×10⁻³ mol/L) was prepared
using 0.1 mol/L hydrochloric acid. All other chemicals
used were of analytical grade and the experimental water
was double-distilled. Sulfuric acid (pH 1.2) was used as
supporting electrolyte.
Apparatus
The electrochemical measurements were performed
with a RST5000 electrochemical system (Zhengzhou Shiruisi Instrument Co. Ltd., China), and a CHI650A
electrochemical workstation (CHI Instrumental,
Shanghai, China) was used for the EIS measurements.
All experiments were carried out using a conventional
three-electrode system. A bare or modiied GCE (working
area 3mm2) served as working electrode, a platinum wire and an Ag/AgCl electrode were employed as the auxiliary
and reference electrodes, respectively. 5500 Atomic Force Microscopy (Agilent, United States) was employed to
characterize the morphology of GO.
Preparation of film-modified GCE
Graphite oxide was synthesized using graphite power mainly according to the method described in literature (Kovtyukhova et al., 1999). Then exfoliation of graphite oxide to GO was carried out by ultrasonicating
of the dispersion for 40 min (1000 W, 20% amplitude)
according to the reference (Ehret; Baumann; Brischwein,
1997). A homogeneous aqueous dispersion of GO (2.3 mg mL-1) was obtained as a result. For preparation
of GO/Nafion modified electrode, GO (0.5 mL) was added in 4.5 mL Naion ethanol solution (0.1%, w/v) and kept sonicating for 30 min. The GO/Nafion composite solution was obtained. Before modiication, a bare GCE was irst treated according to standard methods and then
cleaned ultrasonically with 1:1 nitric acid, alcohol and double-distilled water sequentially, dried under nitrogen
atmosphere. The GO/Naion modiied GCE was fabricated by dropping 5μL GO/Nafion composite solution on
the GCE surface and dried naturally. A symbol of GO/
Naion/GCE was denoted for this ilm electrode, which was preserved in 0.01 mol/L phosphate solution (pH 7.0)
under 40C when it was not used. For comparison, a Naion modified GCE was fabricated using the same way and
named Naion/GCE.
Analytical procedure
was used as supporting electrolyte in determination of NFX. The accumulation step was carried out under
open-circuit while stirring the solution for 120 s, and then the differential pulse voltammetry (DPV) from 0.50 to 1.65 V were performed after 5 s quiet time. Between two
determinations, the solution needs to be agitated a while for reviving the electrode surface. Thus, the oxidation peak current in the first anodic sweep was used in all data studies. All measurements were carried out at room temperature (25 ±1 oC).
Procedure for pharmaceutical preparations and sample analysis
The average capsule weights was calculated
from the weight of 10 capsules. An accurate weight of sample containing 100 mg NFX was weighed from the
homogenized power and then the sample was diluted to
100 mL with 0.01 mol/L HCl. The mixture was iltered, and 1 mL of the iltrate solution was diluted to 50 mL, then 0.1 mL of this dilute sample was transferred to the voltammetric cell containing 10 mL of H2SO4 (pH 1.2). The differential pulse voltammetry (DPV) were then
performed after 120 s preconcentration time at open circuit
condition. The content of NFX in capsule was determined referring to the regression equation.
RESULTS AND DISCUSSION
The morphology of synthetic GO
The GO slice was made according to the reference (Kovtyukhova et al., 1999). The structure and morphology of obtained GO was observed by the atomic force
microscope (AFM) technique. Figure 1 shows the GO
sheet, which was almost single-layer and approximately 1 nm in thickness.
Characterization of fabricated GO/Nafion/GCE
The K3[Fe(CN)6] is usually used as an electrochemical
probe to characterize the properties of modiied electrode
surface. Figure 2 shows the relative cyclic voltammograms (CVs) of K3[Fe(CN)6] (2×10⁻³ mol/L containing 0.1 mol/L
KCl) with three different electrodes (bare GCE, Naion/
GCE, GO/Nafion/GCE). A pair of well-defined redox peaks was observed at the bare GCE (curve a). After
modifying the GCE with Naion, no recognizable redox
peak was observed (curve b), which could be attributed to the electrostatic interaction between negatively charged Nafion and Fe(CN)63-, blocking the Fe(CN)
6
3- reached
FIGURE 1 - Image of GO from its dilute aqueous dispersion on
freshly cleaved mica characterized by AFM.
F I G U R E 2 - C y c l i c v o l t a m m o g r a m s o f K3[ F e ( C N )6] (2.0 × 10⁻³ mol/L) at (a) bare GCE, (b) Naion/GCE, (c) GO/ Naion/GCE. Supporting electrolyte: 0.1 mol/L KCl solution; Scan rate: 0.1 V s-1.
electrode surface. However, when little of GO was mixed in the Nafion film (GO/Nafion/GCE), a pair of redox peaks was apparent again (curve c), showing GO excellent electrochemical conductivity toward the rare ferricyanide diffused to the electrode surface.
Next, the electrochemical impedance spectroscopy
(EIS) was employed again to evaluate the fabricated electrodes. The EIS is an effective method for
Figure 3 shows the Nyquist plots of EIS obtained in 5.0 × 10⁻³ mol/L Fe(CN)
64−/3− (1:1) containing 0.10 mol/L
KCl with bare GCE (a), Naion/GCE (c) and GO/Naion/
GCE (b) respectively. It can be seen that the electron transfer resistance (Rct) of the Nafion/GCE was much larger than that of the bare GCE(a), demonstrating that
Naion blocked the [Fe(CN)6]
3-/4- to the electrode surface
effectively. However, the Rct decreased remarkably when
a little of GO was mingled in Naion ilm, suggesting the
GO possessed good conductivity and made the electron
transfer easier. By itting the data using an appropriate equivalent circuit, the Rct obtained was about 250 Ω, 3362 Ω, and 2228 Ω for GCE, Nafion/GCE and GO/ Naion/GCE, respectively. These data demonstrated that the electrode was modiied just as design.
Electrochemical behavior of NFX at GO/Nafion/ GCE
Figure 4 shows the cyclic voltammetric responses of
NFX (1×10⁻⁶ mol/L) at bare GCE (Figure 4a), Naion/GCE
(Figure 4b) and GO/Naion/GCE (Figure 4c) in H2SO4
medium. Figure 4d is a CV curve of GO/Naion/GCE in
blank solution. Under the same conditions, a relative weak anodic peak of NFX was observed at the bare GCE with peak potential of 1.341V, and the peak currents increased strikingly at both Nafion/GCE and GO/Nafion/GCE.
Especially using the GO/Naion/GCE, the peak current was signiicantly higher and the peak potential shifted
to 1.325 V. The reasons for the notable sensitivity of the
NFX reaction at the GO/Naion/GCE may be summarized
as follows: (1) NFX becomes positively charged (protonation) in the H2SO4 medium, and the GO/Naion/
GCE contains the cation exchanger of Naion, which has
an enriched ability due to an electrostatic interaction;
(2) the interfusion of GO into Naion would provide an
effective means to improve the sensitivity due to the excellent conductivity of GO. The peak current enhanced and peak potential negatively shifted demonstrate the excellent electrochemical response of GO toward NFX.
Without any doubt, the synergetic functions of Naion and
GO make contributions to the higher sensitivity for NFX
as well as long-term stability of modiied electrode.
It also showed that no reduction peak was observed in the reverse scan, suggesting that the electrochemical reaction of NFX was an irreversible process. For continuous cyclic
scan, the best anodic peak was only obtained in the irst
cycle and the peak current decreased in following cycles, and tends to disappear completely (data not shown). This result demonstrated that the product of NFX oxidization was electro-inactive and adsorbed on the electrode surface to passivate the electrode. To renovate the electrode surface, a very simple method was discovered, that is, agitating the solution for about 1min after a sweep and the peak current
would be revived as the irst cycle again in next scan. Thus, the oxidation peak current in the irst anodic sweep was used
in following experiments.
Influence of supporting electrolyte and pH
The electrode response of NFX might be affected
by supporting electrolyte and the solution pH. Some electrolytes, such as phosphate buffer, Britton-Robinson,
acetate buffer, ammonium-hydrochloric buffer, H2SO4 and HCl were investigated and the best results was obtained in
FIGURE 3 - Nyquist plots of 5.0×10⁻³ mol/L Fe(CN)
64−/3− (1:1) with 0.10 mol/L KCl recorded at bare GCE (a), Naion/GCE (c) and GO/Naion/GCE (b).
FIGURE 4 - Cyclic voltammograms of NFX (1×10⁻⁶ mol/L) at: (a) Bare GCE; (b) Naion/GCE and (c) GO/Naion/GCE. (d): GO/Naion/GCE in a blank solution. Supporting electrolyte:
H2SO4 solution. Then, the electrode response of NFX was investigated in different pH of H2SO4 solution from 1.20 to 2.56. As shown in Figure 5, the peak currents decreased and peak potentials shifted negatively by increasing of solution pH, meaning that the electrode reaction of NFX oxidation was a losing proton process. pH 1.2 H2SO4 solution was selected as the optimal supporting electrolyte and used throughout following study.
Abstracting the data from Figure 5, the relationship between peak potentials and solution pH was linear with
a slope of 0.0624. These data elucidated that the electron
number and the proton number taking part in this reaction was equal.
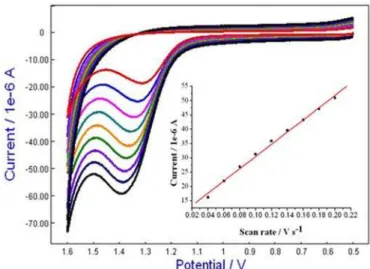
Influence of scan rates
The effect of scan rate (v) on the peak currents and potentials of NFX oxdation was further investigated in a wide range. Figure 6 shows the superimposed voltammograms under different scan rates. The solution need to be agitated about 1min between two cyclic scans. Obviously, the anodic peak potential shifted towards more positive and the peak currents enhanced markedly as the scan rate increasing. The peak current showed a linear relationship with respect to the scan rates (inset), indicating
the oxidation process of NFX at the GO/Naion/GCE was adsorption-controlled. Based on Laviron’s theory (Laviron
et al., 1979), the ip~v relation can be described as following
equation: ip=n2F2vAΓ/4RT=nFQv/4RT. From this equation,
we know that the electron number (n) can be calculated as long as the peak current (ip) and peak area (Q) are obtained under certain scan rate (v). Based on this theory, a value of
n=2 was calculated. Similarly, for an irreversible electrode
reaction driven by adsorption, the following equation is taken from Laviron theory (Laviron, 1979):
v K
anF RT
anF RT E
E S
P = + ln ⋅
0 (1)
From the slope of the straight line of Ep against lnv,
αn= 0.94 could be obtained. Thus, the value of α (charge transfer coeficient) was 0.47. Meanwhile, the value of
ks of 0.28 s-1 was calculated from the intercept of E p vs. lnv straight line. The value of o'
E was determined to be
1.045 V from intercept of Ep versus v plot on the ordinate by extrapolating the line to be v = 0.
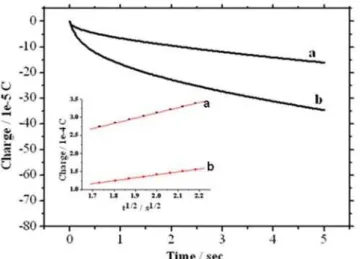
Determination of saturating absorption capacity
For an adsorptive controlled electrode process, it is necessary to calculate the saturating absorption capacity (G*) of analyte on the electrode surface, which is related with the maximum peak current in determination. The chronocoulometry is the best technique to do this work.
For this system, the GO/Naion/GCE was immerged in a NFX solution (1×10⁻⁶ mol/L) for several minutes to achieve
saturated absorption. And then, a step potential from 0.5 V
to 1.5 V was applied and Q~t curve was recorded (Figure 7, curve b). For comparison, Q~t curve was also recorded in blank sulfuric acid solution (Figure 7, curve a). The corresponding Q~t1/2 plots were also performed and shown as an inset in Figure 7. From the inset, the Q~t1/2 curves of a and b were almost parallel, meaning that the diffusion was
FIGURE 5 - The cyclic voltammograms of NFX (1.0×10⁻⁶ mol/L) at GO/Naion/GCE in different pH solution of H2SO4 (a → e): 1.20, 1.46, 1.65, 2.10, 2.34; Scan rate: 0.05 V s-1. The
insert is the Ep~ pH relation.
non-existent during the NFX electrode process. According to the formula given by Anson (Anson, 1964):
ads dl 2
/ 1
2 / 1
c(Dt) nFA 2
Q Q +
+
= (2)
Qdl is double-layer charge; Qads is the Faradaic charge due to the oxidation of adsorbed NFX, which is
the intercept difference of curves a and b. Using Laviron’s
theory of Q = nFAΓ*, a value of 7.2×10⁻¹¹ mol/mm2 was calculated for Γ*, which was the saturating absorption
capacity of NFX at the GO/Naion/GCE surface.
Analytical applications and methods validation
Influence of accumulation time
For consideration of adsorption of NFX on the GO/
Naion/GCE surface, an accumulation step could be used
for increasing the detection sensitivity. It was important
to ix the accumulation time (tacc) for an adsorption-driven electrode process. In this investigation, a concentration of
1×10⁻⁷ mol/L NFX solution was used and the peak currents were linearly increased with tacc prolonging within 10 s
to110 s. Then, a platform was appearance. However, to obtain lower detection limit, 120 s was selected as the tacc in this investigation. The potential during the accumulation
period was little effect on the peak current. So the tacc of
120 s was carried out under open circuit for investigating
the calibration curve in following experiment.
Calibration curve, stability and reproducibility
In investigating the calibration curve, the differential pulse voltammetry (DPV) was employed during the
stripping process for enhancing the detection sensitivity. Under the optimized conditions mentioned above, a good linear relationship between ip and NFX concentrations
was obtained in the range of 1.0×10⁻⁸ ~ 7.0×10⁻⁶ mol/L. A superimposed DPV curves (part curves shown) was shown in Figure 8 and the linear relation was also shown in Figure 8 as an inset. The linear regression equation and
correlation coeficient were:
ip (µA) = -0.343 + 3.469 C(µM) (R= 0.9978)
where ip was the oxidation peak current in µA and C
was the concentration of NFX in µmol/L. Based on the signal-to-noise ratio of 3 (S/N=3), the detection limit was calculated as 5×10⁻⁹ mol/L. The values of 5×10⁻⁹ mol/L detection limit and 3.469 µA/pµM current response
demonstrate the high sensitivity of proposed method.
Compared with some reported analytical methods
(Table I), the proposed GO/Naion/GCE is more sensitive
with wider linear range. The comparison of this work with others (Agrawal et al., 2013; Devaraj, Deivasigamani, Jeyadevan, 2013; Moreira, Freitas, Sales, 2011) showed the advantage of GO added. This research demonstrate again that GO is an excellent modification material in voltammetric sensor.
The intra-assay precision of the GO/Nafion/ GCE response for NFX was evaluated by assaying one
modiied electrode for ten replicate determination of NFX (1×10⁻⁶ mol/L). The relative standard deviation (RSD) of
the peak currents was calculated to be 2.2%. Similarly, the
FIGURE 7 - Chronocoulometric curves of the background (curve
a) and 1.0×10⁻⁶ mol/L NFX (curve b) at GO/Naion/GCE; Inset
shows the relationship of the corresponding Q-t1/2 plots.
FIGURE 8. Superimposed DPV curves of NFX with different concentrations ( a → i ): 1×10⁻⁸ mol/L, 1×10⁻⁷ mol/L, 5×10⁻⁷ mol/L, 1×10⁻⁶ mol/L, 2×10⁻⁶ mol/L, 3×10⁻⁶ mol/L, 4×10⁻⁶ mol/L, 6×10⁻⁶ mol/L, 7×10⁻⁶ mol/L. Inset: linear relationship of NFX
TABLE I - Merits of comparable methods for determination of norloxacin
Method Detection limit
(mol/L)
Analytical range (mol/L)
Comments Reference
Spectrophoto-metry 3.5×10⁻⁷ 9.4 × 10⁻⁶ – 3.1 × 10⁻⁵ ternary formation with eosin
and palladium(II)
(Walily et al., 1996)
HPLC 6.8× 10⁻⁶ 1.6 × 10⁻⁵ – 6.2 × 10⁻⁵ UV-detection at 278 nm (Córdoba-Borrego et al., 1999) CE 1.0 × 10⁻⁶ 3.1 × 10⁻⁵ – 1.6 × 10⁻⁴ UV photo-diode array
detection at 301 nm (Alnajjar et al., 2007)
Voltammetry 4.06× 10⁻⁸ 1.2×10⁻⁶ – 1.0 × 10⁻³ multi-walled carbon nanotube
modiied GCE (Agrawal et al., 2013)
Voltammetry 3.21× 10⁻⁷ 1.0×10⁻⁶– 4.77× 10⁻⁵ multi-walled carbon nanotube
modiied GCE (Devaraj et al., 2013)
Voltammetry 6.25× 10⁻⁵ 7.9×10⁻⁵ – 2.5 × 10⁻³ molecularly-imprinted
materials as sensor
(Moreira et al., 2011)
Voltammetry 5.0 × 10⁻⁹ 1.0×10⁻⁸ – 7.0 × 10⁻⁶ Graphene Oxide Modiied
GCE
This work
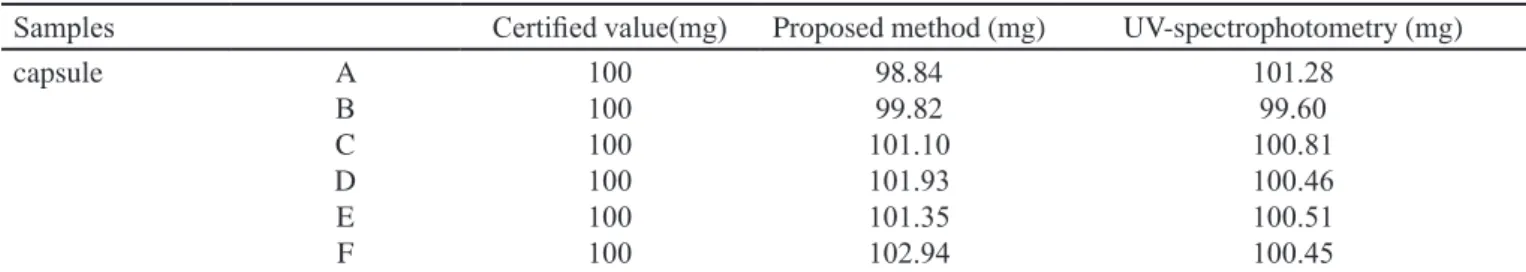
TABLE II - Results for the determination of norloxacin in pharmaceutical formulation
Samples Certiied value(mg) Proposed method (mg) UV-spectrophotometry (mg)
capsule A
B
C D E F
100 100 100 100 100 100
98.84 99.82
101.10 101.93 101.35 102.94
101.28 99.60 100.81 100.46 100.51 100.45
inter-assay precision, or fabrication reproducibility, was
estimated at ive GO/Naion/GCE, which were modiied
in parallel. They were performed for determination of NFX
(1×10⁻⁶ mol/L) in a same solution and the obtained RSD of
current response was 2.8%. The current response of NFX at the GO/Naion/GCE remained 96% of its original response
after one month, showing a longer lifetime and stability.
Interference
The influence of some foreign species on the determination of NFX was evaluated in detail. Expressly, some species possibly exist in biological sample. In
experiment, a ixed amount of 1.0×10⁻⁶ mol/L NFX spiked
with various foreign species was evaluated under the
same experimental conditions. The results showed that 50
fold of uric acid, oxalic acid, citric acid, glucose, tartaric
acid, vitamin C and 500 fold excess of Ca2+, Mg2+, Cu2+,
Zn2+, Fe3+, NO3-, Cl- had no interference on the current
response of NFX (signal change below 5%). It suggested
that the proposed method had good selectivity for the determination of NFX.
Determination of NFX in the medicinal capsules
In order to evaluate the practicality of GO/Naion/
GCE for determination of NFX in pharmaceutical and
drug test, the content of NFX in capsule (Shanghai Yan’an Pharmaceutical Co., Shanghai, China, with ixed
content of NFX) was determined following the procedure
described in Section 2.5. The analytical results were
shown in Table II. Furthermore, in order to evaluate the present method, the same sample was determined by UV-spectrophotometry at 275 nm and the results were also shown in Table II. From the results shown in Table II, we can see that the present method was accurate and it can be recommended for routine analysis in majority of drug quality control laboratories.
CONCLUSIONS
In conclusion, the GO/Nafion/GCE was simply fabricated by coating of GO/Nafion suspension on GCE surface. As a voltammetric sensor, it showed
new voltammetric method for determination of NFX was proposed. The advantages of present method were high sensitivity, wider linear range, good accuracy and precision. The long lifetime stability is another advantage of proposed sensor and it offers a good possibility for extending this method in routine analysis of NFX.
ACKNOWLEDGEMENTS
The authors really appreciate for the financial
support from the National Natural Science Foundation of China (Grant No 81370869).
REFERENCES
AGRAWAL, B.; CHANDRA, P.; GOYAL, R.N.; SHIM, Y. B. Detection of norloxacin and monitoring its effect on
caffeine catabolism in urine samples. Biosens. Bioeletron.,
v.47, p.307-312, 2013.
ALNAJJAR, A.; ABUSEADA, H. H.; IDRIS, A. M. Capillary
electrophoresis for the determination of norfloxacin and tinidazole in pharmaceuticals with multi-response optimization.Talanta, v.72, n.2, p.842-846, 2007.
AMIN, A. S.; ELSAYED, G. O.; ISSA, Y. M. Utility of certain
n-acceptors for the spectrop hotometric determination of
norloxacin.Analyst, v.120, p.1189-1193, 1995.
ANSON, F. C. Application of potentiostatic current integration to
the study of the adsorption of cobait(lll)-( ethylenedinitri1o) tetraacetate on mercury electrodes. Anal. Chem., v.36, n.4, p.932-934, 1964.
BARRÓN, D.; JIMÉNEZ-LOZANO, E.; BAILAC, S.; BARBOSA, J. Simultaneous determination of lumequine
and oxolinicacid in chicken tissues by solid phase extraction and capillary electrophoresis. Anal. Chim. Acta., v.477, n.1,
p.21-27, 2003.
BARRÓN, D.; JIMENEZ-LOZANO, E.; CANO, J.; BARBOSA, J. Determination of residues of enroloxacin and its metabolite ciproloxacin in biological materials by
capillary electrophoresis. J. Chromatogr. B., v.759, n.1,
p.73-79, 2001.
CHATTOPADHYAY, J.; MUKHERJEE, A.; HAMILTON, C. E.; KANG, J. H.; CHAKRABORTY, S.; GUO, W.; KELLY, K. F.; BARRON, A. R.; BILLUPS, W. E. Graphite Epoxide. J. Am. Chem. Soc., v.130, n.16, p.5414-5415, 2008.
CHEEMALAPTI, S.; PALANISAMY, S.; MANI, V.; CHEN, S. M. Simultaneous electrochemical determination
of dopamine and paracetamol on multiwalled carbon
nanotubes/graphene oxide nanocomposite-modiied glassy
carbon electrode. Talanta, v.117, p.297-304, 2013.
CORDOBA-BORREGO, M.; CORDOBA-DIAZ, M.; CORDOBA-DIAZ, D. Validation of a high-performance
liquid chromatographic method for the determination of
norloxacin and its application to stability studies (photo-stability study of norloxacin). J. Pharm. Biomed. Anal., v.18, n.6, p.919-926, 1999.
DELEPINE, B.; HURTAUD-PESSEL, D.; SANDERS, P.Simultaneous determination of six quinolones in pig
muscle by liquid chromatography-atmospheric pressure chemical ionisation mass spectrometry. Analyst, v.123, n.12, p.2743-2747, 1998.
DEVARAJ, M.; DEIVASIGAMANI, R. K.; JEYADEVAN, S. Enhancement of the electrochemical behavior of CuO nanoleaves on MWCNTs/GC composite film modified electrode for determination of norloxacin.Colloids Surf. B: Biointerfaces, v.102, p.554-561, 2013.
EHRET, R.; BAUMANN, W.; BRISCHWEIN, M. Monitoring
of cellular behaviour by impedance measurements on interdigitated electrode structures. Biosens. Bioelectron., v.12, n.1, p.29-41, 1997.
ESPINOSA-MANSILLA, A.; MUNOZ DE LA PENA, A.; GONZALEZ GOMEZ, D.; SALINAS, F. HPLC determination of enoxacin, ciproloxacin, norloxacin and oloxacin with photoinduced luorimetric (PIF) detection
and multiemission scanning: Application to urine and serum. J. Chromatogr. B., v.822, n.1-2, p.185-193, 2005.
ESPINOSA-MANSILLA, A.; MUNOZ DE LA PENA, A.; SALINAS, F.; GONZALEZ GOMEZ, D. Partial least
squares multicomponent fluorimetric determination of
luoroquinolones in human urine samples. Talanta, v.62,
n.4, p.853-860, 2004.
HOOPER, D. C.; WOLFSON, J. S.; SOUZA, K. S.; TUNG, C.; MCHUGH, G. L.; SWARTZ, M. N.Genetic and biochemical characterization of norloxacin resistance in
KIM, J.; NOH, J.; PARK, W. Insight into norloxacin resistance
of Acinetobacter oleivorans DR1: target gene mutation,
persister, and RNA-Seq analyses. J. Microbiol. Biotechnol., v.23, n.9, p.1293-1303, 2013.
KOVTYUKHOVA, N.I.; OLLIVIER, P.J.; MARTIN, B. R.; MALLOUK, T. E.; CHIZHIK, S. A.; VUZANEVA, E. V.; GORCHINSKIY, A. D. Layer-by-Layer Assembly of Ultrathin Composite Films from Micron-Sized Graphite Oxide Sheets and Polycations. Chem. Mater., v.11, n.3, p.771-778, 1999.
LAVIRON, E. General expression of the linear potential sweep Voltammogram in the case of diffusionless Electrochemical systems. J. Electroanal. Chem., v.101, n.1, p.19-28, 1979.
LEIGH, D. A.; SMITH, E. C.; MARRINER, J. Comparative study using norloxacin and amoxycillin in the treatment
of complicated urinary tract infections in geriatric patients.
J. Antimicrob. Chemother., v.13, p.79-83, 1984. Suppl. B
MARIANS, K. J.; HIASA, H. J. Mechanism of Quinolone
Action: A drug-induced structural perturbation of the DNA precedes strand cleavage by topoisomerase IV. Biol. Chem.,
v.272, n.14, p.9401-9409, 1997.
MOREIRA, F. T. C.; FREITAS, V.A. P.; SALES, M. G. F. Biomimetic norfloxacin sensors made of
molecularly-imprinted materials for potentiometric transduction.
Microchim. Acta, v.172, n.1-2, p.15-23, 2011.
RAHMAN, N.; AHMAD, Y.; HEJAZ, S. N.Kinetic
spectrophotometric method for the determination of
norloxacin in pharmaceutical formulations. Eur. J. Pharm. Biopharm., v.57, n.2, p.359-367, 2004.
SAMANIDOU, V.F.; DEMETRIOU, C. E.; PAPADOYANNIS,
I. N.Direct determination of four fluoroquinolones, enoxacin, norfloxacin, ofloxacin, and ciprofloxacin, in pharmaceuticals and blood serum by HPLC. Anal. Bioanal.
Chem., v.375, n.5, p.623-629, 2003.
STANKOVICH, S.; DIKIN, D. A.; DOMMETT, G. H.; KOHLHAAS, K.M.; ZIMNEY, E.J.; STACH,E.A.; PINER, R.D.; NGUYEN, S.T.; RUOFF, R.S. Graphene-based
composite materials. Nature, v.442, p.282-286, 2006.
WA L I LY, A . F. ; B E L A L , S . F. ; B A R K RY, R . S . Spectrophotometric and spectroluorimetric estimation of ciproloxacin and norloxacin by ternary complex formation
with eosin and palladium(II). J. Pharm. Biomed. Anal., v.14, n.5, p.561-569, 1996.
WU, D.; GUO, A. P.; GUO, Z. K.; XIE, L.; WEI, Q.; DU, B. Simultaneous electrochemical detection of cervical cancer
markers using reduced graphene oxide-tetraethylene pentamine as electrode materials and distinguishable redox probes as labels. Biosens. Bioelectron., v.54, p.634-639,
2014.
YANG, J.; YU, J. H.; STRICKLER, J. R.; CHANG, W. J.; GUNASEKARAN, S. Nickel nanoparticle-chitosan-reduced graphene oxide-modiied screen-printed electrodes for enzyme-free glucose sensing in portable microluidic
devices. Biosens. Bioelectron., v.47, p.530-538, 2013.
ZHANG, H. Z.; DAMU GURI, L. V.; CAI, G. X; ZOU, C.-H.
Design, synthesis and antimicrobial evaluation of novel benzimidazole type of Fluconazole analogues and their synergistic effects with chloromycin, norfloxacin and
luconazole. Eur. J. Med. Chem., v.64, p.329-344, 2013.
Received for publication on 14th May 2014