Article
J. Braz. Chem. Soc., Vol. 24, No. 11, 1846-1856, 2013. Printed in Brazil - ©2013 Sociedade Brasileira de Química 0103 - 5053 $6.00+0.00
A
*e-mail: [email protected]
Developing a Sensor for the Simultaneous Determination of
Dopamine, Acetaminophen and Tryptophan in Pharmaceutical Samples Using a
Multi-Walled Carbon Nanotube and Oxadiazole Modified Glassy Carbon Electrode
Navid Nasirizadeh,*,a,b Zahra Shekari,a Hamid R. Zare,c Seied A. Y. Ardakanid and Hamid Ahmare
aScientific Society of Nanotechnology, bDepartment of Textile Engineering, Yazd Branch, cDepartment of Chemistry and dDepartment of Food Science & Technology,
Science and Research Branch, Islamic Azad University, PO Box 89195-741, Yazd, Iran
eDepartment of Chemistry, Faculty of Sciences, Shahid Beheshti University,
PO Box 19839-4716, Tehran, Iran
O presente estudo descreve as características eletroquímicas de um derivado de oxadiazol eletrodepositado sobre um eletrodo de carbono vítreo modificado por nanotubos de carbono de paredes múltiplas (OMWCNT-GCE) e seu papel como sensor eletroquímico altamente sensível para oxidação eletrocatalítica de dopamina (DA). A constante da taxa de transferência de carga
da superfície (ks) e o coeficiente de transferência de carga (α) para a transferência de elétrons
entre GCE e oxadiazol eletrodepositado foram calculados. OMWCNT-GCE exibiu propriedades eletrocatalíticas apropriadas para a oxidação de DA em solução tampão de fosfato (pH 7,0). O
eletrodo modificado exibiu baixo limite de detecção (0,12 µmol L-1) para DA. Em medidas de
voltametria de pulso diferencial (DPV), OMWCNT-GCE pode separar os potenciais de pico de oxidação de DA, acetaminofeno (AC) e triptofano (Trp) presentes na mesma solução, enquanto a GCE forneceu duas respostas amplas. O desempenho analítico deste sensor foi avaliado para determinar DA e AC em amostras reais.
The present study describes the electrochemical characteristics of an electrodeposited oxadiazole derivative on multi-walled carbon nanotubes glassy carbon electrode (OMWCNT-GCE) and its role as highly sensitive electrochemical sensor for the electrocatalytic oxidation of dopamine (DA).
The surface charge transfer rate constant (ks) and the charge transfer coefficient (α) for the electron
transfer between GCE and electrodeposited oxadiazole were calculated. OMWCNT-GCE exhibited suitable electrocatalytic properties for DA oxidation in a phosphate buffer (pH 7.0) solution. The
modified electrode exhibited low limit of detection (0.12 µmol L-1) for DA. In differential pulse
voltammetry (DPV) measurements, OMWCNT-GCE could separate the oxidation peak potentials of DA, acetaminophen (AC) e tryptophan (Trp) present in the same solution, while the bare GCE gave two broad responses. The analytical performance of this sensor was evaluated to determine DA and AC in real samples.
Keywords: glassy carbon electrode, dopamine, acetaminophen, triptophane, multi-walled
carbon nanotubes
Introduction
D o p a m i n e ( DA ) b e l o n g s t o t h e c l a s s o f catecholamines and is a neurotransmitter that plays a very significant role in the central nervous, renal, hormonal and cardiovascular systems.1,2 This compound exists in nervous
tissues and body fluids in the form of large organic cations.
Low level of DA may result in some diseases such as Parkinson, schizophrenia and Alzheimer.3,4 DA acts like
a brain chemical to transmit messages to different parts of the brain. Thus, the determination of DA can be an important factor in biomedical diagnoses.5 In recent
interest.6-9 Acetaminophen (AC) is a widely used antipyretic
drug which serves as an effective and safe analgesic agent in therapeutic practices. It has low toxicity when used at recommended doses. The drug is of worldwide application for the relief of postoperative pain as well as mild to moderate pain associated with headache, backache and arthritis. It is also used to reduce fevers of bacterial or viral origin.10 Moreover, it is known that the drug overdoses will
cause liver and kidney damages.11,12 Therefore, it is very
important to find a simple, fast, sensitive and accurate method for the detection of AC. Various electrochemical methods including differential pulse voltammetry (DPV),13,14 cyclic voltammetry15 and amperometry16 have
been used to determine AC. Tryptophan (Trp) is an amino acid essential to human body functions, a vital constituent of proteins, and an indispensable agent in human nutrition for the establishment and maintainment of a positive nitrogen balance. Due to its scarce presence in vegetables, this compound is sometimes added to diets, food products and pharmaceutical formulas.17,18 Also, it has been
implicated as a possible cause of schizophrenia in people who cannot metabolize it properly. When improperly metabolized, it creates a waste toxic product in the brain, causing hallucinations and delusions.19 So, it is important
to develop a simple, accurate, rapid and inexpensive method for the determination of Trp in pharmaceuticals, clinical analyses and dietetic fields.20 There are many
analytic methods of determining Trp, but those based on electroanalysis are the most remarkable because of their sensitivity, accuracy and simplicity.21,22
A main problem of electrochemical detection of DA in real biological samples is the coexistence of many interfering compounds. It is known that the direct electrooxidation of DA, AC and Trp on bare electrodes requires high potentials. The in vitro studies have indicated that the use of AC protects dopaminergic neurons from the oxidative stress damage caused by acute exposure to higher levels of DA.23 Moreover, DA and AC are oxidized
at nearly the same potentials on bare electrodes. On the other hand, consumption of a mixture of dietary amino acids that omits tryptophan, the precursor of serotonin, leads rapidly to a 70-80% decrease in plasma levels of tryptophan, and a consequent decrease in brain serotonin levels. The tyrosine hydroxylase inhibitor α -methyl-para-tyrosine (AMPT) causes a selective depletion of the catecholamines DA and NA.24 Since these several
species usually coexist in real biological matrixes, the development of a selective and sensitive method to simultaneously determine these compounds is highly worthwhile for analytical applications and diagnostic research. In our previous publication, we had described
the electrochemical properties of an oxadiazole derivative MWCNT (multi-walled carbon nanotubes) modified glassy carbon electrode (OMWCNT-GCE) and its application as a modified electrode for detecting hydrazine.25 The
present study, however, introduces a modified glassy carbon electrode based on another oxadiazole derivative and multi-walled carbon nanotubes. The used oxadiazole derivative has an ortho-hydroquinone moiety (Scheme 1) which this hydroquinone moiety contributes in oxidation/reduction process and acts as a mediator (electrocatalysis system) for electron transfer between DA and MWCNT modified glassy carbon electrode. It seems that using it as a modifier can be important enough to yield some new information about the catalysis of slow reactions. The proposed modified electrode can be used for the electrocatalytic oxidation of DA and the simultaneous determination of DA, AC and Trp. Our findings indicate that OMWCNT-GCE has such distinct advantages as extraordinary stability, high surface charge transfer rate constant and good ability to detect DA. Also, the modified electrode exhibits an amazing ability to simultaneously determine DA, AC and Trp.
Experimental
Reagents and apparatus
An oxadiazole derivative, 4-(5-p-tolyl-1,3,4-oxadiazol-2-ylthio)benzene-1,2-diol, (see Scheme 1 for the structure) was synthesized according to the procedure described before.26 In the present work, we refer to this derivative
as oxadiazole for convenience. DA, AC, Trp, and other reagents were obtained from Merck and used as received. All the chemical reagents were of analytical grades. All the solutions were prepared with doubly distilled water. MWCNT with a diameter of 10-20 nm, length of 5-20 µm and purity of > 95% were purchased from Nanolab Inc. (Brighton, MA). The buffer solution (0.10 mol L-1)
was made up from H3PO4, and the pH was adjusted with
NaOH. DA, AC and Trp solutions were prepared just shortly before use.
All the electrochemical experiments were carried out using an Autolab potentiostat PGSTAT 30 (Eco Chemie Utrecht, Netherlands) equipped with a GPES 4.9 software. The cell used was equipped with a modified glassy carbon
electrode as the working electrode, a platinum electrode as the auxiliary electrode (Azar Electrode Co, Iran) and a saturated calomel electrode (SCE) as the reference electrode. All the potentials in the text are quoted vs. this reference electrode. A personal computer was used for data storage and processing. The pH measurement was performed with a Metrohm model 691 pH/mV meter.
Preparation of OMGCE, MWCNT-GCE and OMWCNT-GCE
Prior to the modification, GCE was carefully polished mechanically with Al2O3 slurry of 0.05 µm on a polishing
cloth and then rinsed with doubly distilled water. After being cleaned, to be electrochemically activated, the electrode was immersed in a 0.1 mol L-1 sodium bicarbonate
solution and was activated by a continuous potential cycling from −1.45 to 1.7 V at a scan rate (ν) of 100 mV s−1
until a stable voltammogram was obtained. To prepare an oxadiazole modified GCE (OMGCE), the activated GCE (AGCE) was rinsed with doubly distilled water and modified by eight cycles of potential scan between 15 and 170 mV at 20 mV s−1 in a 0.1 mol L-1 phosphate buffer
(pH 7.0) solution containing 0.1 mmol L-1 oxadiazole. The
fabrication of MWCNT and OMWCNT-GCE is described as follows. 3.0 µL of MWCNT-DMF solution (1.0 mg mL−1)
was placed directly onto the GCE surface and dried at room temperature to form a MWCNT film at the GCE surface. The preparation of MWCNT led to the modification of the GCE into an MWCNT-GCE. An OMWCNT-GCE was prepared by immersing the MWCNT-GCE in a 0.1 mmol L-1 solution of oxadiazole in a 0.1 mmol L-1
phosphate buffer (pH 7.0), using eight cycles of potential scan between 15 and 170 mV at 20 mV s−1. After the
formation of the oxadiazole film on the MWCNT-GCE surface, the modified electrode was rinsed thoroughly with water and was dipped into the buffer solution for its electrochemical behavior to be tested.
Results and Discussion
Electrochemical characterization of OMWCNT-GCE
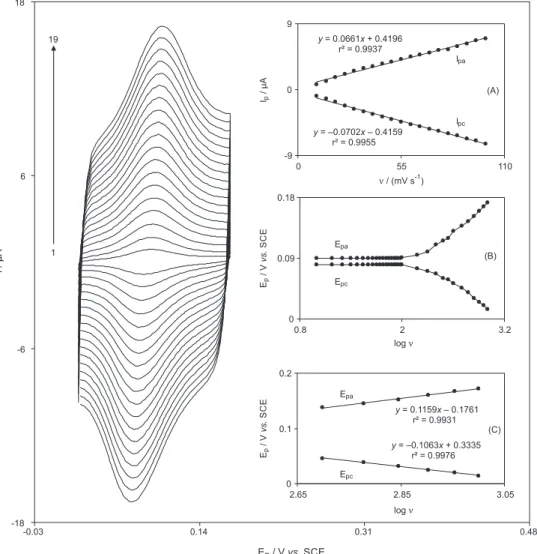
The electrochemical behavior of the modified electrodes was described by cyclic voltammetry. Figure 1 illustrates the cyclic voltammograms of OMWCNT-GCE in a 0.1 mol L-1 phosphate buffer solution (pH 7.0) as the
supporting electrolyte at various potential scan rates. As shown in Figure 1, the ratio of the anodic to cathodic peak currents obtained at various potential scan rates is almost constant, and the separation between the anodic and cathodic peak potentials (∆Ep) is about 45 mV for potential
scan rates below 25 mV s−1. Furthermore, the anodic and
cathodic peak currents increase linearly with the potential scan rate at all the worked scan rates (Figure 1, inset A). When the potential was scanned between –30 and 300 mV, a surface immobilized redox couple was observed with a formal potential (E0’) value of 104 mV. In addition,
the formal potential (E0’) was almost independent of
the potential scan rate for scan rates ranging from 10 to 100 mV s−1, suggesting facile charge transfer kinetics over
this range of scan rates. Figure 1, insets B and C, shows that the values of the anodic and cathodic peak potentials are proportional to log ν for the potential scan rates of 10 to 1000 mV s–1 (Figure 1, inset B) and for the potential scan
rates of 500 to 1000 mV s–1 (Figure 1, inset C). The charge
transfer coefficient (α) and the apparent heterogeneous charge transfer rate constant (ks) for the electron transfer
between the electrode (MWCNT) and a surface confined redox couple of oxadiazole can be evaluated by cyclic voltammetry using the variation of the anodic and cathodic peak potentials as well as the logarithm of scan rates. This calculation is according to the method devised by Laviron.27
Slope = 2.3 RT/(αnαF) (1)
log ks = α log (1 – α) + (1 – α) log α – log (RT/nF ν)
– α (1 – α) nα F ∆Εp/(2.3 RT) (2)
In the above equations, n is the number of electrons involved in the overall redox reaction of the modifier, ν is the potential scan rate, and all the other symbols have their conventional meanings. For high scan rates, theory predicts a linear dependence of Ep upon log ν, which can be
used to extract the kinetic parameters of α and k
s from the
slope and intercept of such plots, respectively. Using these plots at pH 7.0, the equation α = 0.49 was obtained. From the values of ∆Ep corresponding to different scan rates, an
average value of ks was found to be 8.3 ± 0.17 s −1. This
value of ks is comparable to those reported for a modifier
that has a hydroquinone moiety.28-32
both cases might be due to the release of the modifiers that are weakly bonded to MWCNT deposited on the electrode surface and can be separated somewhat easily.
Electrocatalytic activity of OMWCNT-GCE for DA oxidation
In order to test the electrocatalytic activity of the oxadiazole film, the cyclic voltammograms at the OMWCNT modified GCE (OMWCNT-GCE), the oxadiazole modified GCE (OMGCE), the MWCNT modified GCE (MWCNT-GCE), the activated GCE (AGCE) and the bare GCE (BGCE) were obtained in
the absence and presence of 1.0 mmol L-1 DA. The
corresponding currents are presented in Figure 2. Curves a and b of Figure 2 show the cyclic voltammograms of OMWCNT-GCE in the absence (curve a) and the presence of 1.0 mmol L-1 DA (curve b). As expected for a case of
electrocatalytic oxidation, there is an increase in the anodic
peak current at the potential of 109 mV in the presence of DA, whereas the reduction peak current has virtually
Figure 1. Cyclic voltammetric responses of OMWCNT-GCE in a 0.1 mol L-1 phosphate buffer solution (pH 7.0) at different potential scan rates. Numbers
1-19 correspond to 10, 15, 20, 25, 30, 35, 40, 45, 50, 55, 60, 65, 70, 75, 80, 85, 90, 95 and 100 mV s−1, respectively. Insets: (A) plots of anodic and
cathodic peak currents vs. the scan rate (B) variation of the peak potentials vs. the logarithm of the scan rate and (C) magnification of the plot inset B for high potential scan rates.
Figure 2. Cyclic voltammograms of OMWCNT-GCE in a 0.1 mol L-1
phosphate buffer solution (pH 7) at scan rate 10 mV s–1 in the absence
(a) and presence of 1.0 mmol L-1 DA (b). (c) as (a) and (d) as (b) for in
disappeared, reflecting the efficiency of the catalytic reaction. The reason is that the DA in solution state diffuses up to the electrode surface and reduces OMWCNT (ox) to OMWCNT (red). This process increases the anodic peak current, while the cathodic peak current is smaller in the absence of DA.
Under the same experimental conditions, the cyclic voltammograms of OMGCE in the absence and in the presence of 1.0 mmol L-1 DA are recorded (Figure 2,
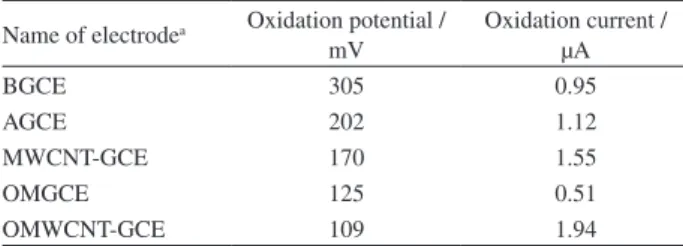
curves c and d). The cyclic voltammograms corresponding to the DA solution at the MWCNT (curve e) and the activated (curve f) GCE show irreversible waves with peak potentials of approximately 170 and 202 mV, respectively. Table 1 presents the electrochemical characteristics of DA oxidation on various electrode surfaces. As can be seen, if the oxidation of DA is evaluated at OMGCE and OMWCNT-GCE, there is a dramatic enhancement in the anodic peak current at the OMWCNT modified GCE as compared to the value obtained at OMGCE. The above results clearly show that a combination of MWCNT and oxadiazole definitely improves the characteristics of DA oxidation.
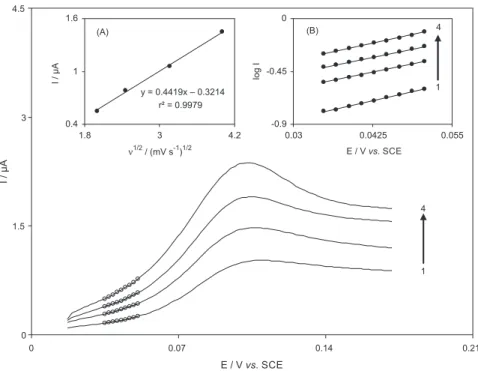
The linear sweep voltammograms of 0.40 mmol L-1
DA at different potential scan rates are shown in Figure 3. Inset A of Figure 3 suggests that the plot of the catalytic peak current vs. the square root of the scan rate is linear. This is to say that the reaction is diffusion-limited. The electrocatalytic oxidation of DA at the OMWCNT-GCE surface according to an ErCi catalytic (ErC'i) mechanism
can be depicted as in the following equations:
Oxadiazole(reduced form)D Oxadiazole(oxidized form) + 2H + + 2e–, E
r (3)
Oxadiazole(oxidized form) + DAred→ Oxadiazole(reduced form) + DAox + H2, C'I (4)
As can be seen, at the first step, oxadiazole(reduced form)
oxidize to oxadiazole(oxidized form) in two electron-two proton
process.25 Then, in the presence of DA, oxadiazole
(oxidized form)
reduces to oxadiazole(reduced form). So, oxadiazole(reduced form)
creates at the MWCNT-GCE surface again, and the first step repeats. Therefore, the anodic peak current increases and cathodic peak current decreases. The symbols Er and
C'i imply the reversible electrochemical and irreversible
catalytic chemical reactions. For an ErC'i mechanism,
Andrieux and Saveant33 developed a theoretical model and
derived the following equation involving the electrocatalytic peak current and the concentration of the substrate for a case of a slow scan rate and a large catalytic rate constant, k':
Icat = 0.496 nFACb (nFAD ν/(RT))
1/2 (5)
where D and Cb are the diffusion coefficient (cm
2 s−1) and
the bulk concentration (mol cm−3) of the substrate (DA in
this case), respectively. Low values of k' result in values lower than 0.496 for the constant. For low scan rates (4-16 mV s−1), the value of this constant is found to be 0.3
for an OMWCNT-GCE with a geometric area (A = πr2,
r = 1 mm) of 0.0314 cm2, considering D = 4.7 × 10⁻⁶ cm2 s−1
(this is obtained by chronoamperometry as below) in the presence of 0.4 mmol L-1 of DA. Using this value as well as
Figure 1 in the theoretical work by Andrieux and Saveant,32
an average value of k' = (1.1 ± 0.036) × 10−3 cm s−1
was obtained for potential scan rates ranging from 4 to 16 mV s−1.
From the slope of Ip vs. ν1/2 plot (0.4419), one may
determine the number of electrons in the overall reaction. According to the following equation derived for a totally irreversible diffusion controlled processes:
Ip = 3.01 × 10
5 n [(1 – α)n α]
1/2 AC bD
1/2ν1/2 (6)
and considering (1 – α) nα = 0.68 (see below),
D = 4.7 × 10⁻⁶ cm2 s–1 and A = 0.0314 cm2 were calculated
by chronoamperometry. It is estimated that the total number of electrons involved in the anodic oxidation of DA is n = 2.07 ≅ 2. Similar values were also previously reported for the electrooxidation of DA.34-36 Inset B of Figure 3 shows
a Tafel plot that was drawn from the data of the rising part of the current voltage curve recorded at potential scan rates of 4-16 mV s−1. This part of voltammogram, known as Tafel
region, is affected by the electron transfer kinetics between substrate (DA) and surface confined OMCNT, assuming the deprotonation of substrate as a sufficiently fast step. In this condition, the number of electrons involved in the rate-determining step can be estimated from the slope of Tafel plot. A slope of 0.115 V decade−1 is obtained.
Assuming a transfer coefficient of α = 0.32, this slope indicates a one-electron transfer to be rate-limiting. Also, from the intercept of the Tafel plots, the average value
Table 1. Comparison of electrocatalytic oxidation of DA (1.0 mmol L-1)
on various electrode surfaces at pH 7.0
Name of electrodea Oxidation potential /
mV
Oxidationcurrent / µA
BGCE 305 0.95
AGCE 202 1.12
MWCNT-GCE 170 1.55
OMGCE 125 0.51
OMWCNT-GCE 109 1.94
aBGCE: bare glassy carbon electrode; AGCE: activated glassy carbon
obtained for the exchange current density (J0) of DA at
OMWCNT-GCE is found to be 3.84 µA cm−1. The value
obtained for J0 is comparable with the exchange current
density DA at oracet blue modified glassy carbon electrode that is 3.99 µA cm−1.35 The large value of J
0 justifies the fast
establishment of the equilibrium. Also, this value shows that the electron transfer of DA at OMWCNT-GCE is as facile as the other modified electrodes.
Chronoamperometric studies
The catalytic oxidation of DA at OMWCNT-GCE was also studied by chronoamperometry. The chronoamperograms obtained at a potential step of 125 mV are depicted in Figure 4A. In the chronoamperometric studies, the diffusion coefficient of DA for an OMWCNT-GCE was determined. For an electroactive material (DA in this case) with a diffusion coefficient of D, the current of the electrochemical reaction (at a mass transport limited rate) was described by the Cottrell equation:
I = nFAD1/2 C/(π1/2 t1/2) (7)
where D and Cb are the diffusion coefficient (cm
2 s−1) and
the bulk concentration (mol cm−3) respectively. Under
diffusion control, the plot of I vs. t−1/2 will be linear and,
from its slope, the value of D can be obtained. such studies wer carried out in various DA concentrations for an OMWCNT-GCE. Figure 4B shows the experimental
plots with the best fits for different concentrations of DA employed. The slopes of the resulting straight lines were then plotted vs. the DA concentration (Figure 4C), from whose slope a diffusion coefficient of 4.7 × 10⁻⁶ cm2 s−1 was
calculated. This value of diffusion coefficient is comparable with 5.8 × 10−6,35 4.52 × 10−637 and 6.1 × 10⁻⁶ cm2 s−1,38
which are reported for DA.
Differential pulse voltammetric detection of DA at OMWCNT-GCE
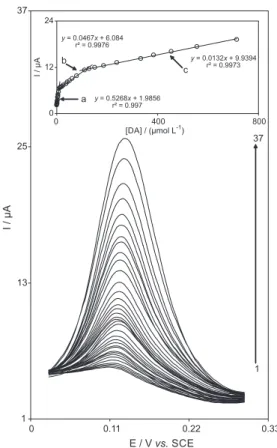
Since DPV has a much higher current sensitivity than cyclic voltammetry, it was used to estimate the lower limit of detection and the linear range of DA. In addition, the contribution of the charging current to the background current, which is a limiting factor in analytical determination, is lower in a DPV mode. The effects of increasing the concentration of DA on the voltammograms are presented in Figure 5A (in the range of 0.46-714.28 µmol L-1). Also, the inset of Figure 5 clearly
indicates that the plot of the peak current vs. the DA concentration is formed of three linear segments (0.46-8.8, 8.8-111.1 and 111.1-714.3 µmol L-1) with different slopes.
The calibration plot in the range of 0.46-8.8 µmol L-1 DA
was used to estimate the lower limit of DA detection at OMWCNT-GCE. According to the previously reported method,39 the lower limit of detection (LOD) was found
to be 0.12 µmol L-1 by using the equation LOD = 3s bl/m,
where sbl is the standard deviation of the blank response and Figure 3. Linear sweep voltammograms at different potential scan rates of OMWCNT-GCE in a 0.1 mol L-1 phosphate buffer (pH 7.0) containing 0.4 mmol L-1
m is the slope of the calibration plot (0.5268 µA µmol L-1).
The lower limit of detection of DA determined at OMWCNT-GCE is lower than those previously reported for other modified electrodes.40-44 The average voltammetric
peak current and the precision estimated in terms of the coefficient of variation for repeated measurements
(n = 12) of 5.0 µmol L-1 DA at OMWCNT-GCE were
4.7 ± 0.12 µA and 2.5%, respectively. As shown in Table 2, some of the response characteristics obtained for DA in this study are compared with other hydroquinone23,35,44 and
nonhydroquinone3,40-43,45-47 compounds as a modifier.
According to the table, the responses of the proposed modified electrode are superior in some cases to those of the previously reported modified electrodes.
Simultaneous determination of DA, AC, and Trp
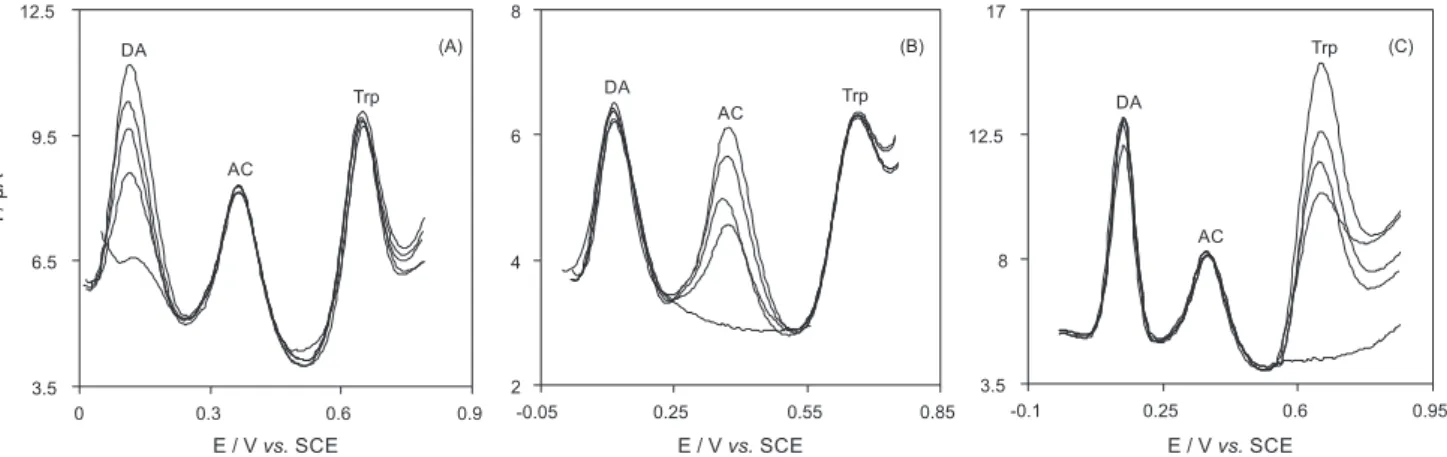
Figure 6 shows the differential pulse voltammetric responses which were gained by varying either DA (Figure 4A), AC (Figure 4B) or Trp (Figure 4C) concentrations while the concentration of the other compound was kept constant. As can be seen in Figure 6A, the electrochemical response of DA in the presence of a constant concentration of 150.0 µmol L-1 AC and 350.0 µmol L-1 Trp increased with
enhance of the DA concentration, while the response of AC and Trp remained almost constant. Similarly, Figure 6B shows DPVs obtained by increasing the concentrations of AC in the presence of 100.0 µmol L-1 DA and 350.0 µmol L-1
Figure 4. (A) Chronoamperometric response of OMWCNT-GCE in a 0.1 mol L-1 phosphate buffer solution (pH 7.0) at a potential step of 1250 mV for
different concentrations of DA. Numbers of 1-10 correspond to 0.01, 0.02, 0.04, 0.06, 0.08, 0.1, 0.2, 0.4, 0.6 and 0.8 mmol L-1 DA. (B) Plots of I vs. t−1/2
obtained from the chronoamperograms and (C) plot of the slope of the straight lines against the DA concentration.
Figure 5. (A) Differential pulse voltammograms of OMWCNT-GCE in a 0.1 mol L-1 phosphate buffer solution (pH 7.0) containing different
concentrations of DA. Numbers 1-37 correspond to 4.1-833.3 µmol L-1
Trp. As can be observed, an increase in the peak current of AC occurs with an increase in AC concentration, while the voltammetric peak of DA and Trp is almost unchanged during the oxidation of AC. Also, Figure 6C indicates DPVs obtained by increasing the concentrations of Trp in the presence of 250.0 µmol L-1 DA and 150.0 µmol L-1
AC. Similarly, the peak current of Trp increases with an increase in Trp concentration, while the voltammetric peaks of DA and AC are almost constant. Therefore, the results confirm that the responses to DA, AC and Trp at the OMWCNT-GCE surface are relatively independent.
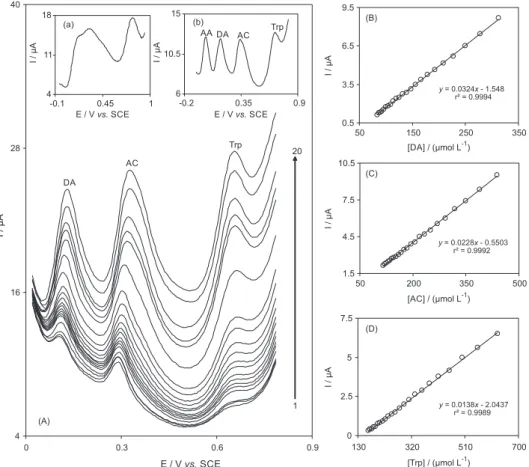
Figure 7A shows DPVs obtained with increasing concentrations of DA, AC and Trp. In the case of OMWCNT-GCE, three well distinguished anodic peaks at the potentials of 128, 327 and 655 mV, corresponding to the oxidation of DA, AC and Trp, respectively, were observed. Observations were also made of substantial increases in the peak currents due to an increase in the concentration of DA, AC and Trp. The inset a of Figure 7A
shows DPV of a 300.0 µmol L-1 DA, 300.0 µmol L-1
AC and 400.0 µmol L-1 Trp mixture at a bare GCE. As it
suggests, the bare GCE could not separate the voltammetric signals of DA, AC and of Trp. Inset b of Figure 7 indicates DPV obtained for the oxidation of 600.0 µmol L-1 AA,
160.0 µmol L-1 DA, 210.0 µmol L-1 AC and 370.0 µmol L-1
Trp at OMWCNT-GCE. It can be seen at OMWCNT-GCE that four well distinguished anodic peaks to the oxidation of AA, DA, AC and Trp were observed. It was concluded that AA had no interference to the detection of DA, AC and Trp at OMWCNT-GCE. Therefore, this modified electrode can determine DA, AC and Trp in the presence of large amounts of AA. Figures 7B, 7C and 7D show that the calibration curves for DA, AC and Trp were linear for the whole worked concentration range of 83.3-312.5 µmol L-1 for DA,
116.7-437.5 µmol L-1 for AC, and 166.7-625.0 µmol L-1 for
Trp with good correlation coefficients.
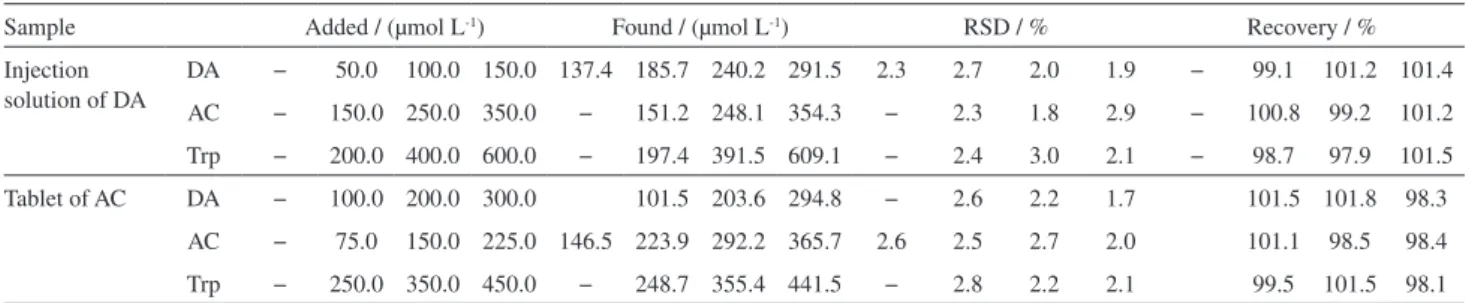
In order to confirm the reliability of MWCNT-GCE for the analysis of DA and AC in pharmaceutical formulations, the modified electrode was used to determine DA and AC in an injection solution of DA (40 mg mL–1) and AC
tablets (0.4272 g, 760.8 mg g−1 AC). The injection solution
of DA was diluted 1500 times, and the AC tablets were dissolved in 1000 mL of doubly distilled water and diluted 35 times with a phosphate buffer solution (pH 7.0) before the measurements. Then, the diluted analyte solutions were placed in an electrochemical cell to determine DA and AC. Based on the currents of repeated DPVs (n = 3) and using the calibration plot which are shown in Figures 6B and 6C, the concentrations of DA and AC in the diluted DA and AC solutions were obtained as 137.4 ± 3.2 µmol L-1 and
146.5 ± 3.8 µmol L-1, respectively. The total value of DA in the
injection solution was found to be 39.1 ± 0.9 mg mL−1. Also,
the total value of AC in the tablet was 775.1 ± 20.1 mg g−1.
These results are in agreement with wich is declared in the label of the pharmaceutical products. To authenticate the validity of the results, the diluted samples were spiked with certain amounts of DA and AC at levels similar to those found in the samples themselves as shown in Table 3. The results in Table 3 show that the relative standard deviations (%) and the recovery rates of the spiked samples were acceptable. Thus, the proposed modified electrode can be efficiently used for the simultaneous determination of DA in injection solutions and of AC in tablets.
Conclusions
In this study, a cyclic voltammetry method was used for the electrodeposition of oxadiazole on a multi-wall
Figure 6. (A) Differential pulse voltammograms of OMWCNT-GCE in a 0.1 mol L-1 phosphate buffer solution (pH 7.0) containing 150.0 µmol L-1 AC,
350.0 µmol L-1 Trp and different concentrations of DA (0.0, 120.0, 150.0, 180.0 and 210.0 µmol L-1). (B) Differential pulse voltammograms of OMWCNT-GCE
in a 0.1 mol L-1 phosphate buffer solution (pH 7.0) containing 100.0 µmol L-1 DA, 350.0 µmol L-1 Trp and different concentrations of AC (0.0, 90.0, 120.0,
150.0 and 180.0 µmol L-1). (C) Differential pulse voltammograms of OMWCNT-GCE in a 0.1 mol L-1 phosphate buffer solution (pH 7.0) containing
Table 2. Comparison of analytical parameters of several modified electrodes for DA determination
Modified electrodea Methodb Linear range /
(µmol L-1)
Detection limit / (µmol L-1)
Sensitivity / (µA µmol L-1)
Concomitant
compound Reference
Polyglycine-CPE CV – 0.1 – AA 3
polyDAN-RB4/GC DPV 0.2-150.0 0.061 0.04246 AA, UA 23
OB-GCE DPV 0.06-0.8 0.02 0.147 AA, UA 35
0.8-8.0 0.082
SGN/NiPc DPV 40.0-1080.0 0.26 0.104 AA 40
PEB-GCE DPV 1.0-30 0.25 0.330 AA-AU 41
(OMC)/Nafion composite film DPV 1-90 0.5 – AA, UA 42
Pd/CNF-CPE DPV 0.5-160 0.2 – AA, UA 43
IMWCNT−CPE DPV 1.9-84.1 0.52 0.015 UA 44
84.1-771.7 0.0056
poly (Tyr)/MWCNTs-COOH/GCE DPV 0.1-30 0.02 – AA, UA 45
CPBC-GCE DPV 40-5000 – 0.0038 AA 46
Nafion/Ni(OH)2-MWNTs/GCE DPV 0.05-25 0.015 1.991 AA, ST 47
OMWCNT-GCE DPV 0.46-8.8, 8.8-111.1, 111.1-714.3 0.12 0.5268 AC, Trp this work
0.0467 0.0132
aPolyDAN-RB4/GC: poly1,5-diaminonaphthalene reactive blue-4 glassy carbon electrode; OB-GCE: oracet blue modified glassy carbon electrode;
SGN/NiPc: SiO2/C-graphite matrices Ni(II) phthalocyanine; poly (Tyr)/MWCNTs-COOH/GCE: poly (tyrosine)/carboxylated multi-walled carbon nanotubes modified glassy carbon electrode; PEB-GCE: poly(Evans blue) modified glassy carbon electrode; OMC: ordered mesoporous carbon; CPBC-GCE: cetylpyridine bromide-chitosan modified glassy carbon electrode; Pd/CNF-CPE: palladium nanoparticle-loaded carbon nanofibers modified carbon paste electrode; Nafion/Ni(OH)2-MWNTs/GCE: Nafion/Ni(OH)2 nanoparticles-carbon nanotube composite modified glassy carbon electrode; IMWCNT-CPE: Indenedione multi-walled carbon nanotubes modified carbon paste electrode; OMWCNT-CPE: Oxadiazole multi-walled carbon nanotubes modified glassy carbon electrode. bCV: cyclic voltammetry; DPV: differential pulse voltammetry.
Figure 7. (A) Differential pulse voltammograms of OMWCNT-GCE in a 0.1 mol L-1 phosphate buffer solution (pH 7.0) containing different concentrations of
DA, AC and Trp. Numbers 1-20 correspond to 83.3-312.5 µmol L-1 DA, 116.7-437.5 µmol L-1 AC and 166.7-625.0 µmol L-1 Trp. Insets: (a) differential pulse
voltammogram of a mixed solution of 300.0 µmol L-1 DA, 300.0 µmol L-1 AC and 400.0 µmol L-1 Trp at a bare GCE (b) differential pulse voltammogram
of a mixed solution of 600.0 µmol L-1 AA, 160.0 µmol L-1 DA, 210.0 µmol L-1 AC and 370.0 µmol L-1 Trp at OMWCNT-GCE. (B)-(D) show the plots of
Table 3. Determination and recovery results of DA in an injection solution and tablet of AC at OMWCNT-GCE
Sample Added / (µmol L-1) Found / (µmol L-1) RSD / % Recovery / %
Injection solution of DA
DA − 50.0 100.0 150.0 137.4 185.7 240.2 291.5 2.3 2.7 2.0 1.9 − 99.1 101.2 101.4
AC − 150.0 250.0 350.0 − 151.2 248.1 354.3 − 2.3 1.8 2.9 − 100.8 99.2 101.2
Trp − 200.0 400.0 600.0 − 197.4 391.5 609.1 − 2.4 3.0 2.1 − 98.7 97.9 101.5
Tablet of AC DA − 100.0 200.0 300.0 101.5 203.6 294.8 − 2.6 2.2 1.7 101.5 101.8 98.3
AC − 75.0 150.0 225.0 146.5 223.9 292.2 365.7 2.6 2.5 2.7 2.0 101.1 98.5 98.4
Trp − 250.0 350.0 450.0 − 248.7 355.4 441.5 − 2.8 2.2 2.1 99.5 101.5 98.1
carbon nanotubes modified GCE (OMWCNT-GCE). The oxadiazole electrodeposited on the MWCNT-GCE exhibited an excellent electrocatalytic liability for the electrooxidation of DA, which proved to be due to a reduced overpotential and an increased peak current. The values (1.1 ± 0.03) × 10−3 cm s−1 and 0.32 were obtained
respectively for the standard heterogeneous rate constant (k') and the transfer coefficient (α) between the deposited OMWCN layer and DA. The diffusion coefficient of DA was found to be 4.7 × 10⁻⁶ cm2 s–1 in experimental conditions,
using chronoamperometric results. In differential pulse voltammetric determination, the limit of detection of DA was 0.12 µmol L-1, and the calibration plots were linear
within three ranges. Unlike the bare GCE, OMWCNT-GCE could separate the oxidation peak potentials of DA, AD and Trp present in the mixture solutions. This study also demonstrated the practical analytical utility of the modified electrode for the determination of DA and AC in pharmaceutical products.
Acknowledgments
The authors express their appreciation to the Islamic Azad University (Yazd) Research Council for financial support for this work.
References
1. B e h p o u r, M . ; G h o r e i s h i , S . M . ; H o n a r m a n d , E . ; Salavati-Niasari, M.; J. Electroanal. Chem. 2011, 653, 75. 2. Biswal, J.; Misra, N.; Borde, L. C.; Sabharwal, S.; Radiat. Phys.
Chem.2013, 83, 67.
3. Zhou, X.; Zheng, N.; Hou, S.; Li, X.; Yuan, Z.; J. Electroanal. Chem. 2010, 642, 30.
4. Niu, X.; Yang, W.; Guo, H.; Ren, J.; Gao, J.; Biosens. Bioelectron.2013, 41, 225.
5. Ndangili, P. M.; Arotiba, O. A.; Baker, P. G. L.; Iwuoha, E. I.; J. Electroanal. Chem. 2010, 643, 77.
6. Deng, C.; Chen, J.; Yang, M.; Nie, Z.; Si, S.; Electrochim. Acta
2011, 56, 8851.
7. Huang, K.-J.; Jing, Q.-S.; Wua, Z.-W.; Wanga, L.; Wei, C.-Y.; Colloids Surf., B2011, 88, 310.
8. Anu Prathap, M. U.; Srivastava, R.; Sens. Actuators, B2013, 177, 239.
9. Jia, D.; Dai, J.; Yuan, H.; Lei, L.; Xiao, D.; Talanta2011, 85, 2344.
10. Silva, L. M. S.; Garcia, M. B. Q.; Lima, J. L. F. C.; Barrado, E.; Anal. Chim. Acta 2006, 573-574, 383.
11. Wang, S. F.; Xie, F.; Hu, R. F.; Sens. Actuators, B2007, 123, 495.
12. Li, M.; Jing, L.; Electrochim. Acta2007, 52, 3250.
13. Habibi, B.; Jahanbakhshi, M.; Pournaghi-Azar, M. H.; Anal. Biochem.2011, 411, 167.
14. Sanghavi, B. J.; Srivastava, A. K.; Anal.Chim. Acta2011, 706, 246.
15. M a s aw a t , P. ; L i aw r u a n g r a t h , S . ; Va n e e s o r n , Y. ; Liawruangrath, B.; Talanta2002, 58, 1221.
16. Vaughan, P. A.; Scott, L. D. L.; McAller, J. F.; Anal. Chim. Acta
1991, 248, 361.
17. Raoof, J. B.; Ojani, R.; Baghayeri, M.; Sens. Actuators, B2009, 143, 261.
18. Fang, B.; Wei, Y.; Li, M.; Wang, G.; Zhang, W.; Talanta2007, 72, 1302.
19. Huanga, K. J.; Xua, C. X.; Xiea, W. Z.; Wang, W.; Colloids Surf., B2009, 74, 167.
20. Liu, X.; Luo, L.; Ding, Y.; Ye, D.; Bioelectrochem. 2011, 82, 38. 21. Nan, C. G.; Feng, Z. Z.; Li, W. X.; Ping, D. J.; Qin, C. H.; Anal.
Chim. Acta2002, 452, 245.
22. Kang, S. Z.; Chen, H.; Li, X.; Mu, J.; Diamond Relat. Mater.
2010, 19, 1221.
23. Chandra, P.; Son, N. X.; Noh, H.-B.; Goyal, R. N.; Shim, Y.-B.; Biosens. Bioelectron.2013, 39, 139.
24. Willner, P.; Scheel-Kruger, J.; Belzung, C.; Neurosci. Biobehav. Rev.2012, in press, DOI: 10.1016/j.neubiorev.2012.12.007.
25. Nasirizadeh, N.; Zare, H. R.; Fakhari, A. R.; Ahmar, H.; Ahmadzadeh, M. R.; Naeimi, A.; J. Solid State Electrochem.
2011, 15, 2683.
26. Fakhari, A. R.; Davarani, S. S. H.; Ahmar, H.; Hasheminasab, K.; Khavasi, H. R.; J. Heterocyc. Chem.2009, 46, 443.
28. Zare, H. R.; Shekari, Z.; Nasirizadeh, N.; Jafari, A. A.; Catal. Sci. Technol. 2012, 2, 2492.
29. Zare, H. R.; Golabi, S. M.; J. Solid State Electrochem.2000, 4, 87.
30. Nasirizadeh, N.; Shekari, Z.; Zare, H. R.; Shishehbor, M. R.; Fakhari, A. R.; Ahmar, H.; Biosens. Bioelectron.2013, 41, 608. 31. Zare, H. R.; Nasirizadeh, N.; Mazloum-Ardakani, M.;
J. Electroanal. Chem. 2005, 577, 25.
32. Zare, H. R.; Chatraei, F.; Nasirizadeh, N.; J. Braz. Chem. Soc.
2010, 21, 1977.
33. Andrieux, C. P.; Saveant, J. M.; J. Electroanal. Chem. 1978, 93, 163.
34. Luz, R. C. S.; Damos, F. S.; Oliveira, A. B.; Beck, J.; Kubota, L. T.; Electrochim. Acta2005, 50, 2675.
35. Zare, H. R.; Rajabzadeh, N.; Nasirizadeh, N.; Mazloum Ardakani, M.; J. Electroanal. Chem. 2006, 589, 60.
36. Khudaish, E. A.; Al Birikei, M. R.; J. Electroanal. Chem. 2010, 650, 68.
37. Chen, S.-M.; Chen, J. Y.; Vasantha, V. S.; Electrochim. Acta
2006, 52, 455.
38. Vasantha, V. S.; Chen, S.-M.; J. Electroanal. Chem. 2006, 592, 77.
39. Bard, A. J.; Faulkner, L. R.; Electrochemical Methods, Fundamentals and Applications; John Wiley & Sons, Inc.:
New York, USA, 2001.
40. Barros, S. B. A.; Rahim, A.; Tanaka, A. A.; Arenas, L. T.; Landers, R.; Gushikem, Y.; Electrochim. Acta 2013, 87, 140. 41. Lin, L.; Chen, J.; Yao, H.; Chen, Y.; Zheng, Y.; Lin, X.;
Bioelectrochem.2008, 73, 11.
42. Zheng, D.; Ye, J.; Zhou, L.; Zhang, Y.; Yu, C.; J. Electroanal. Chem. 2009, 625, 82.
43. Huang, J.; Liu, Y.; Hou, H.; You, T.; Biosens. Bioelectron.2008, 24, 632.
44. Nasirizadeh, N.; Shekari, Z.; Zare, H. R.; Makarem, S.; Mater. Sci. Eng., C2013, 33, 1491.
45. Wang, Y.; Bi, C.; J. Mol. Liq.2013, 177, 26.
46. Cao, X.; Luo, L.; Ding, Y.; Zou, X.; Bian, R.; Sens. Actuators, B
2008, 129, 941.
47. Babaei, A.; Taheri, A. R.; Sens. Actuators, B2013, 176, 543.
Submitted: April 4, 2013